Back to blog
15 MIN READ
Web Analytics Reporting Best Practices and Example Reports
PUBLISHED
24 January, 2025

Product Analytics Expert
Web analytics reporting is the cornerstone of understanding your website’s performance. It turns raw data into actionable insights that help you make smarter decisions.
Imagine knowing exactly where users drop off or what drives them to convert. That’s the power of effective reporting.
By tracking the right metrics, you can uncover trends, optimize strategies, and boost engagement. But not all reports are created equal.
To create reports that truly inform and inspire action, you need the right approach, tools, and techniques. Let’s dive in and explore how to master web analytics reporting.
Key types of web analytics reports
Web analytics reporting is not one-size-fits-all. Different reports serve different purposes, each designed to uncover unique insights about your website's performance. Whether you're analyzing user behavior, tracking conversions, or measuring retention, knowing which report to use is critical.
The right tools paired with the right metrics can help you dig deeper into traffic patterns, optimize user experiences, and improve your bottom line. By understanding these report types, you can make targeted decisions that align with your business goals.
Here’s a quick summary of the most important report types, the metrics they track, and the tools to create them.
| Type of Web Report | Metrics to Track | Recommended Tools |
|---|---|---|
| Traffic Reports | Sessions, Users, New vs. Returning Visitors | Google Analytics, UXCam |
| Behavior Reports | User Flow, Heatmaps, Content Performance | UXCam, Crazy Egg, Hotjar |
| Conversion Reports | Goal Completions, Cart Abandonment, Funnel Analysis | UXCam, Mixpanel, Amplitude |
| Acquisition Reports | Source/Medium Breakdown, Campaign ROI | Google Analytics, HubSpot |
| Retention and Cohort Analysis Reports | User Churn, Retention Rate, Cohort Behaviors | UXCam, Heap, Amplitude |
Here's a quick demo on how to create reports with UXCam:
1. Traffic Reports
How it helps - To understand where your visitors come from
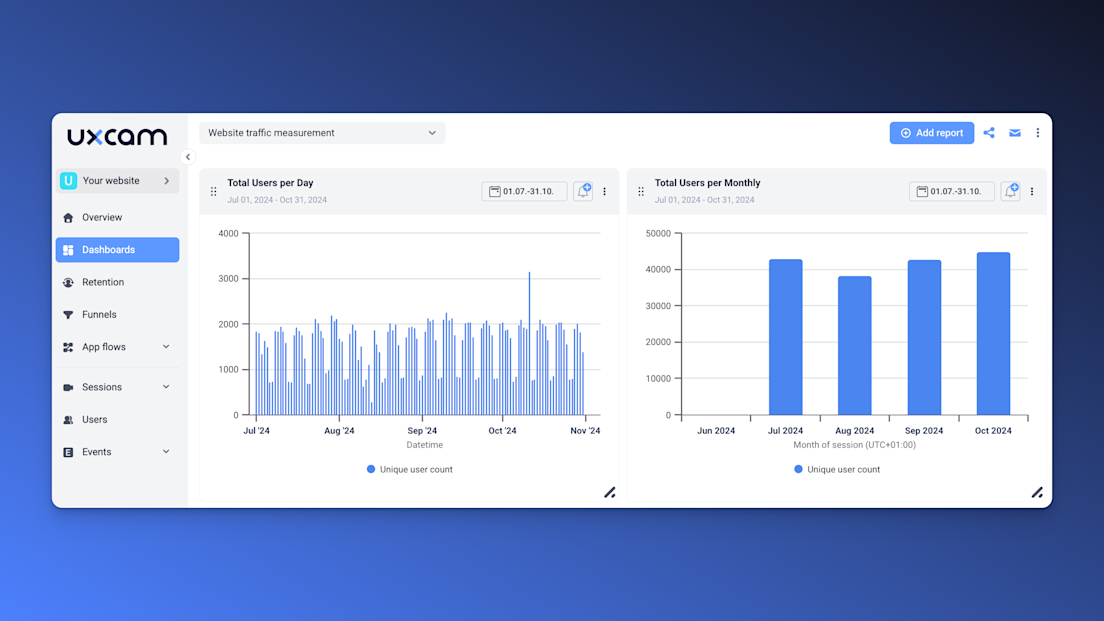

Traffic reports give you a clear picture of who’s visiting your website and how they found it. By analyzing metrics such as sessions, users, and the ratio of new versus returning visitors, you can assess the volume and quality of your audience.
For example:
Sessions: How many times visitors interacted with your website within a given timeframe.
Users: The total number of unique visitors to your site.
New vs. returning visitors: Are you reaching fresh audiences or retaining loyal users?
Recommended Tools:
Google Analytics: Break down traffic sources by direct, organic, referral, or paid campaigns.
UXCam: Offers robust segmentation options for deeper traffic analysis.
These reports help you prioritize marketing efforts, target the right channels, and benchmark overall site performance.
2. Behavior Reports
How it helps - To visualize user interactions and identify friction points
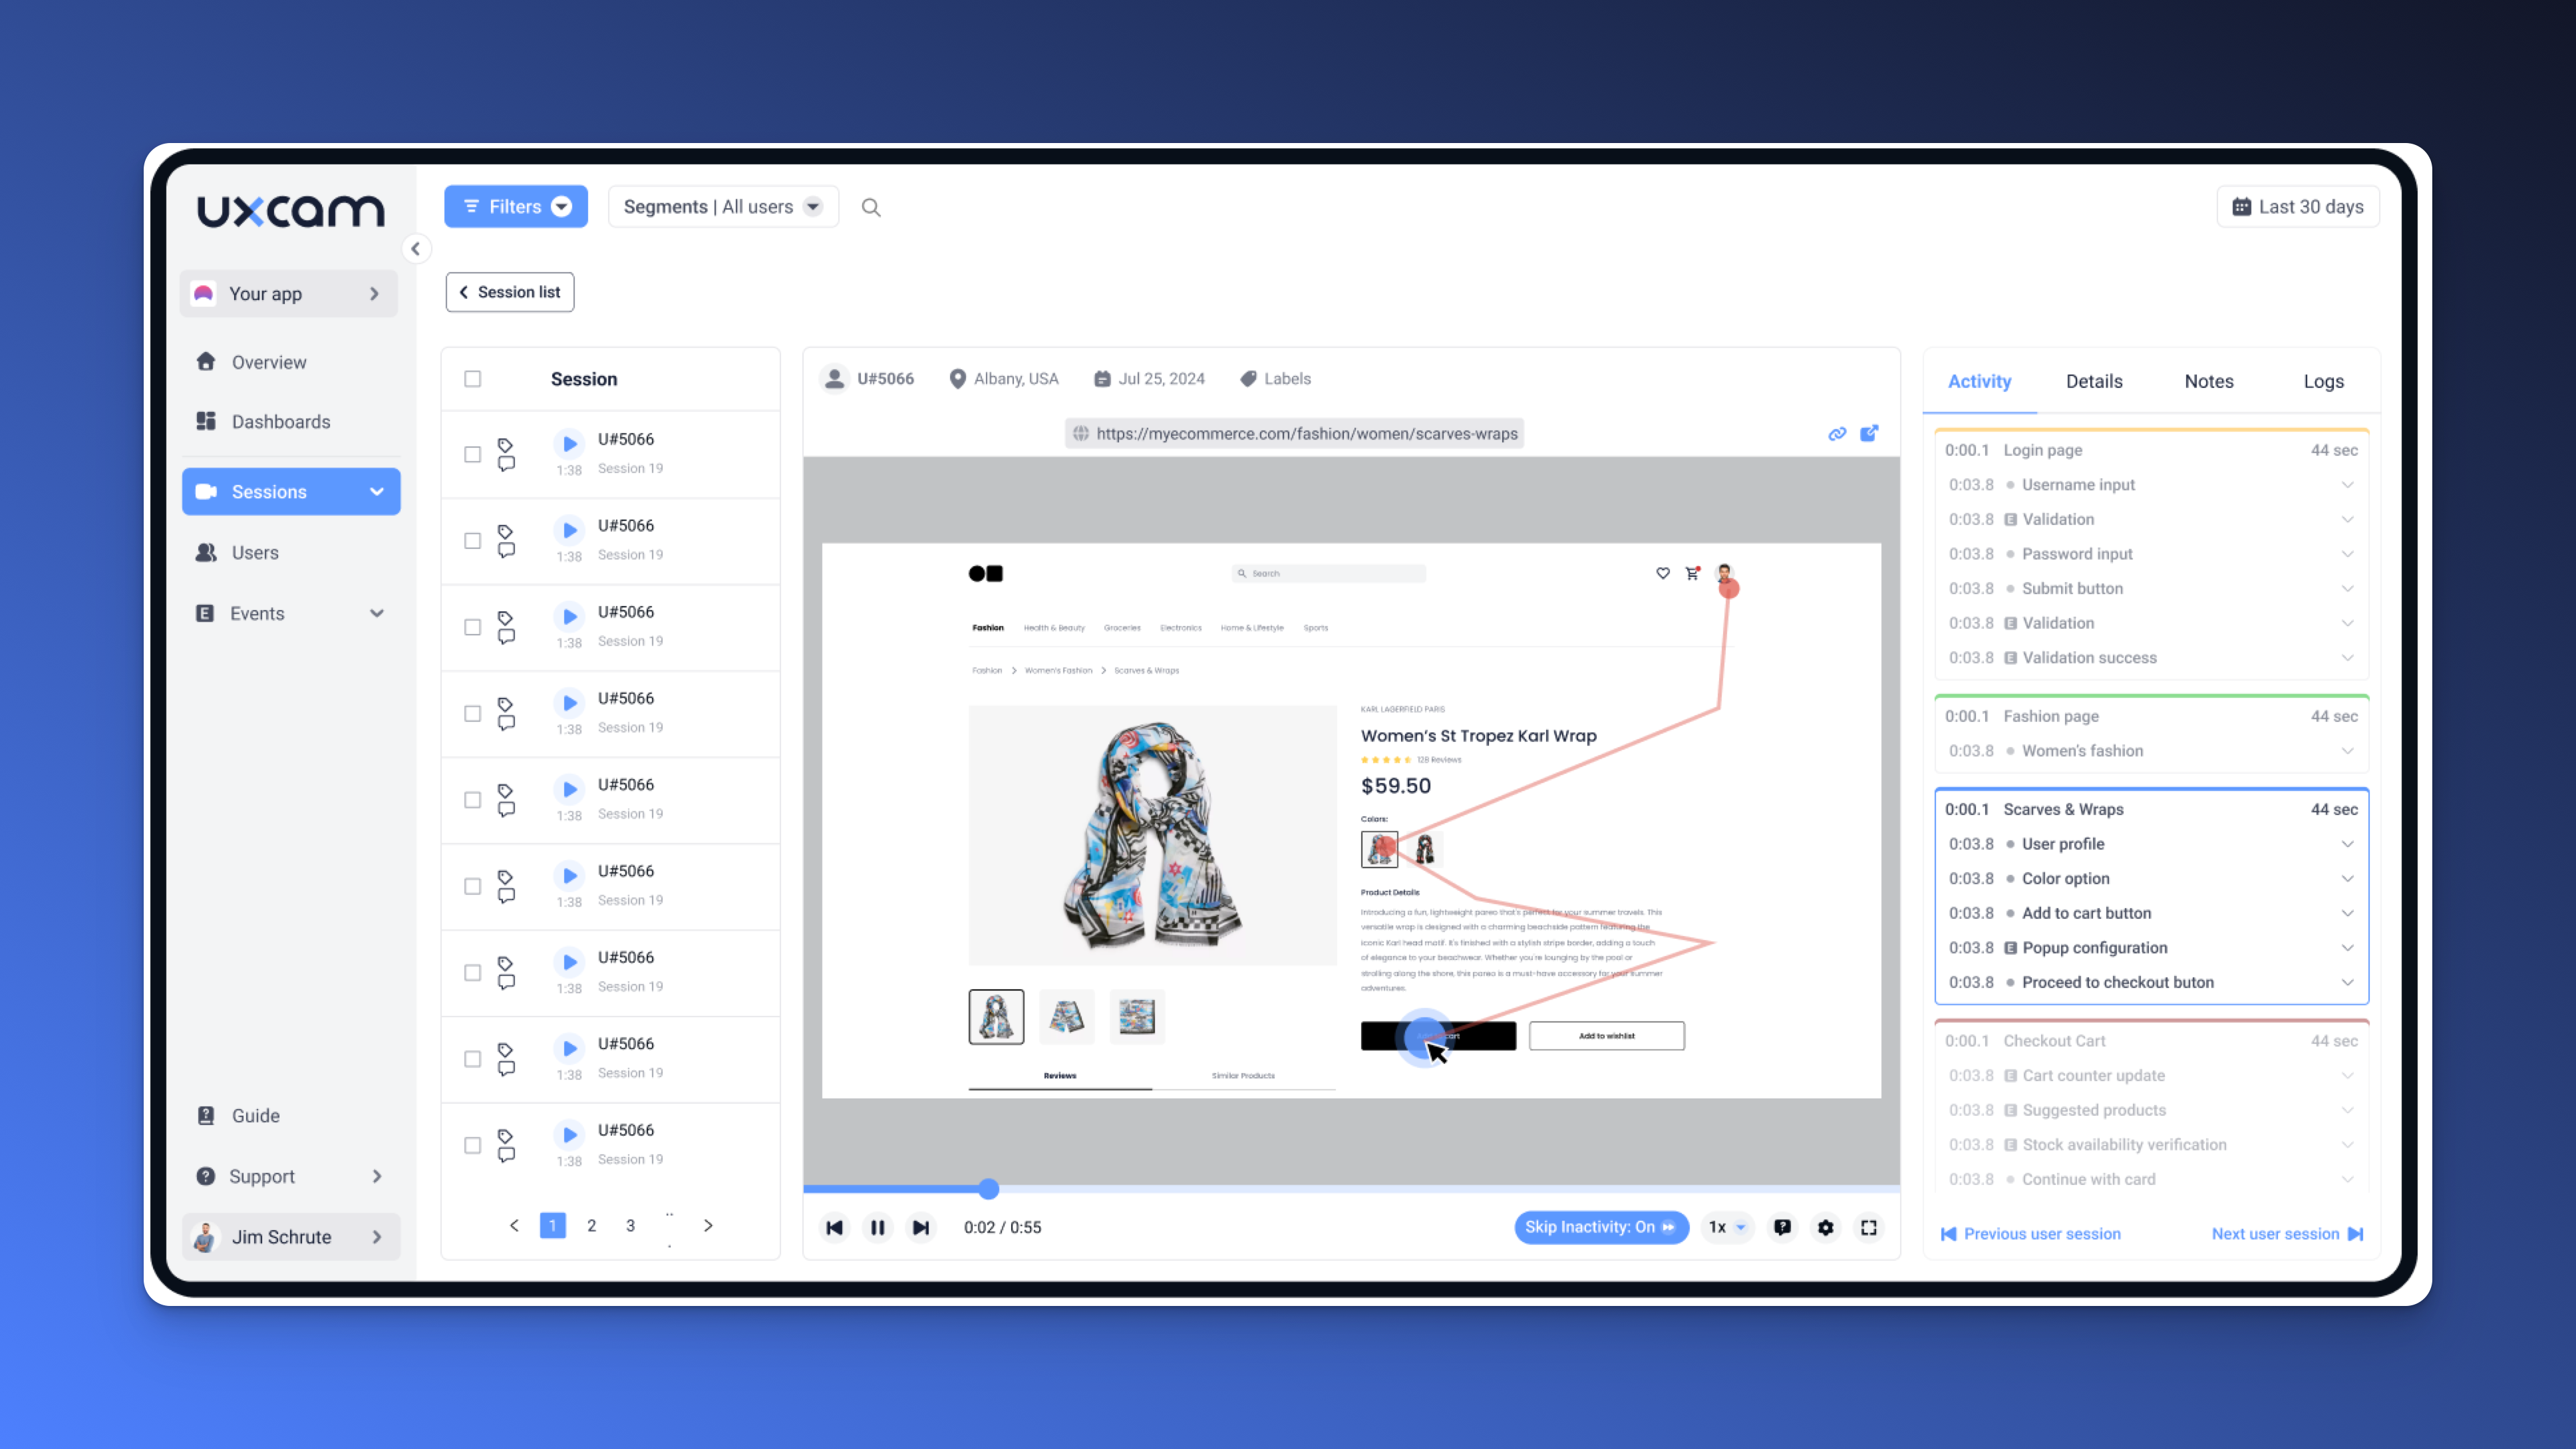

Behavior reports highlight how users navigate your site, interact with content, and encounter potential barriers. This type of reporting focuses on understanding user flow, heatmaps, and the performance of individual pages on your website or web app.
Key insights include:
User flow: Visualize how users move between pages to spot drop-offs.
Heatmaps: Understand where users click, scroll, or ignore.
Content performance: Identify which pages or elements keep users engaged the longest.
Recommended Tool:
UXCam: Provides session replay to see exactly how users interact with your site.
Hotjar: Combines heatmaps, recordings, and surveys to understand user actions.
Behavior reports are crucial for identifying usability issues and optimizing site navigation to improve user experience.
Why you should choose UXCam for Web
UXCam empowers you to move faster, make better decisions, and build better products by combining powerful quantitative insights with qualitative context.
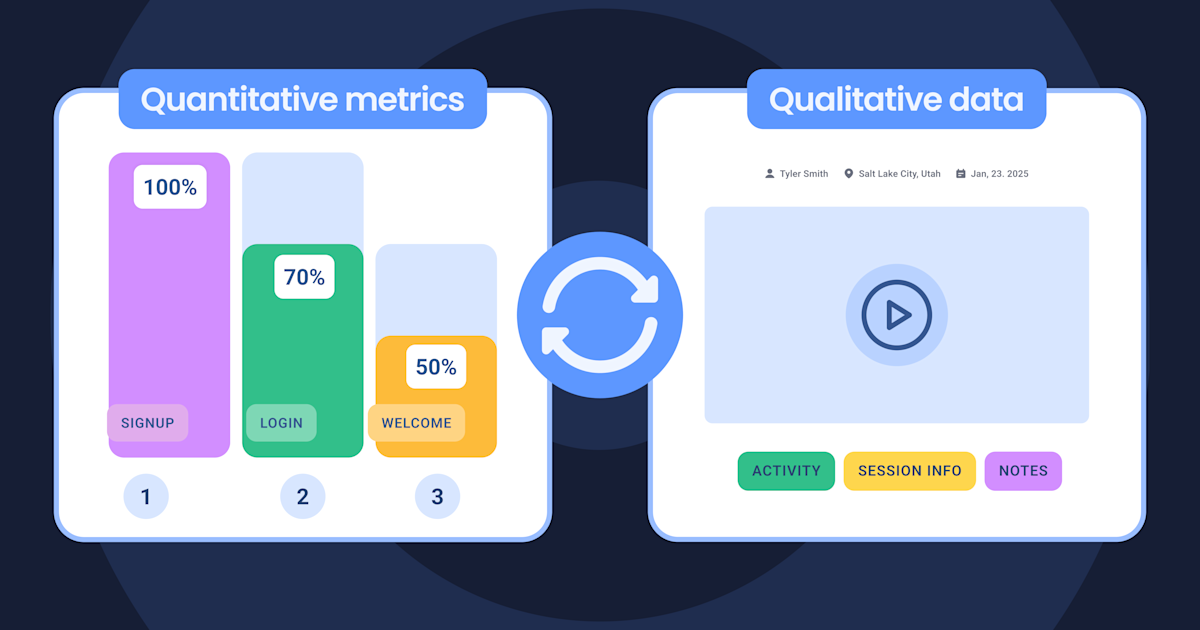

Most analytics tools force you to jump between dashboards, spreadsheets, and session replay apps to piece together a full picture. UXCam removes that friction with a native connection between product analytics and session replay, all from a single SDK. This means:
Spot a drop in your funnel? Jump straight into session replays of affected users.
See unusual behavior in a report? Click into sessions without losing context.
Want to analyze rage clicks or abandoned flows? Filter and view instantly.
Quick to set up, easy to use
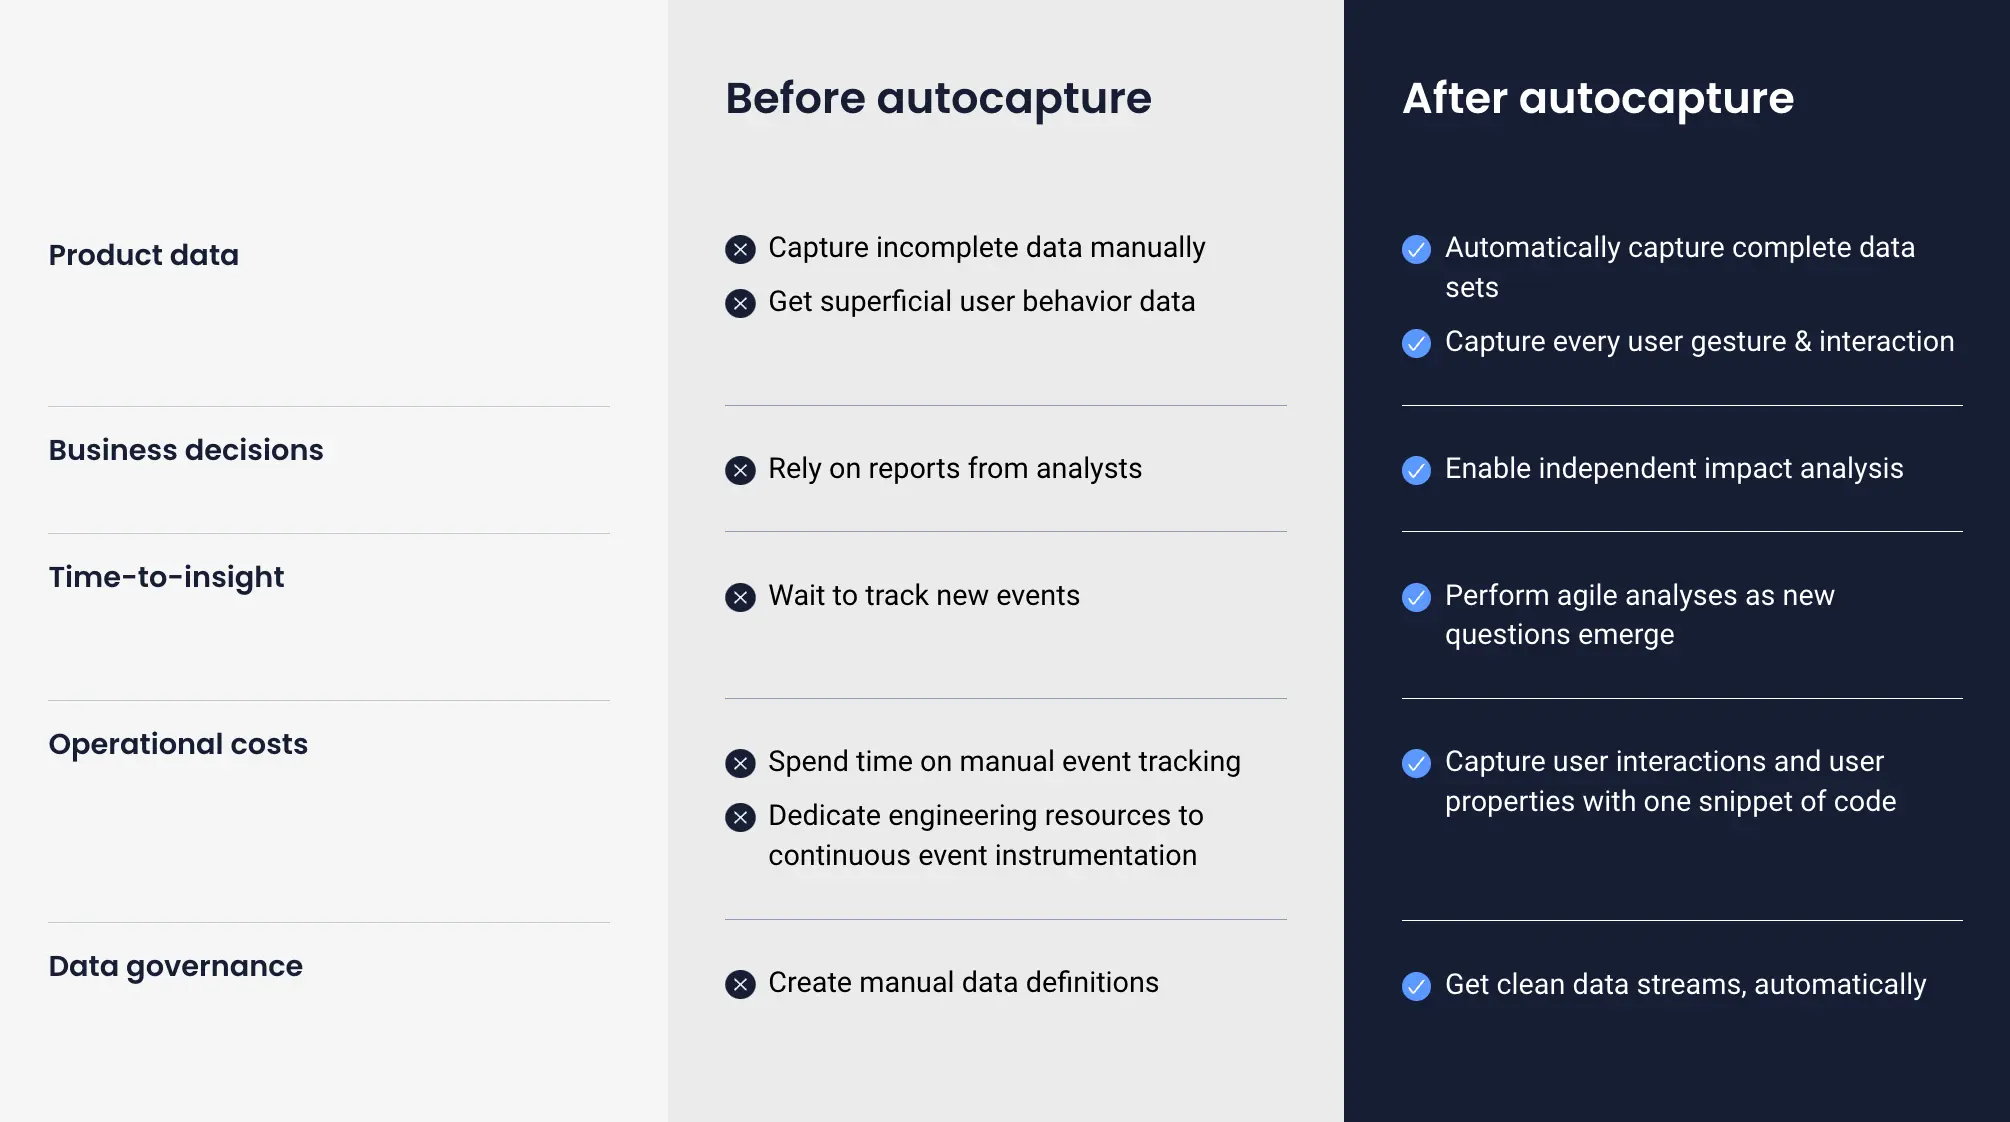
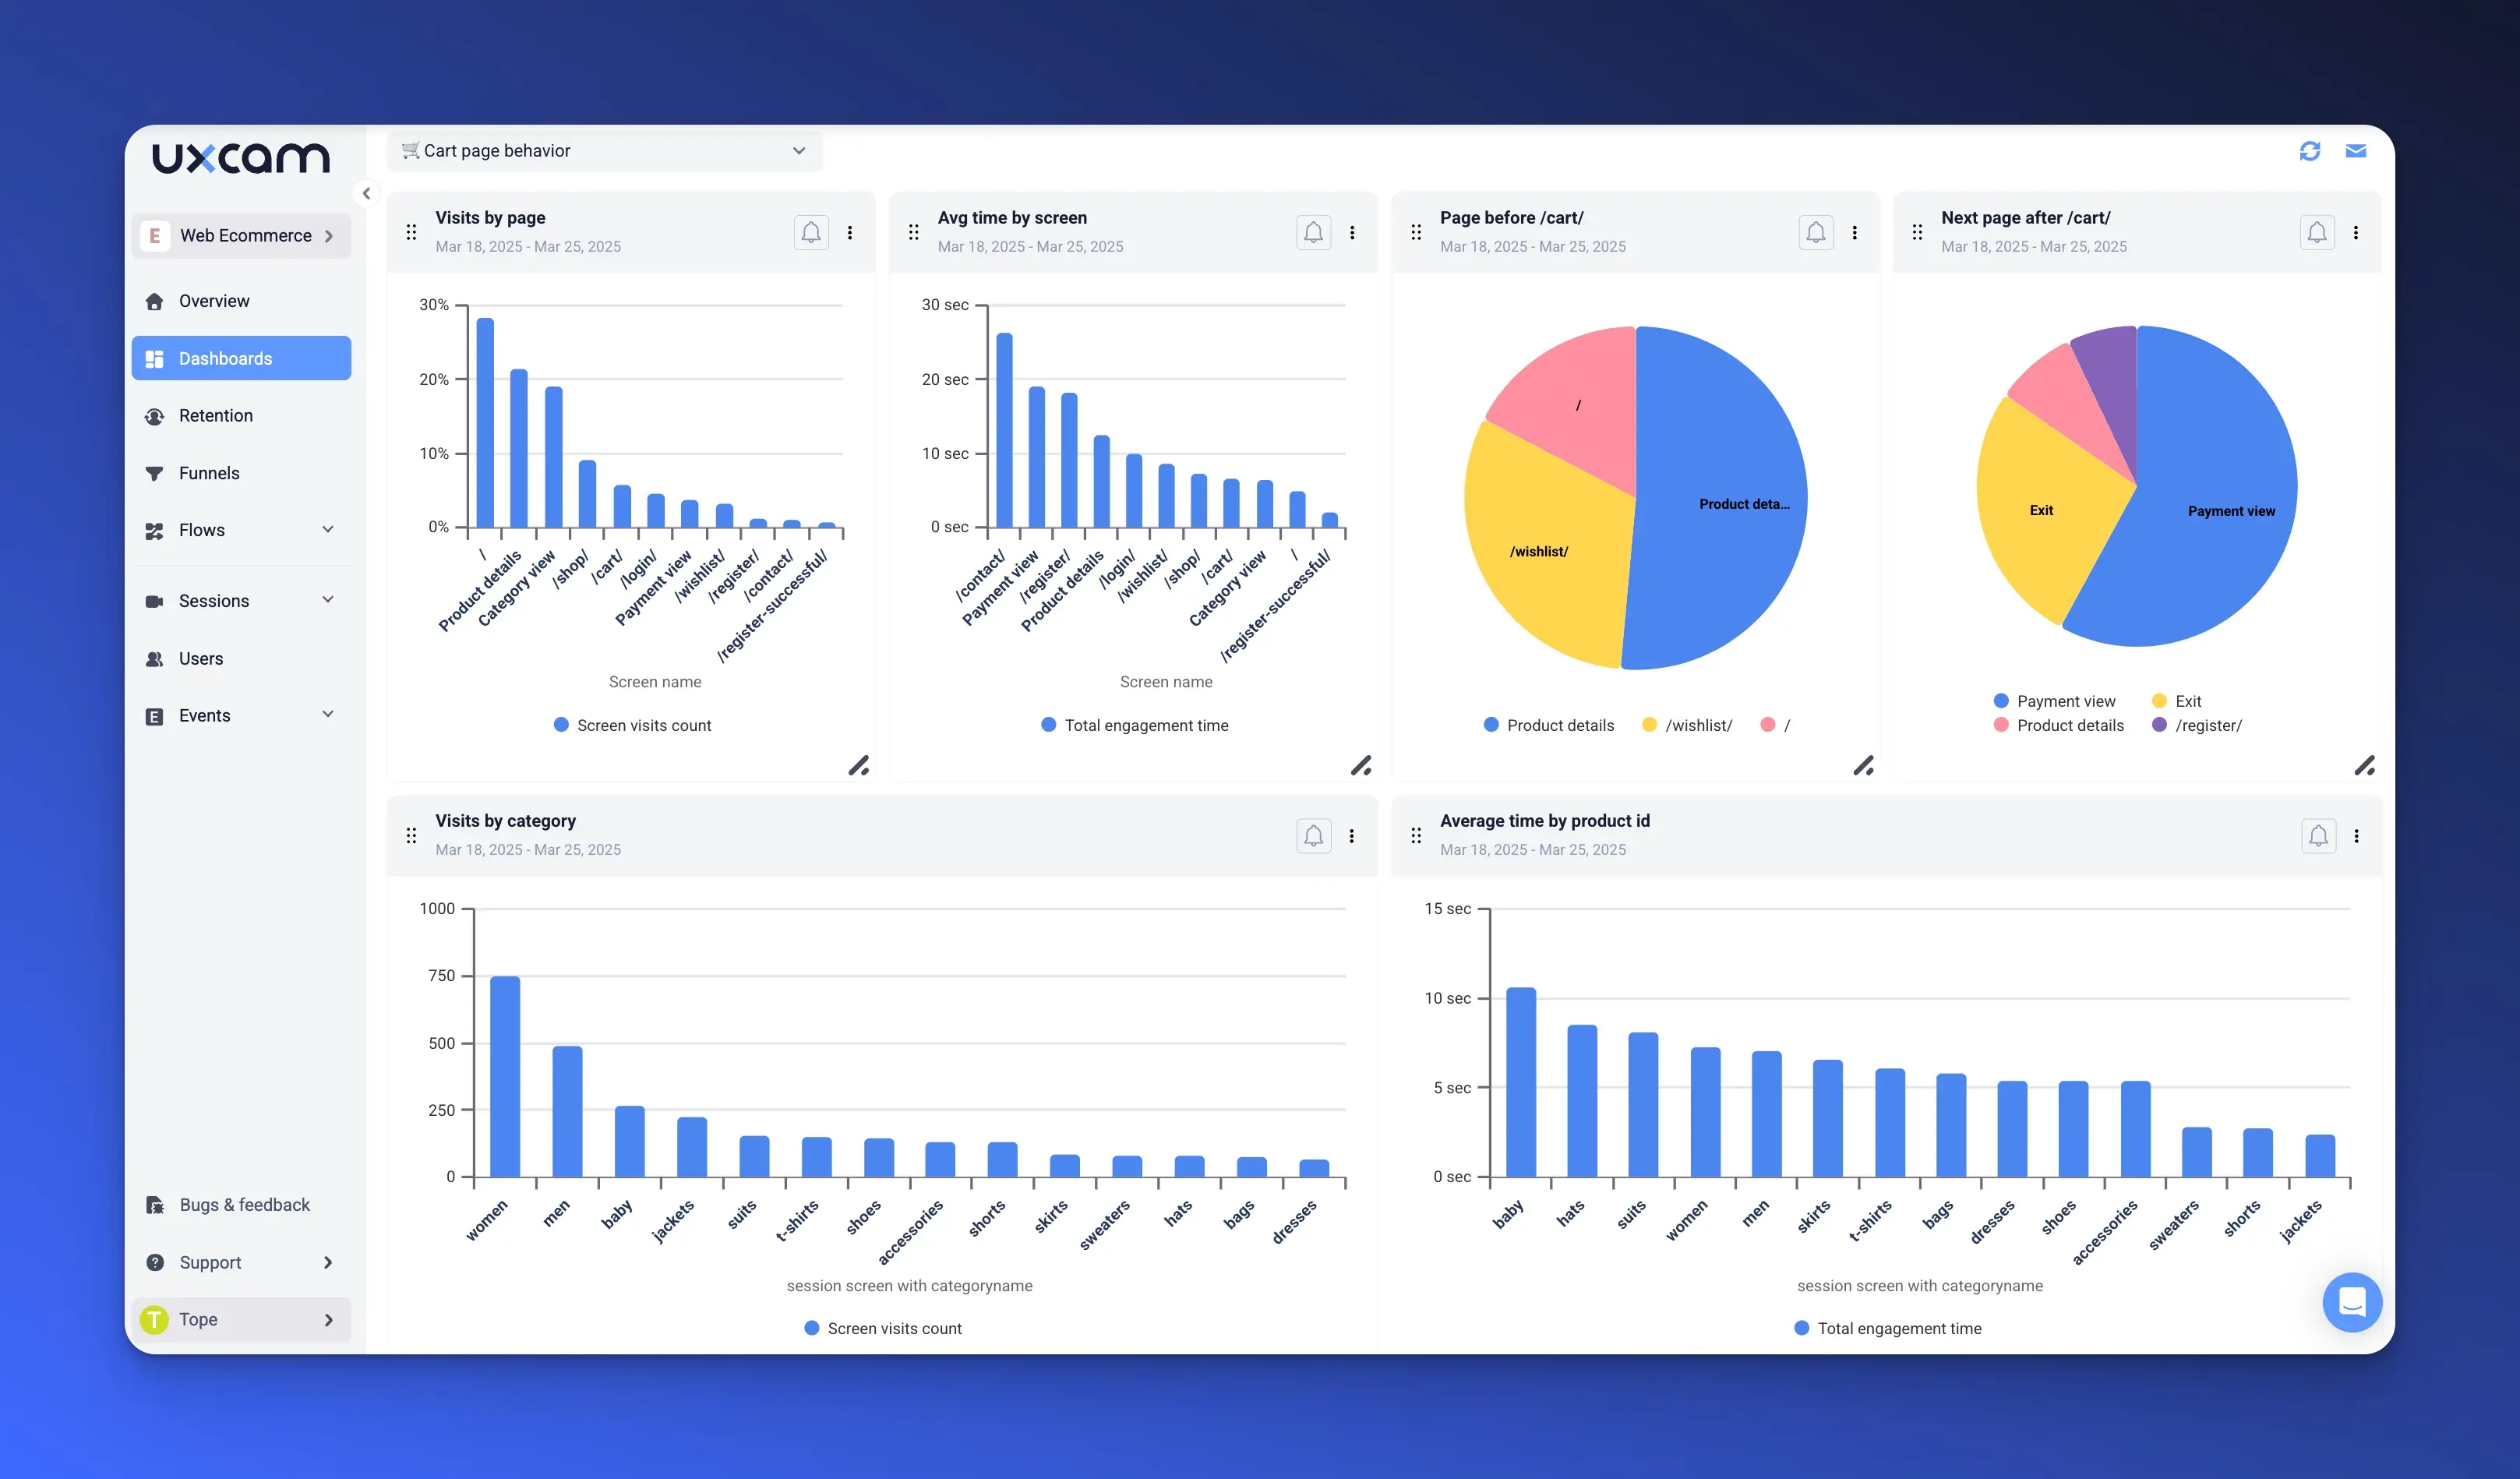
Because of our autocapture technology, you don’t need to set up every single thing you want to track—insights just start showing up right away. You’ll also get access to ready-made filters and report templates, so there’s no need to build complex dashboards from scratch. And if you're working with a team, it’s easy to share dashboards with others so everyone—product, design, and engineering—is on the same page.
Flexible, but not overwhelming
Even though UXCam is simple to use, it still gives you the flexibility to go deeper when you need to. It covers most of the common product analytics use cases right out of the box, but you can also set up custom events and filters to answer more specific questions.
Get insights in a few click
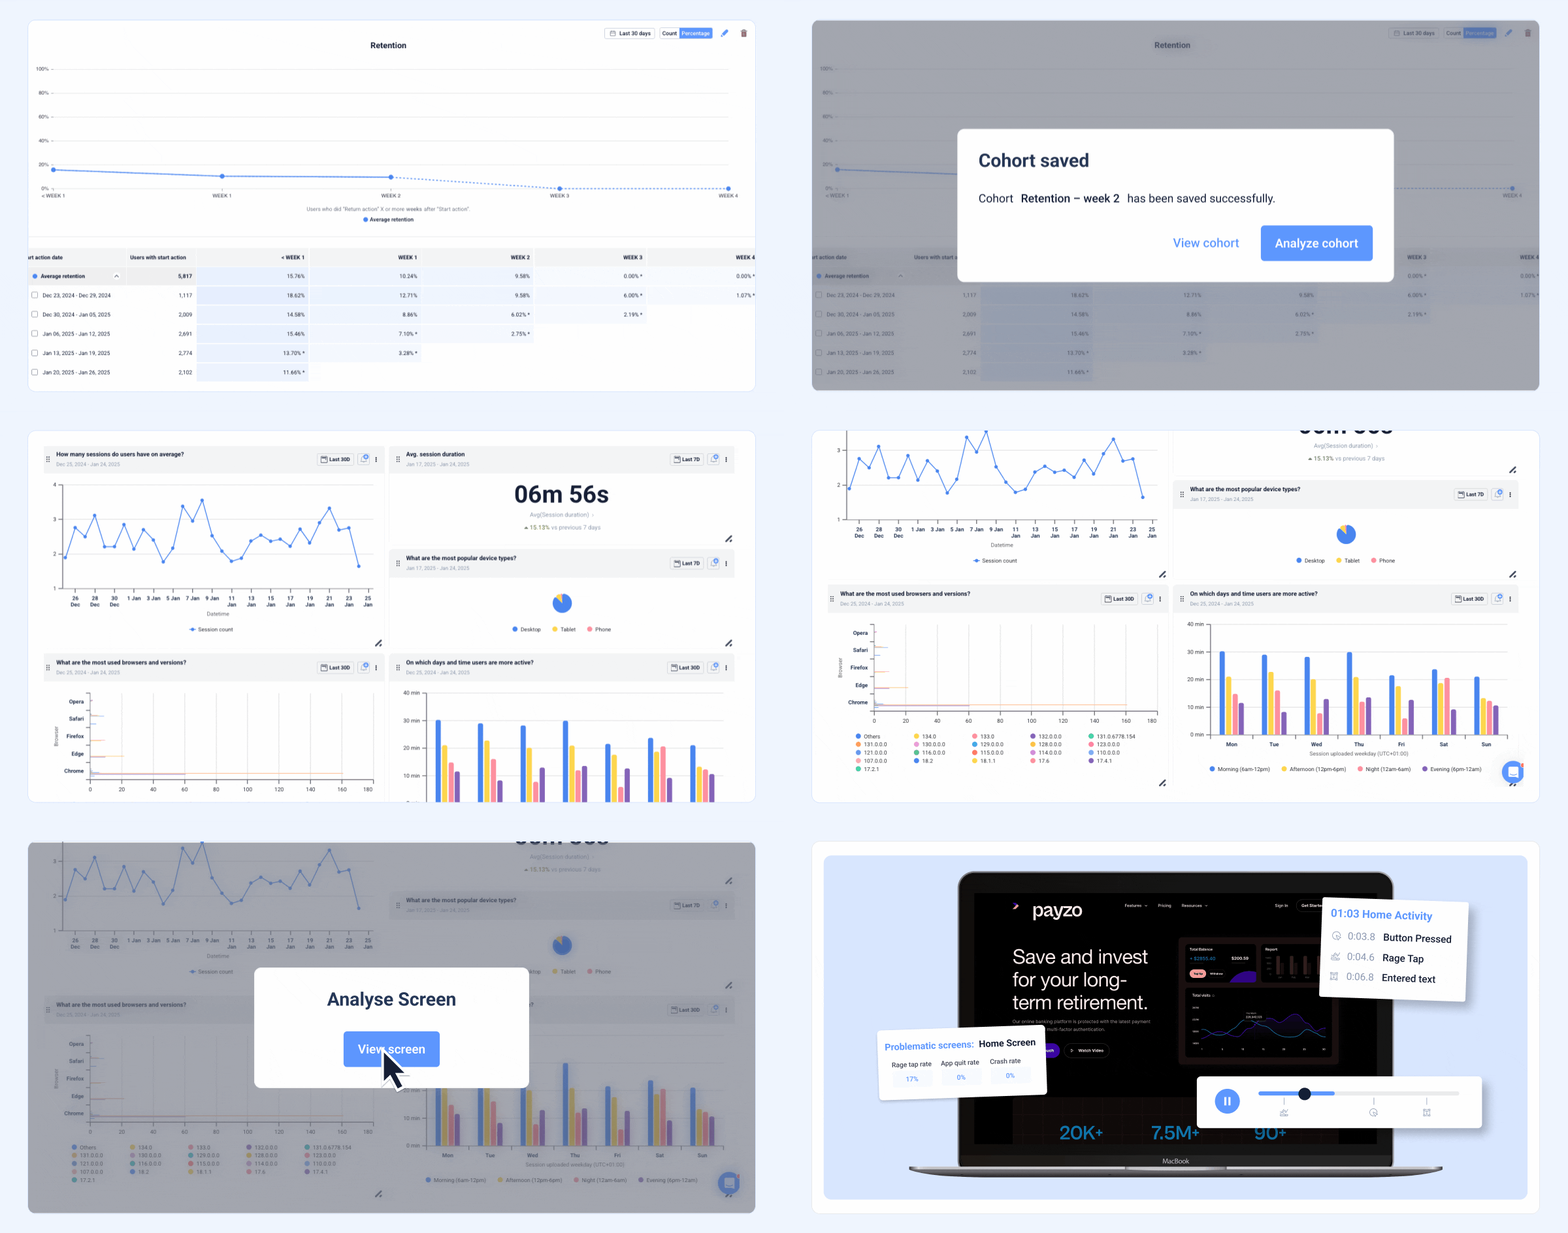
One of the most powerful advantages is how quickly UXCam gets you to insight. With just a few clicks, you can segment sessions based on user behavior, generate dashboards from a specific cohort, or jump directly into sessions tied to key events. You’ll even uncover patterns and friction points you might not have thought to track—surfacing insights that traditional, manual analytics setups often miss.
Ready to level up your web analytics reporting? Sign up for FREE to start using UXCam to capture rich behavioral insights, fix friction points, and increase your conversion rates.
3. Conversion Reports
How it helps - Track how visitors turn into customers or leads
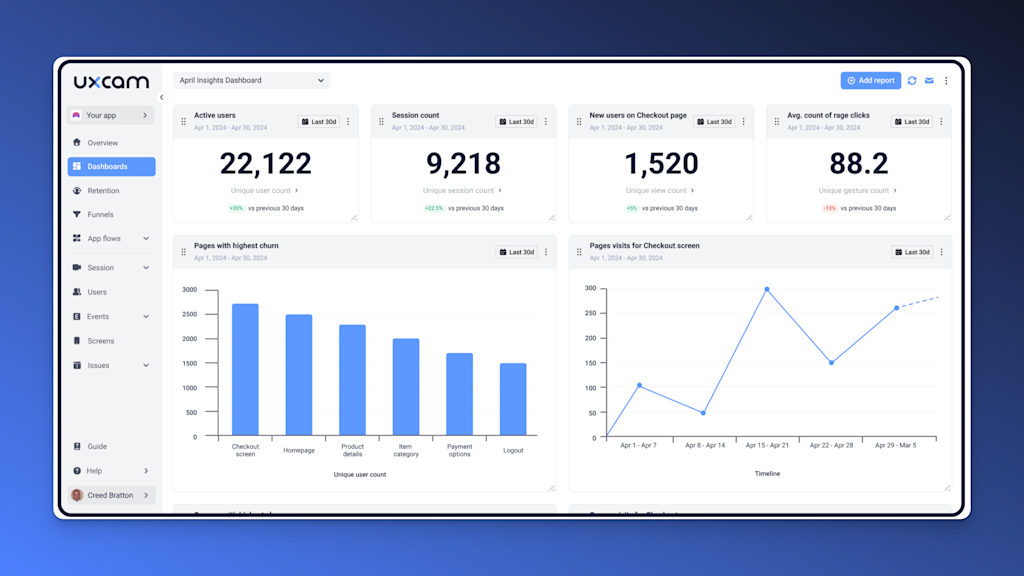

Conversion reports are all about measuring success against your business goals. Whether it’s completing a purchase, signing up for a newsletter, or filling out a contact form, these reports reveal what’s working and where users drop off.
Metrics to track:
Goal completions: Track the number of successful actions tied to your KPIs.
Cart abandonment: Understand where potential buyers leave the checkout process.
Funnel analysis: See how users progress through multi-step processes like sign-ups or purchases.
Recommended Tools:
UXCam: Analyze conversion flows and pinpoint drop-offs with session replays.
Mixpanel: Provides in-depth funnel reports and segmentation analysis.
Amplitude: Tracks conversion events across different user journeys.
Use conversion reports to continuously optimize critical paths and improve your bottom-line performance.
4. Acquisition Reports
How it helps - To evaluate campaign performance and channel effectiveness
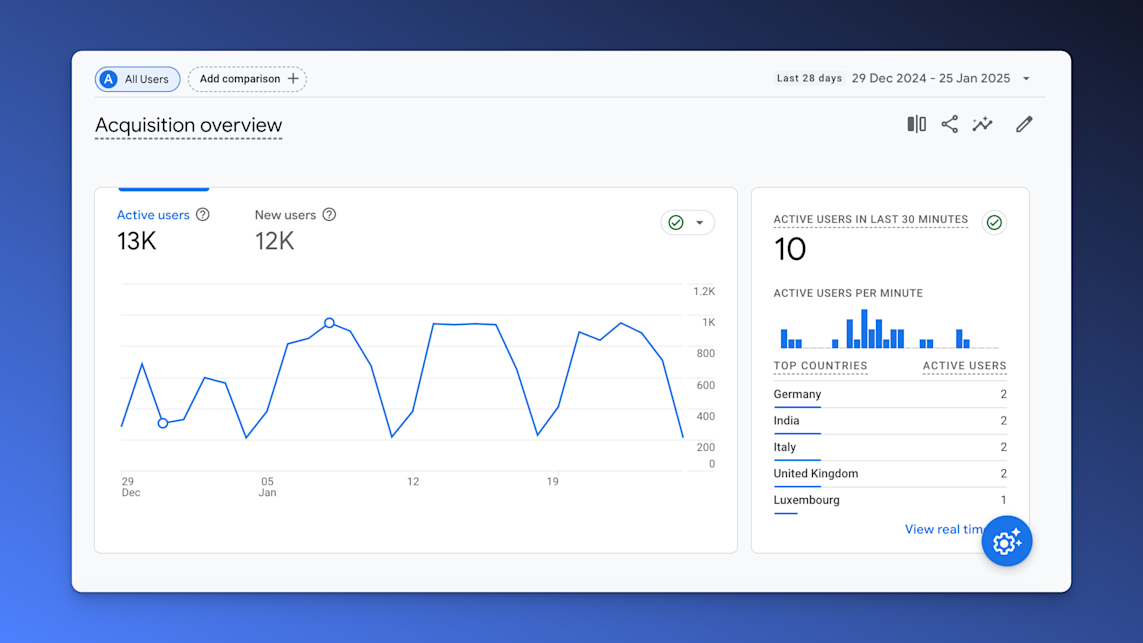

Acquisition reports focus on how users arrive at your site. These reports help you evaluate which marketing efforts drive traffic and ROI, so you can refine your strategies.
Important metrics include:
Source/Medium breakdown: Analyze whether traffic comes from organic search, email, social media, or paid ads.
Campaign ROI: Compare marketing spend against traffic quality and conversions.
Recommended Tools:
Google Analytics: Offers a detailed breakdown of acquisition sources and campaign performance.
HubSpot: Tracks the effectiveness of email, paid media, and organic campaigns across your funnel.
By focusing on acquisition, you can allocate resources to high-performing channels and refine underperforming campaigns.
5. Retention and Cohort Analysis Reports
How it helps - Optimize long-term engagement and loyalty
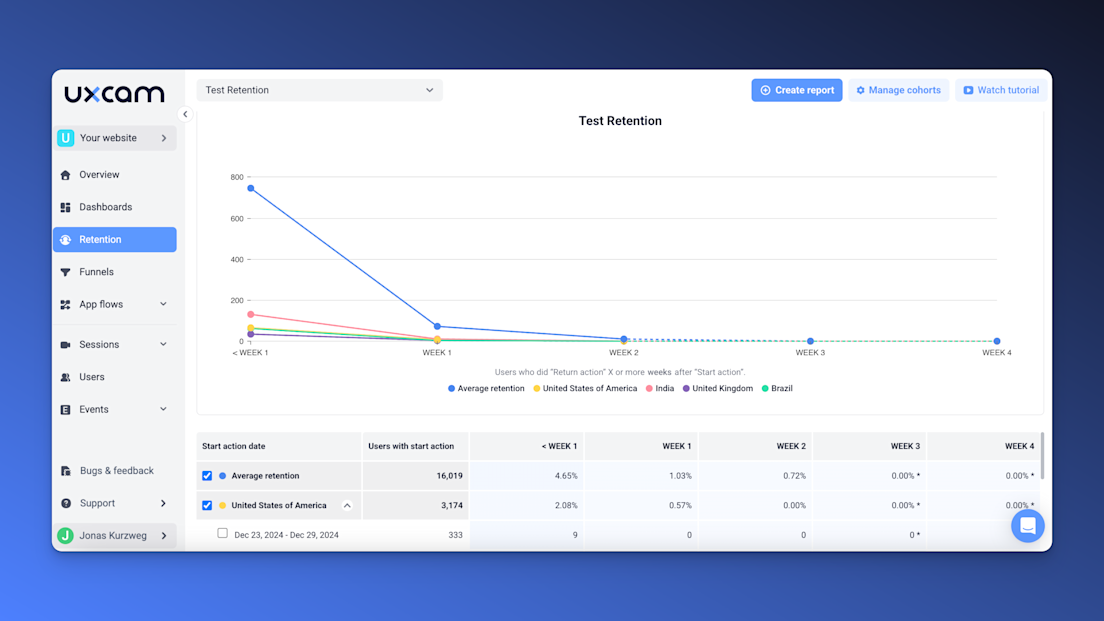

Retention reports measure how effectively you keep users coming back. Cohort analysis goes a step further, showing how specific groups (e.g., users who signed up during a campaign) behave over time.
Metrics to monitor:
User churn: The percentage of users who stop engaging with your website or product.
Retention rate: The percentage of users who return within a given period.
Cohort behaviors: Patterns in how specific groups of users engage, such as those who completed a trial or first purchase.
Recommended Tools:
UXCam: Tracks retention patterns and provides cohort-specific insights for apps and web.
Heap: Offers automatic tracking and retention reports based on user actions.
Amplitude: Provides detailed cohort analysis and retention forecasting.
Retention and cohort analysis reports are key to understanding the lifetime value of your users and identifying strategies to improve loyalty.
Web analytics reporting best practices
Creating an effective analytics report requires a thoughtful approach. You need to define clear goals, consider your audience, choose the right tools, and present data in a way that drives action. Here’s how to do it step-by-step.
1. Define your goals and objectives
The first step in building an impactful report is understanding why you’re creating it. Start by identifying the specific business questions you want to answer, such as:
“Why are users dropping off during the checkout process?”
“Which campaigns are driving the most qualified leads?”
Link these questions to relevant KPIs. For example:
Objective: Increase user engagement.
KPI: Pages per session, average session duration.
A clear connection between goals and metrics ensures your report stays focused and actionable.
2. Understand your audience
Tailor your report to the stakeholders who will use it. Different audiences have different needs:
Executives: Want high-level summaries and visual trends to guide strategic decisions.
Product Teams: Need detailed user behavior data to improve features and workflows.
Marketing Teams: Focus on campaign performance and conversion rates to refine targeting.
By adapting the depth and format of your report, you ensure your insights resonate with the intended audience.
3. Choose the right toolset
Selecting the right tools can make or break your reporting process. Consider tools that offer:
Integrations: Seamless connection with your existing platforms (e.g., Google Analytics with UXCam).
Ease of Use: Intuitive interfaces for creating and sharing reports.
Scalability: The ability to grow with your data needs.
4. Visualize data effectively
Data is most impactful when presented clearly. Use visualizations like charts, graphs, and dashboards to make complex metrics easier to understand.
Best practices include:
Focus on Key Insights: Avoid overwhelming stakeholders with excessive data points.
Choose the Right Visuals: Line charts for trends, bar graphs for comparisons, and pie charts for proportions.
Add Context: Include brief explanations to clarify what the data shows and why it matters.
For example, a bar chart comparing conversion rates by channel is more digestible than a dense spreadsheet of raw numbers.
5. Establish a Reporting Schedule
Consistency is key to effective analytics reporting. Set up a regular schedule for generating and sharing reports:
Regular Reports: Weekly or monthly summaries to track ongoing performance.
Ad-Hoc Reports: Specific reports to answer immediate business questions or evaluate a new initiative.
Automating reports using tools like Google Analytics, Tableau, or UXCam saves time and ensures accuracy. Automated email alerts or dashboards also keep stakeholders informed in real-time.
How to interpret web analytics reports
Interpreting web analytics reports is where data turns into decisions. It’s not just about reading numbers—it’s about understanding the story they tell. Here’s how to make sense of your reports and extract actionable insights.
1. Analyzing trends over time
Start by identifying patterns, seasonality, and anomalies. Are certain metrics consistently rising or falling? Do spikes or drops align with marketing campaigns, holidays, or product launches?
For example:
Pattern: A steady increase in traffic after launching a new ad campaign.
Seasonality: Higher engagement during holiday periods for e-commerce sites.
Anomaly: A sudden spike in bounce rates after a site update, signaling a potential issue.
Spotting these trends helps you anticipate future behaviors and adjust strategies accordingly.
2. Segmentation for deeper insights
Breaking data into smaller groups allows you to uncover hidden insights. Segment your data by:
User Type: New vs. returning visitors.
Device: Desktop vs. mobile performance.
Location: Regional or country-specific behavior differences.
For example, you might find that mobile users in a particular region have higher bounce rates, indicating a need for localized optimization.
Segmentation ensures you’re not making broad assumptions and can tailor strategies for specific audience subsets.
3. Always pair data with insights
Metrics rarely exist in isolation. Look for relationships between them to understand broader trends. For example:
If traffic increases but conversions drop, it might signal irrelevant traffic or poor landing page design.
If engagement metrics (time on site, pages per session) improve, you might see a corresponding rise in conversions.
By correlating metrics, you can pinpoint cause-and-effect relationships and identify what’s truly driving results—or hindering them.
4. Ask critical questions
Always dig deeper into the numbers by asking critical questions:
“What is driving this change?”: A sudden spike in traffic could be from a viral campaign or spam traffic.
“Are these results actionable or noise?”: A small drop in time on site might not matter if conversions are steady.
Critical questioning ensures you’re focusing on meaningful data and not getting distracted by insignificant changes.
5. Communicate insights clearly
Data without context or clarity can confuse stakeholders. Turn technical jargon into actionable recommendations by simplifying your findings and explaining their significance.
For example; instead of saying, “Bounce rate increased by 15%,” say, “We’ve seen a 15% increase in bounce rate, likely due to slower load times on the homepage. Optimizing site speed could improve engagement.”
Use visuals like graphs, charts, or tables to make your insights even clearer. Here’s a simple example:
| Metric | Observation | Actionable Insight |
|---|---|---|
| Traffic Sources | Organic traffic dropped by 10%. | Improve SEO efforts for key landing pages. |
| Conversion Rate | Increased by 5% on mobile. | Prioritize mobile-friendly optimizations. |
| Bounce Rate | Spiked on product pages. | Revise page design to improve engagement. |
Clear communication ensures your data-driven insights lead to informed actions.
Advanced web analytics reporting techniques
As your analytics needs grow, advanced reporting techniques can help you uncover deeper insights and make more accurate predictions. These methods go beyond standard reporting to provide a more comprehensive view of user behavior and performance.
Custom dashboards and reports
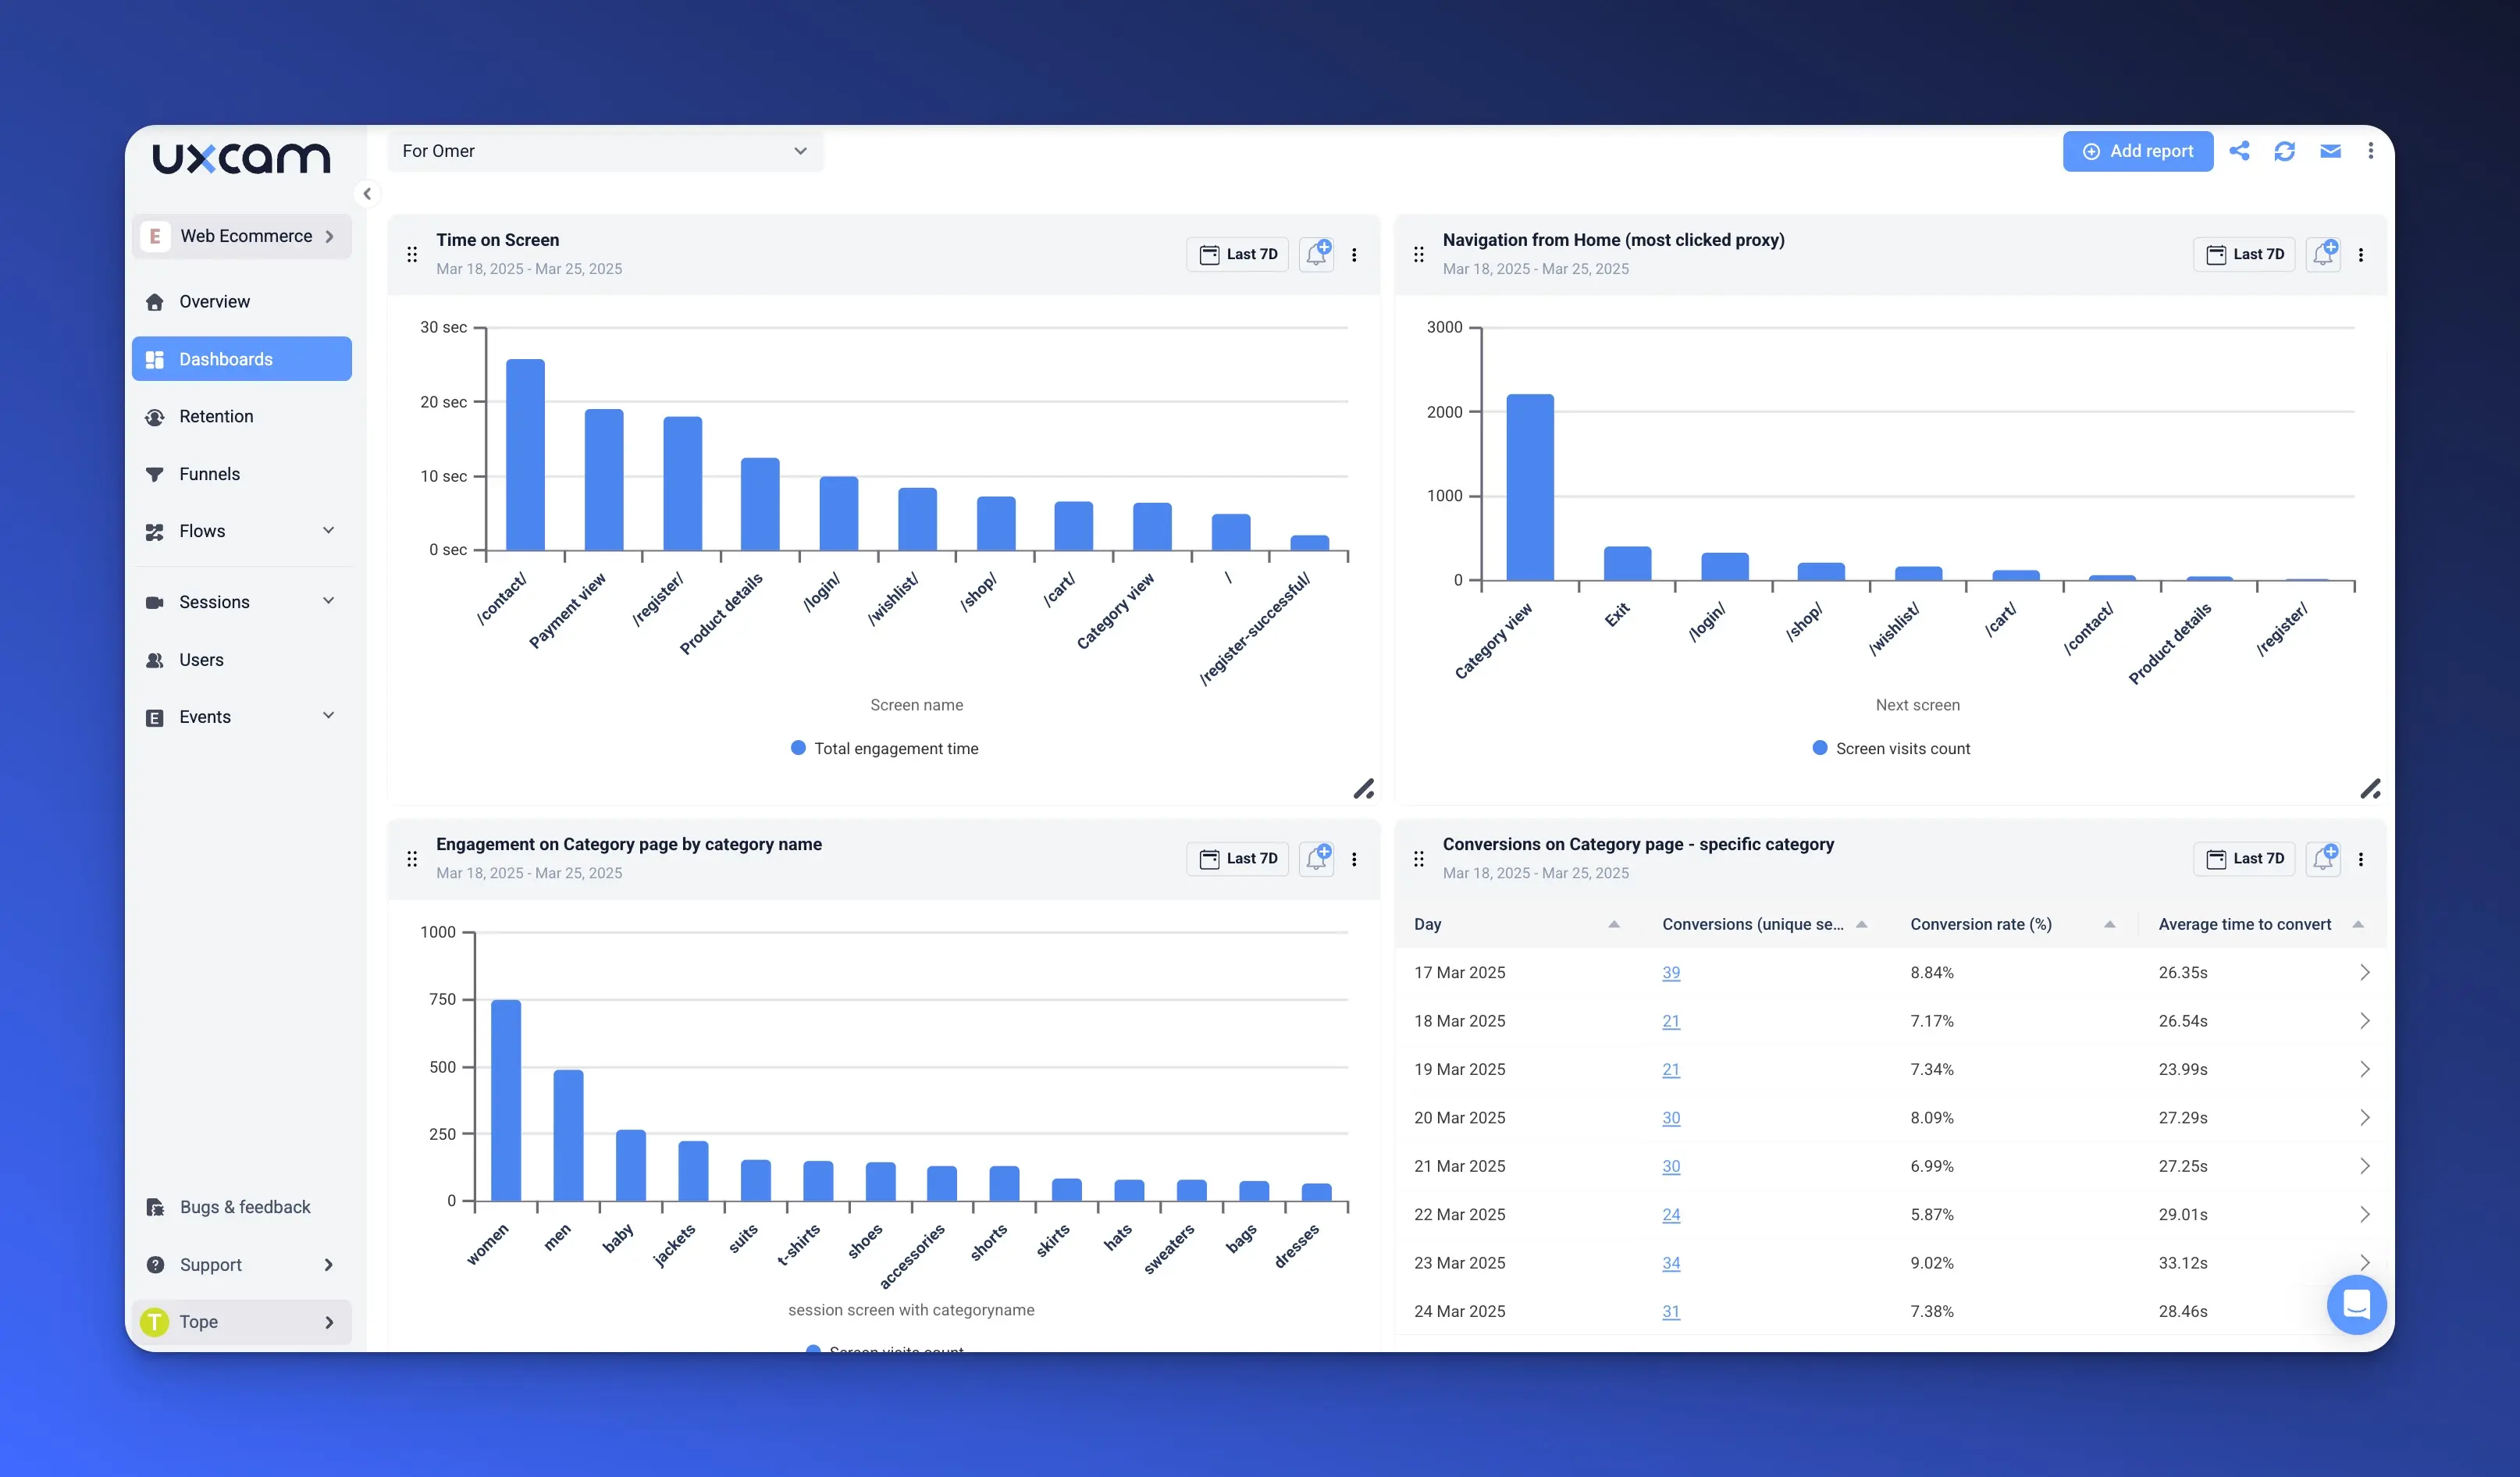
Custom dashboards allow you to tailor analytics reports to the unique needs of your team. Instead of sifting through irrelevant data, you can focus on the metrics that matter most.
Tools to Use:
UXCam Custom Views: Personalize reports with session replays and behavioral insights.
Looker Studio: Build interactive dashboards with drag-and-drop customization.
Tableau: Create visually compelling dashboards for complex datasets.
Why It Matters: Tailored dashboards streamline decision-making for specific teams. For instance:
Executives: High-level KPIs like revenue and traffic trends.
Product Teams: User flows, session replays, and drop-off analysis.
Custom dashboards ensure everyone gets the insights they need without data overload.
Predictive analytics and machine learning
Predictive analytics leverages historical data to forecast future trends. By using machine learning, you can identify patterns and predict outcomes like user churn, conversion likelihood, or revenue growth.
Tools to Use:
BigQuery: Process large datasets and perform predictive modeling.
Google Analytics 360: Access advanced attribution and predictive insights.
Amplitude's Behavioral Cohorts: Segment users based on predicted behaviors.
Applications:
Forecasting sales during holiday campaigns.
Predicting which users are most likely to convert or churn.
Optimizing marketing efforts based on likely outcomes.
By using predictive tools, you can make proactive decisions rather than reactive fixes.
Attribution modeling and multi-touch attribution
Attribution modeling tracks how different touchpoints contribute to a user’s journey. Multi-touch attribution provides a more accurate picture of how multiple interactions (e.g., ads, emails, organic searches) lead to conversions.
Tools to Use:
Google Analytics: Includes standard attribution models like first-click and last-click.
Adjust: Focused on mobile app attribution.
AppsFlyer: Provides multi-touch attribution for both web and mobile platforms.
Why It Matters: Understanding attribution helps you:
Allocate budgets to the most effective marketing channels.
Identify the true ROI of campaigns.
Optimize touchpoints to reduce drop-offs.
Attribution modeling ensures you’re not undervaluing key steps in the user journey.
Combining web and app analytics
In today’s cross-platform world, understanding user behavior across web and mobile is crucial. By integrating app analytics with web data, you get a holistic view of the user journey.
Example: Combine UXCam’s in-app behavior insights with Google Analytics for a complete picture of how users interact with your app and website.
Benefits:
Track users who start on mobile and complete actions on the web.
Identify where users drop off across platforms.
Optimize the experience for seamless transitions between web and app.
Cross-platform insights help you deliver a consistent and engaging user experience.
Real-time analytics reporting
Real-time analytics gives you up-to-the-minute insights into user behavior, making it invaluable for time-sensitive scenarios.
Scenarios for Real-Time Reporting:
Monitoring the performance of live campaigns or events.
Quickly identifying and addressing technical issues, such as site crashes.
Tracking real-time traffic spikes during promotions or product launches.
Tools to Use:
Google Analytics Real-Time: Tracks live user interactions.
UXCam Live Session Replay: View how users interact with your site or app in real time.
Why it matters: Real-time reporting allows you to react instantly to opportunities and challenges, minimizing downtime and maximizing impact.
Conclusion - Turning reports into action
Web analytics reports are only as valuable as the actions they inspire. Transforming raw data into strategic decisions unlocks the full potential of your insights, driving meaningful results for your business. By focusing on metrics aligned with your goals, creating clear action plans, and testing strategies, you can ensure your efforts are both effective and adaptable.
Analytics reporting is not a one-time task but a continuous process of improvement. Regular feedback loops, evolving KPIs, and learning from past results are essential to keeping your strategies aligned with business objectives. This ongoing refinement ensures long-term success and makes your reports increasingly actionable.
UXCam simplifies this process with features like session replays for deeper user insights, custom dashboards tailored to team needs, and cross-platform tracking for a holistic view of user behavior. Whether you're optimizing engagement or solving drop-off issues, UXCam helps turn insights into confident, data-driven decisions. Ready to elevate your reporting? Explore UXCam for Web analytics today.
FAQ
What is a web analytics report?
A web analytics report is a structured summary of your website’s performance data. It collects and organizes metrics like traffic, user behavior, and conversions into a format that’s easy to understand and act on.
These reports are essential for understanding how visitors interact with your website. They reveal patterns, highlight problem areas, and show what’s working well. With this information, you can make informed decisions to improve user experiences and achieve your goals.
Raw data is just numbers without context. A good web analytics report transforms that data into actionable insights, helping you connect the dots and identify clear next steps.
For example:
Raw Data: 20% of users drop off on your sign-up page.
Actionable Insight: Improve the sign-up form by reducing fields or clarifying instructions to retain more users.
By bridging the gap between data and decisions, web analytics reports empower you to turn insights into meaningful improvements.
Why is web analytics reporting important?
Web analytics reporting is your secret weapon for making smarter, data-driven decisions. It takes the guesswork out of managing your website by showing you what’s actually happening and how your efforts impact performance.
These reports help you identify strengths, weaknesses, and untapped opportunities. For example, they answer questions like:
| Question | Purpose | Example Insight |
|---|---|---|
| Is your homepage driving traffic but not conversions? | Identify landing page performance and optimization needs. | Users visit the homepage but leave without clicking CTA. |
| Are users dropping off during checkout? | Highlight friction points in the purchase process. | 20% drop-off rate on the payment page suggests confusion or mistrust. |
| Which pages are keeping users engaged the longest? | Determine which content resonates most with visitors. | Blog articles have a higher average session duration. |
For marketers, web analytics reporting is gold. It reveals which campaigns bring high-quality traffic and which channels deliver the best ROI. With these insights, you can optimize ad spend to focus on what works, refine messaging to resonate with your audience and track campaign success against key performance indicators (KPIs).
For UX teams, these reports highlight friction points in user journeys. Whether it’s a confusing navigation menu or a slow-loading page, the data shows where improvements are needed to enhance user experiences.
Most importantly, web analytics reporting connects your website’s performance to your business goals. By aligning data with actions, you can:
Improve user engagement.
Boost conversion rates.
Drive measurable business growth.
When you know what’s working and what isn’t, you can make informed changes that truly move the needle. That’s the power of effective web analytics reporting.
Key metrics and KPIs in web analytics
Web analytics metrics and KPIs are the building blocks of actionable insights. These numbers reveal how users interact with your site, helping you track performance and identify areas for improvement.
Here's a good overview of key categories and their significance.
| Category | Metrics | Purpose |
|---|---|---|
| Traffic Sources | Direct, Organic, Referral, Paid | Understand where your visitors are coming from and which channels perform best. |
| User Engagement | Bounce Rate, Time on Site, Pages per Session | Assess how users interact with your site and identify areas needing improvement. |
| Conversion Metrics | Conversion Rate, Goal Completions, Sales | Measure how effectively your website turns visitors into leads or customers. |
Traffic sources
Your traffic sources reveal how users find your website. Are they coming from organic search, paid ads, or social media? Understanding this helps you focus your marketing budget on high-performing channels.
User engagement
Metrics like bounce rate, time on site, and pages per session show how well your site keeps users engaged. High bounce rates might indicate a disconnect between visitor expectations and your content.
Conversion metrics
Conversions track the ultimate goals of your site, like sales, sign-ups, or downloads. Monitoring these metrics tells you how effective your website is at driving results that matter to your business.
Select KPIs based on business goals
To choose the right KPIs, align them with your objectives. For example:
E-commerce goals: Focus on sales, cart abandonment rates, and average order value.
Content marketing goals: Prioritize time on site, pages per session, and social shares.
Lead generation goals: Track form completions, click-through rates, and email sign-ups.
By tailoring your KPIs to your goals, you ensure your reporting delivers insights that drive success.
You might also be interested in these;
What is Web Analytics? Definition, Metrics & Best Practices
Web Analytics Dashboard Examples and How to Use Them
Website Visitor Tracking - A Comprehensive Guide
Top 10 Digital Analytics Tools You Need to Know
Ultimate Website Optimization Guide: Must-Know Tactics
Website Analysis 101: How to Analyze for Peak Performance
AUTHOR

Tope Longe
Product Analytics Expert
Ardent technophile exploring the world of mobile app product management at UXCam.
What’s UXCam?
Related articles
Website Analysis
Best Free Web Analytics Tools [2026]
Compare the best free web analytics tools for UX, product, and privacy. See why UXCam is the top choice for behavioral insights, compliance, and...

Jonas Kurzweg
Product Analytics Expert
Website Analysis
What is Web Analytics? Definition, Metrics & Best Practices
Discover what web analytics is, its definition, key examples, and the best tools to optimize your website's performance and user...

Tope Longe
Product Analytics Expert
Website Analysis
Website Heatmap - Ultimate Guide and Best Tools [2026]
Read the ultimate 2026 guide to website heatmaps: discover types, implementation, and the best heatmap tools to optimize user experience and site's...

Jonas Kurzweg
Product Analytics Expert
