Web Analytics Strategy - How to Improve Your Product with Data


Your product analytics dashboard is full of numbers, but are they driving better decisions? Many teams track clicks, page views, and bounce rates, yet still struggle to understand why users drop off, what’s causing friction, or how to improve retention.
The real problem? No clear web analytics strategy. Data is scattered across different tools, making it hard to connect insights and take action. Teams waste time analyzing numbers instead of improving the product.
This guide will show you how to build a practical web analytics strategy—one that helps you track the right data, understand user behavior, and make decisions that actually move the needle.
Summary - How to use web analytics effectively
| Best practice | Why it matters | How to apply it |
|---|---|---|
| Align with business goals | Ensures data supports product growth and UX | Define KPIs before tracking and focus on user behavior insights |
| Combine qualitative & quantitative Data | Helps understand both what happens and why | Use session replays, heatmaps, and metrics together for deeper analysis |
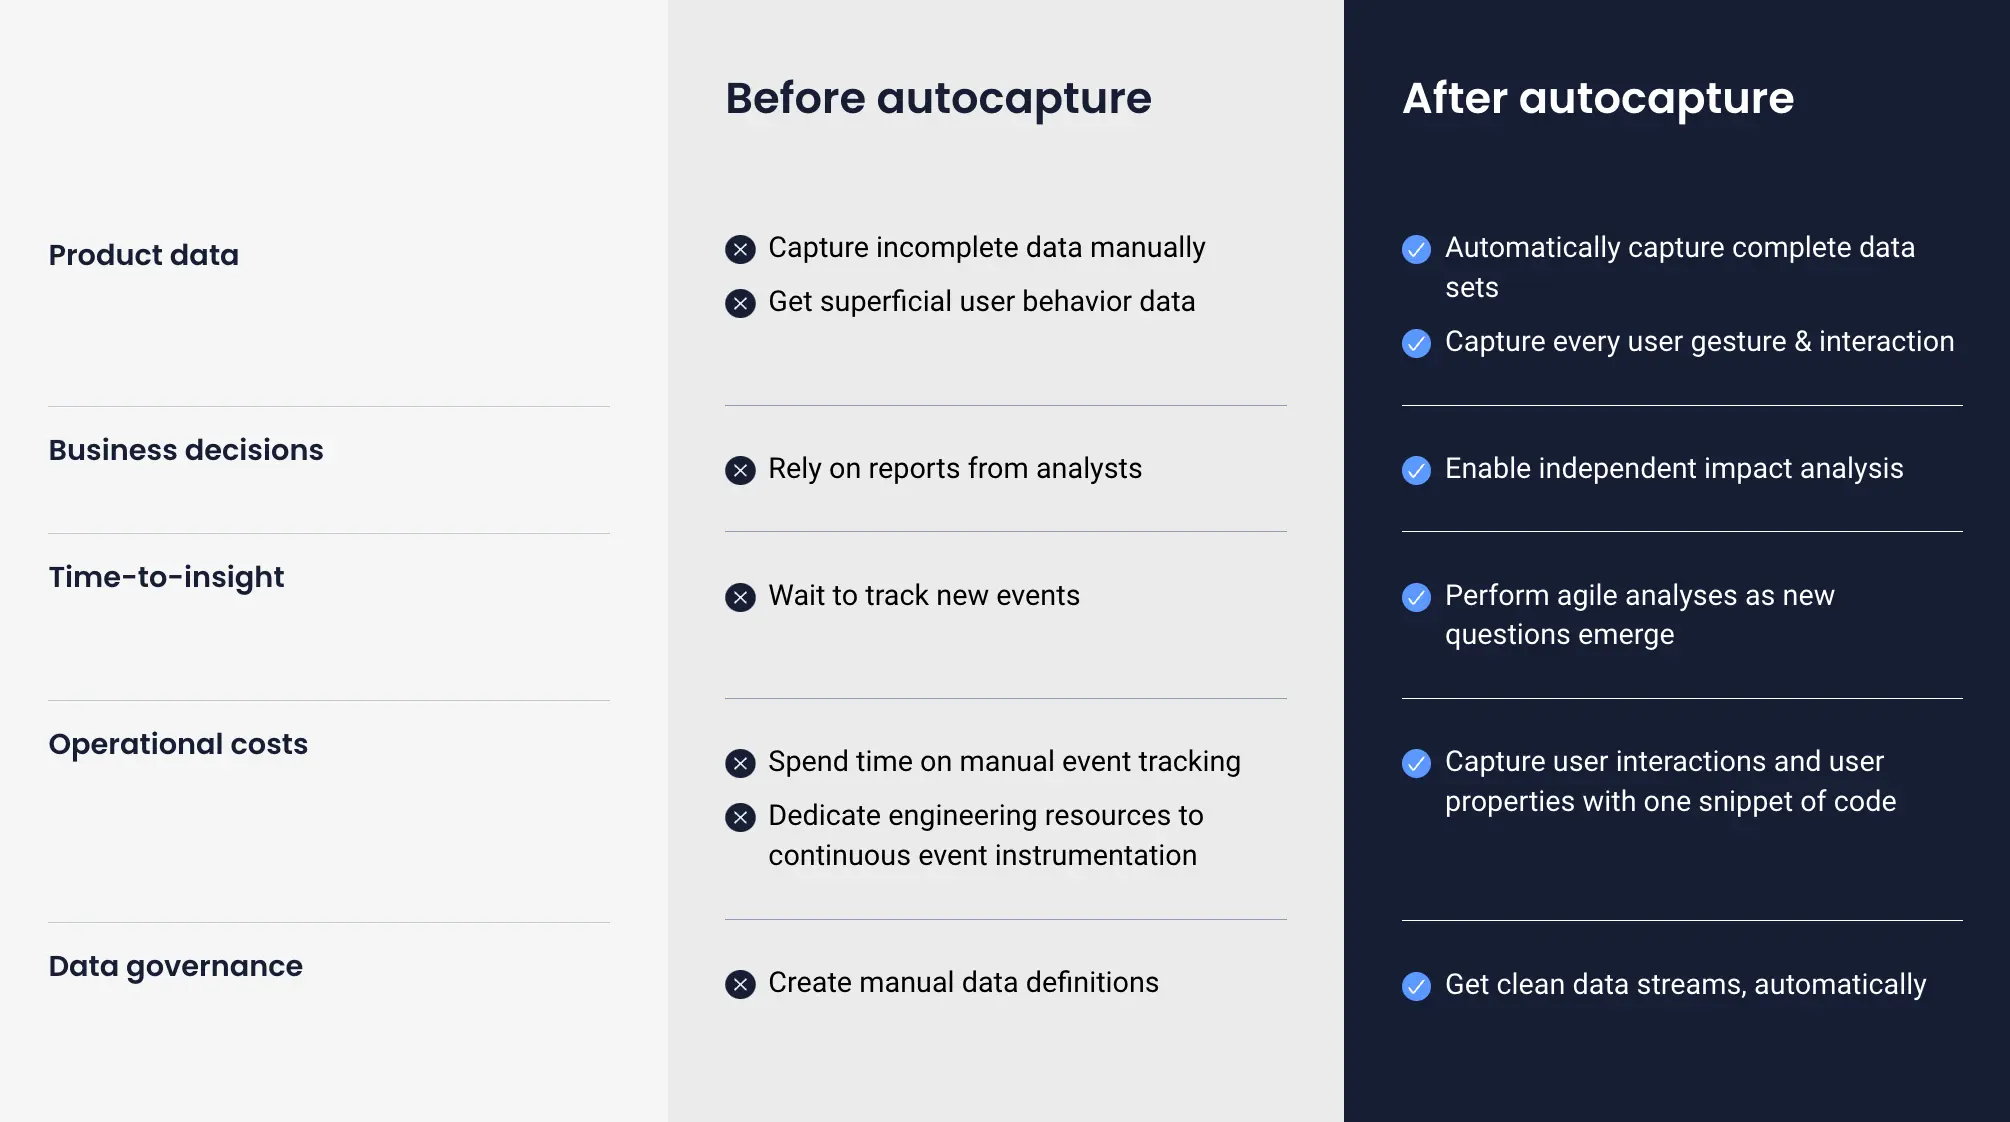
| Automate data collection | Saves time and reduces tracking errors | Use tools like UXCam’s autocapture for effortless tracking |
| Avoid vanity metrics | Prevents misleading conclusions | Focus on engagement, retention, and conversion rates instead of raw traffic |
| Track across devices | Provides a full view of user journeys | Ensure analytics tools track sessions across web and mobile |
| Act on insights quickly | Data is only valuable when it drives decisions | Prioritize high-impact fixes based on analytics findings |
What is a web analytics strategy?
A web analytics strategy is a structured plan for collecting, analyzing, and using website data to improve user experience, increase conversions, and drive business growth. It helps you understand user behavior, identify friction points, and make informed decisions that drive engagement and retention.
Many teams focus on data collection but struggle with data-driven decision-making. Tracking page views, session counts, and clicks isn’t enough. Without a clear strategy, you end up with fragmented insights that don’t translate into real product improvements.
A well-planned analytics strategy connects quantitative data (metrics, funnels, user flows) with qualitative insights (session replays, rage clicks, form interactions). This combination helps you see not just what users do, but why they behave a certain way—giving you actionable insights to refine your product experience.
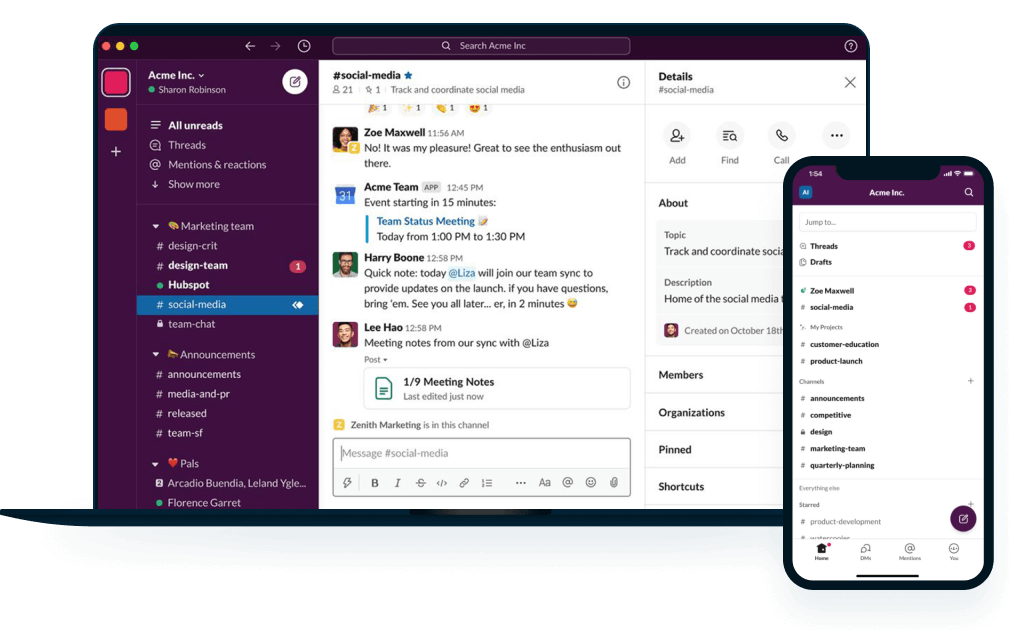
The Slack example: How a strong web analytics strategy drives growth
Slack’s explosive growth was powered by a data-driven web analytics strategy that optimized every stage of the user journey—acquisition, activation, engagement, and retention. Using tools similar to UXCam's analytics suite, Slack tracked activation rates, DAU/MAU ratios, cohort retention, and product-qualified leads (PQLs) to refine onboarding and drive conversions.
By identifying 2,000 messages sent as a key activation metric, Slack tailored its product and onboarding to accelerate user adoption. A/B testing, behavioral analytics, and personalized engagement campaigns reduced churn and boosted retention—93% of activated teams remained long-term.
This analytics-led approach enabled Slack to scale from 15,000 to 500,000+ daily active users in one year, fueling viral adoption with minimal marketing spend. By continuously optimizing based on data insights, Slack built a sticky product, achieved hyper-growth, and secured a $27.7B acquisition by Salesforce, proving how analytics can drive SaaS success


How to build a robust web analytics strategy
A web analytics strategy is only effective if it leads to real insights and better decisions. Tracking data alone won’t improve your product, it's how you use that data makes the difference. Here are the key components every strategy needs.
Whether you’re optimizing conversions, improving feature adoption, or reducing churn, a structured approach ensures you get meaningful, accurate, and useful insights. Let's get right into how to build a web analytics strategy that delivers results.
Step 1 - Choose the right web analytics tool
The foundation of a strong web analytics strategy starts with selecting the right tool. Without the right platform, data can become incomplete, difficult to analyze, or disconnected from your product goals. Your preferred product analytics solution should simplify tracking, provide meaningful insights, and integrate seamlessly into your workflow.
When evaluating a web analytics solution, consider key factors like ease of setup, data accuracy, depth of insights, and affordability. A tool that requires extensive manual setup or complex configurations can slow you down and create gaps in data collection.
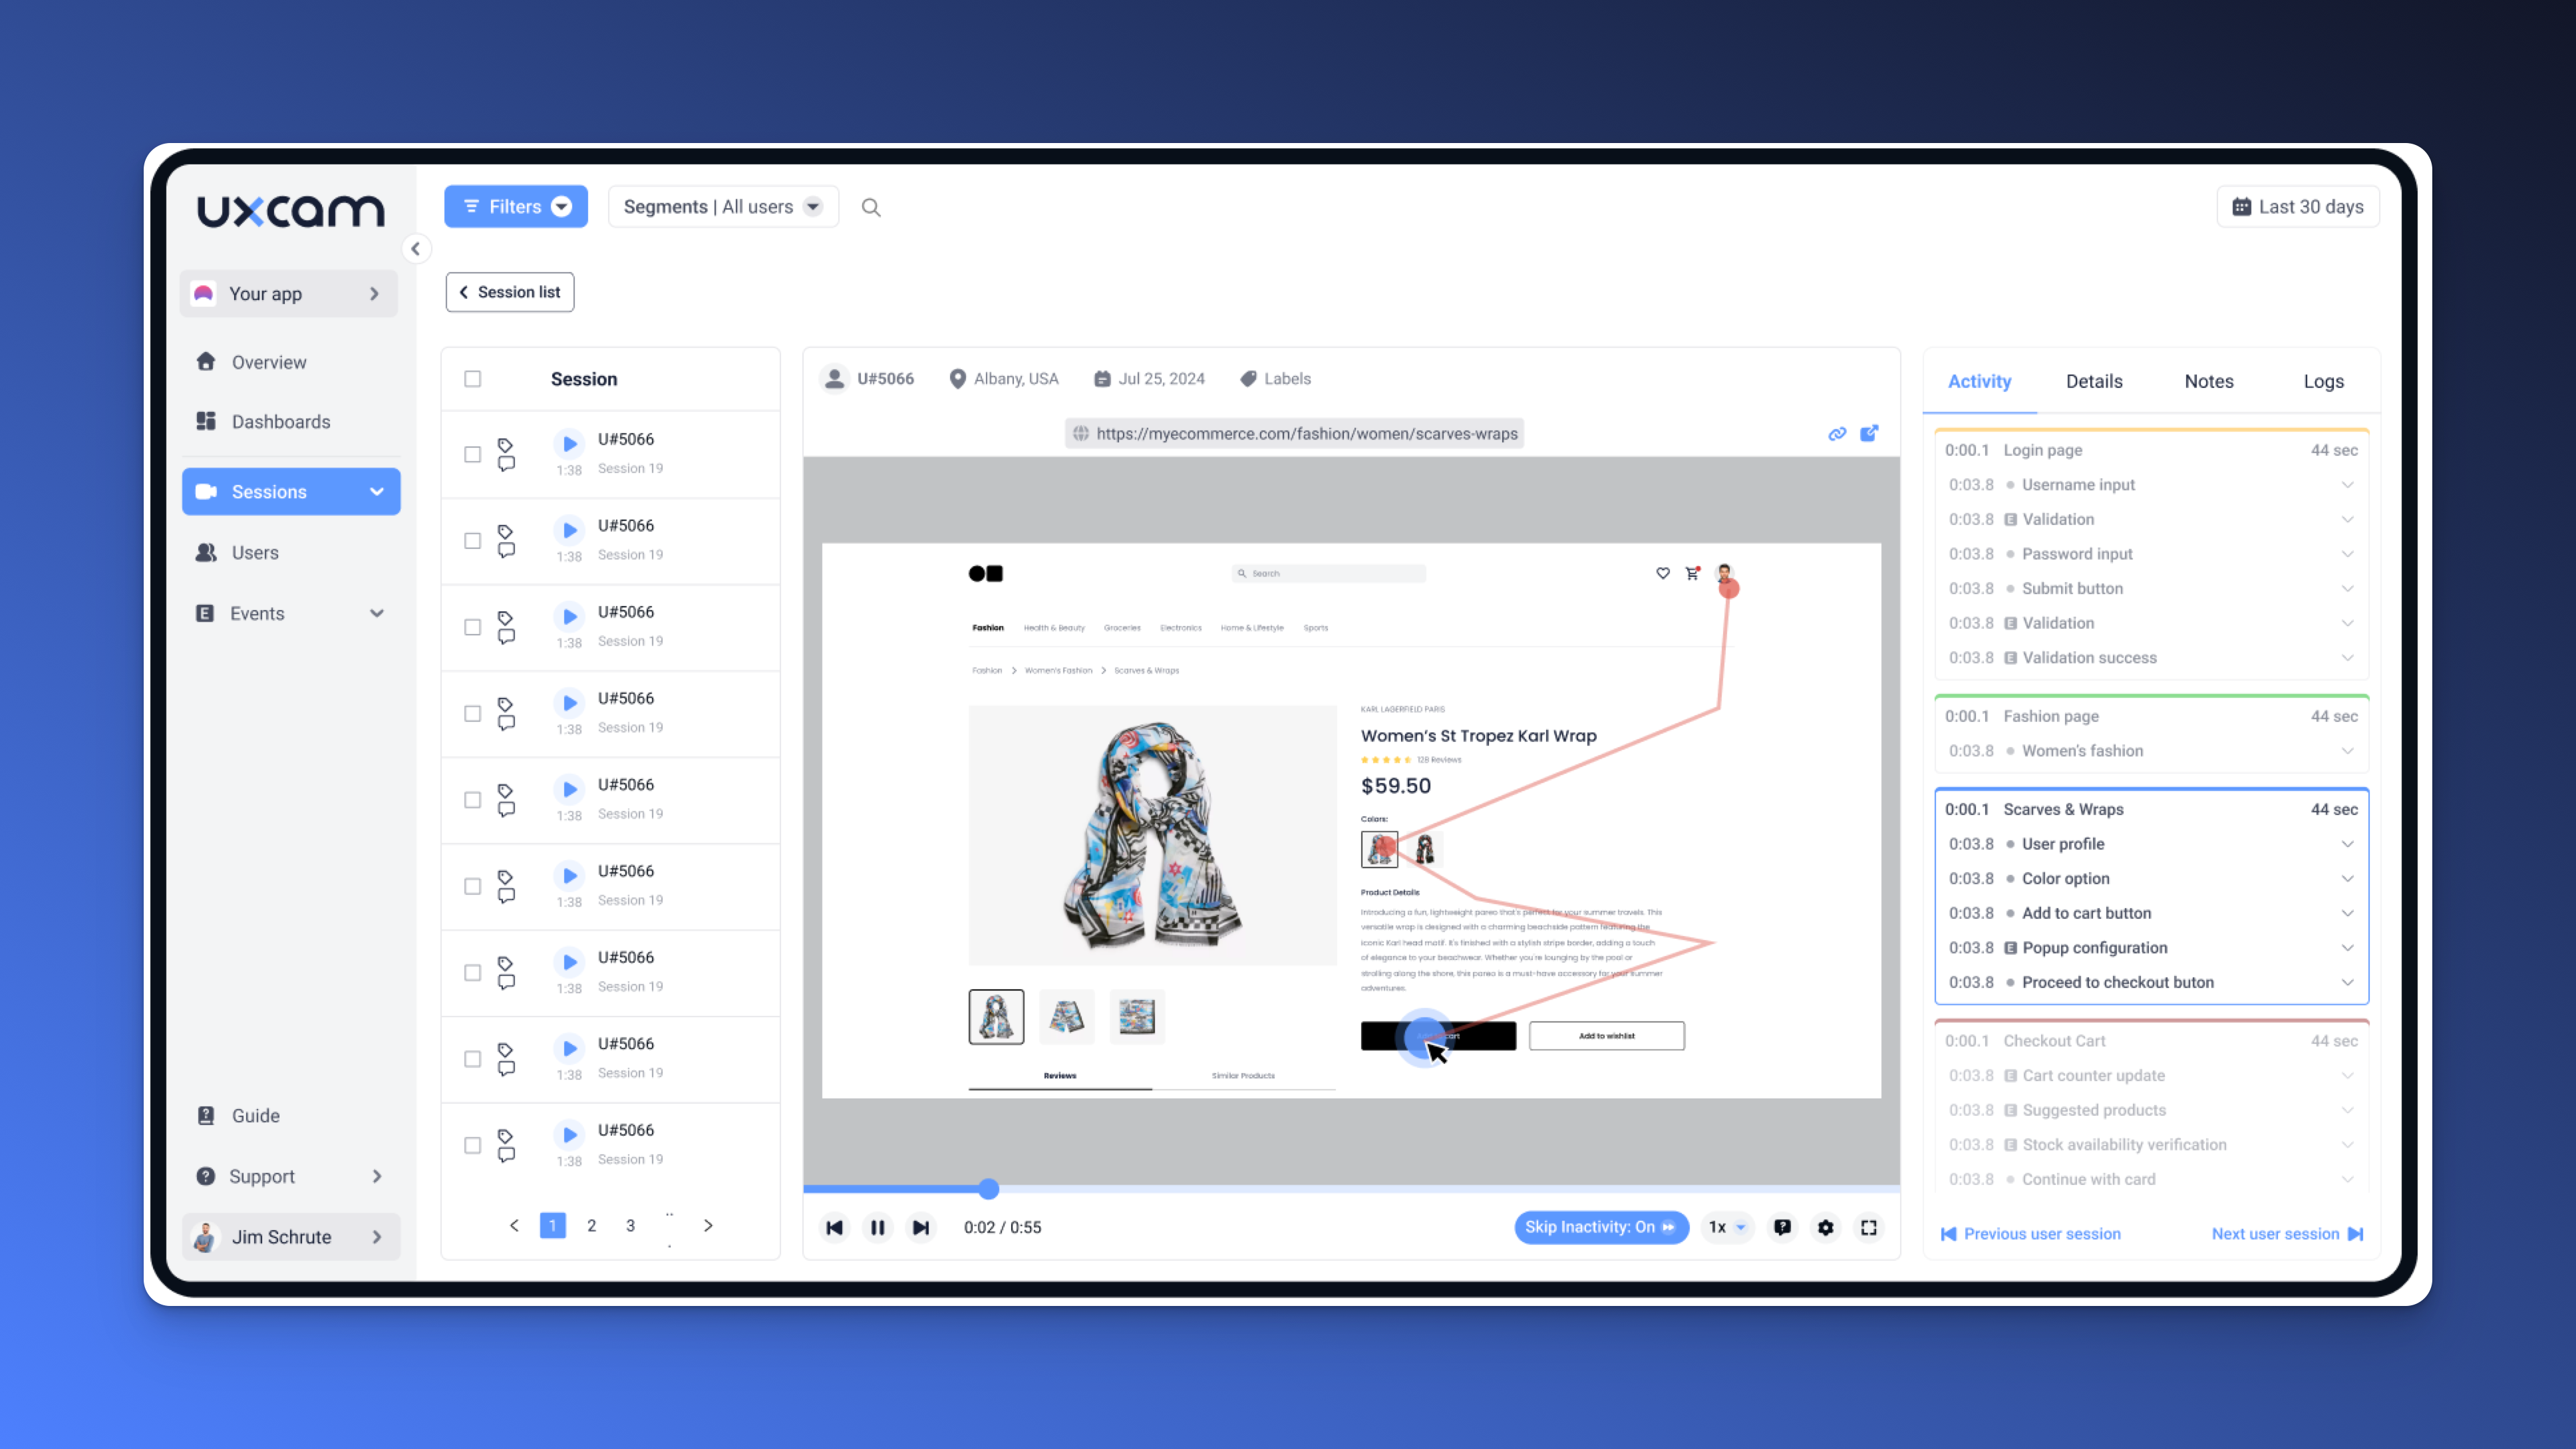
If you need a simple yet powerful solution, UXCam Web is built to eliminate the usual friction in web analytics. UXCam Web is designed to make tracking seamless. Instead of manually tagging every event, autocapture records key user actions automatically, ensuring you never miss critical insights.


When data shows a drop-off or unexpected behavior, one click to session replay provides the full picture, letting you see exactly how users navigate your product and where they struggle. This eliminates guesswork and helps you make informed product optimizations faster.
Unlike complex analytics tools that require advanced setup and expertise, UXCam Web keeps insights accessible. Its straightforward analytics allow teams to dive into meaningful data without a steep learning curve.
And because simplified analytics shouldn’t come with enterprise-level costs, UXCam Web offers an affordable solution—giving growing teams powerful insights without the overhead of expensive tools.
Step 2 - Set clear business goals & KPIs
Collecting data without a clear goal leads to confusion and wasted effort. Before you start tracking anything, define what success looks like for your product and business. Are you looking to increase sign-ups, improve feature adoption, or reduce churn?
Your KPIs (Key Performance Indicators) should directly align with business objectives and reflect how well your product is performing.
Some essential KPIs include:
Conversion rate – Measures how effectively users complete key actions (e.g., sign-ups, purchases).
Feature adoption rate – Tracks engagement with core features to assess usability and product stickiness.
Retention rate – Evaluates how well your product retains users over time.
Churn rate – Identifies how many users stop using your product and why.
Focusing on the right metrics ensures you spend time optimizing areas that actually drive growth, engagement, and revenue, rather than getting distracted by vanity metrics like total page views.
A strong goal-driven analytics strategy helps your team make data-backed decisions, prioritize improvements, and continuously refine your product based on real user behavior.
Step 3 - Implement data collection & tracking
Your analytics strategy is only as strong as the accuracy of your data. If your tracking setup is flawed, every insight that follows is unreliable—leading to poor decisions, misallocated resources, and missed opportunities. Without structured data collection, blind spots appear, and you risk optimizing the wrong areas while ignoring the real issues.
A solid data collection process ensures you’re capturing the right user actions and building a complete, trustworthy view of behavior. The key is balancing automation, customization, and compliance to track meaningful interactions without unnecessary complexity.
Start with autocapture to instantly collect user interactions like clicks, form submissions, and scroll depth. Instead of relying on engineers to manually tag every event, UXCam Web automatically logs critical engagement points, allowing you to analyze user behavior from the moment tracking is enabled. This not only saves time but ensures no essential actions are overlooked.


For deeper analysis, layer in custom events. Autocapture provides a broad foundation, but defining specific actions—such as signup completions, checkout progress, or onboarding steps—helps you monitor mission-critical flows. If you want to see where users abandon a multi-step process, tracking custom events allows you to diagnose friction points and optimize conversion paths with precision.
To connect behavioral data with acquisition efforts, enable UTM tracking. Without it, you won’t know which marketing campaigns are driving engaged users and which ones fall flat. UTMs let you attribute website traffic to the correct source—whether it’s a paid ad, email campaign, or organic search—so you can measure ROI accurately and allocate your budget effectively.
Throughout this process, privacy compliance must remain a priority. Regulations like GDPR, CCPA, and ePrivacy require transparency in data collection. Anonymizing IPs, obtaining proper consent for cookies, and clearly communicating data usage policies ensure you stay compliant while maintaining user trust.
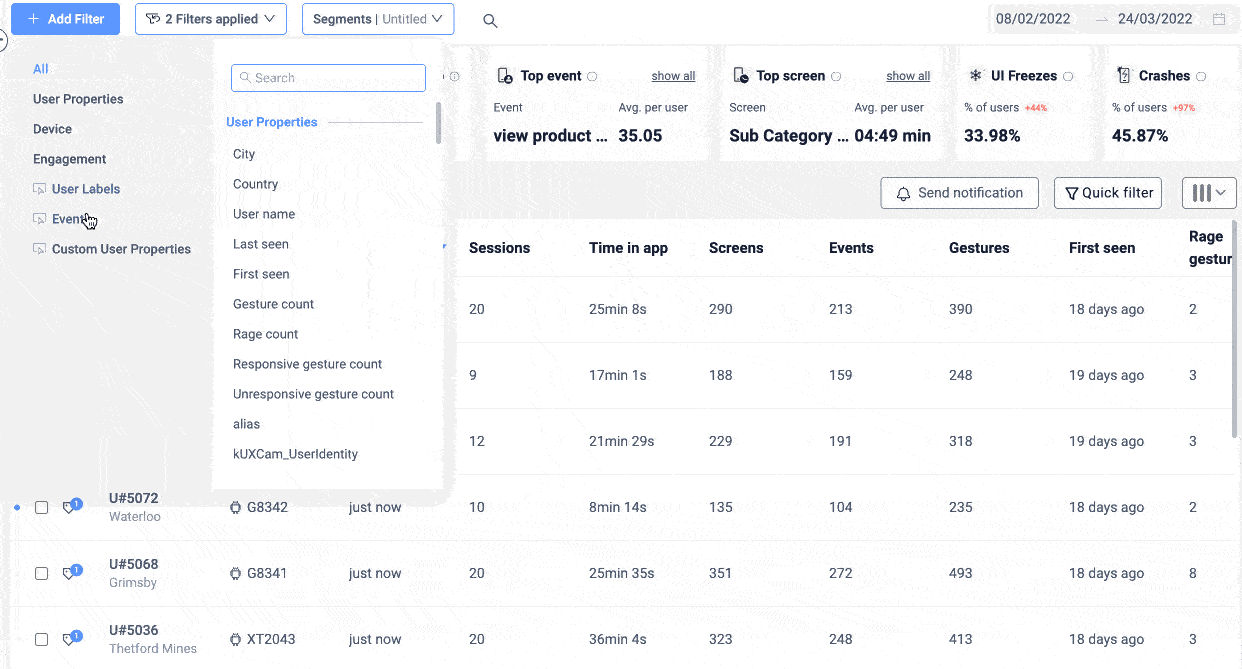
Step 4 - Track user behavior to identify friction points
You’ve set up your web analytics tools and defined your key metrics. Now, it’s time to uncover where users struggle. Friction points—confusing navigation, slow load times, unclear CTAs—silently kill conversions. Your job is to find them and fix them fast.
Start with session replay. Watch real users interact with your site. Do they rage-click buttons? Hesitate on a form field? Abandon a process halfway through? These are red flags. Every unnecessary second they spend struggling is a lost opportunity.
Use heatmaps and scroll tracking to see how users engage with your pages. Are they ignoring your CTA? Scrolling past key content? Clicking on non-interactive elements? If users don’t see or engage with what matters, you need to reposition or redesign.
Finally, segment your data. Compare new vs. returning users, mobile vs. desktop, different traffic sources. Patterns will emerge. Maybe mobile users struggle with navigation, or traffic from paid ads bounces at a high rate. These insights help you make targeted fixes.
Now, act! Prioritize the biggest friction points and test solutions. Move CTAs, simplify forms, speed up pages. Then, track again. A robust web analytics strategy isn’t about collecting data—it’s about using it to remove roadblocks and drive results.
Step 5 - Use funnel analysis to map the user journey
Now that you’ve identified friction points, it’s time to see the bigger picture—where users start, where they drop off, and what gets them to convert. That’s where funnel analysis comes in.
Think of a funnel as a series of checkpoints in your user journey. Maybe it’s
landing page → product page → cart → checkout → purchase.
Or
homepage → pricing page → sign-up form → confirmation.


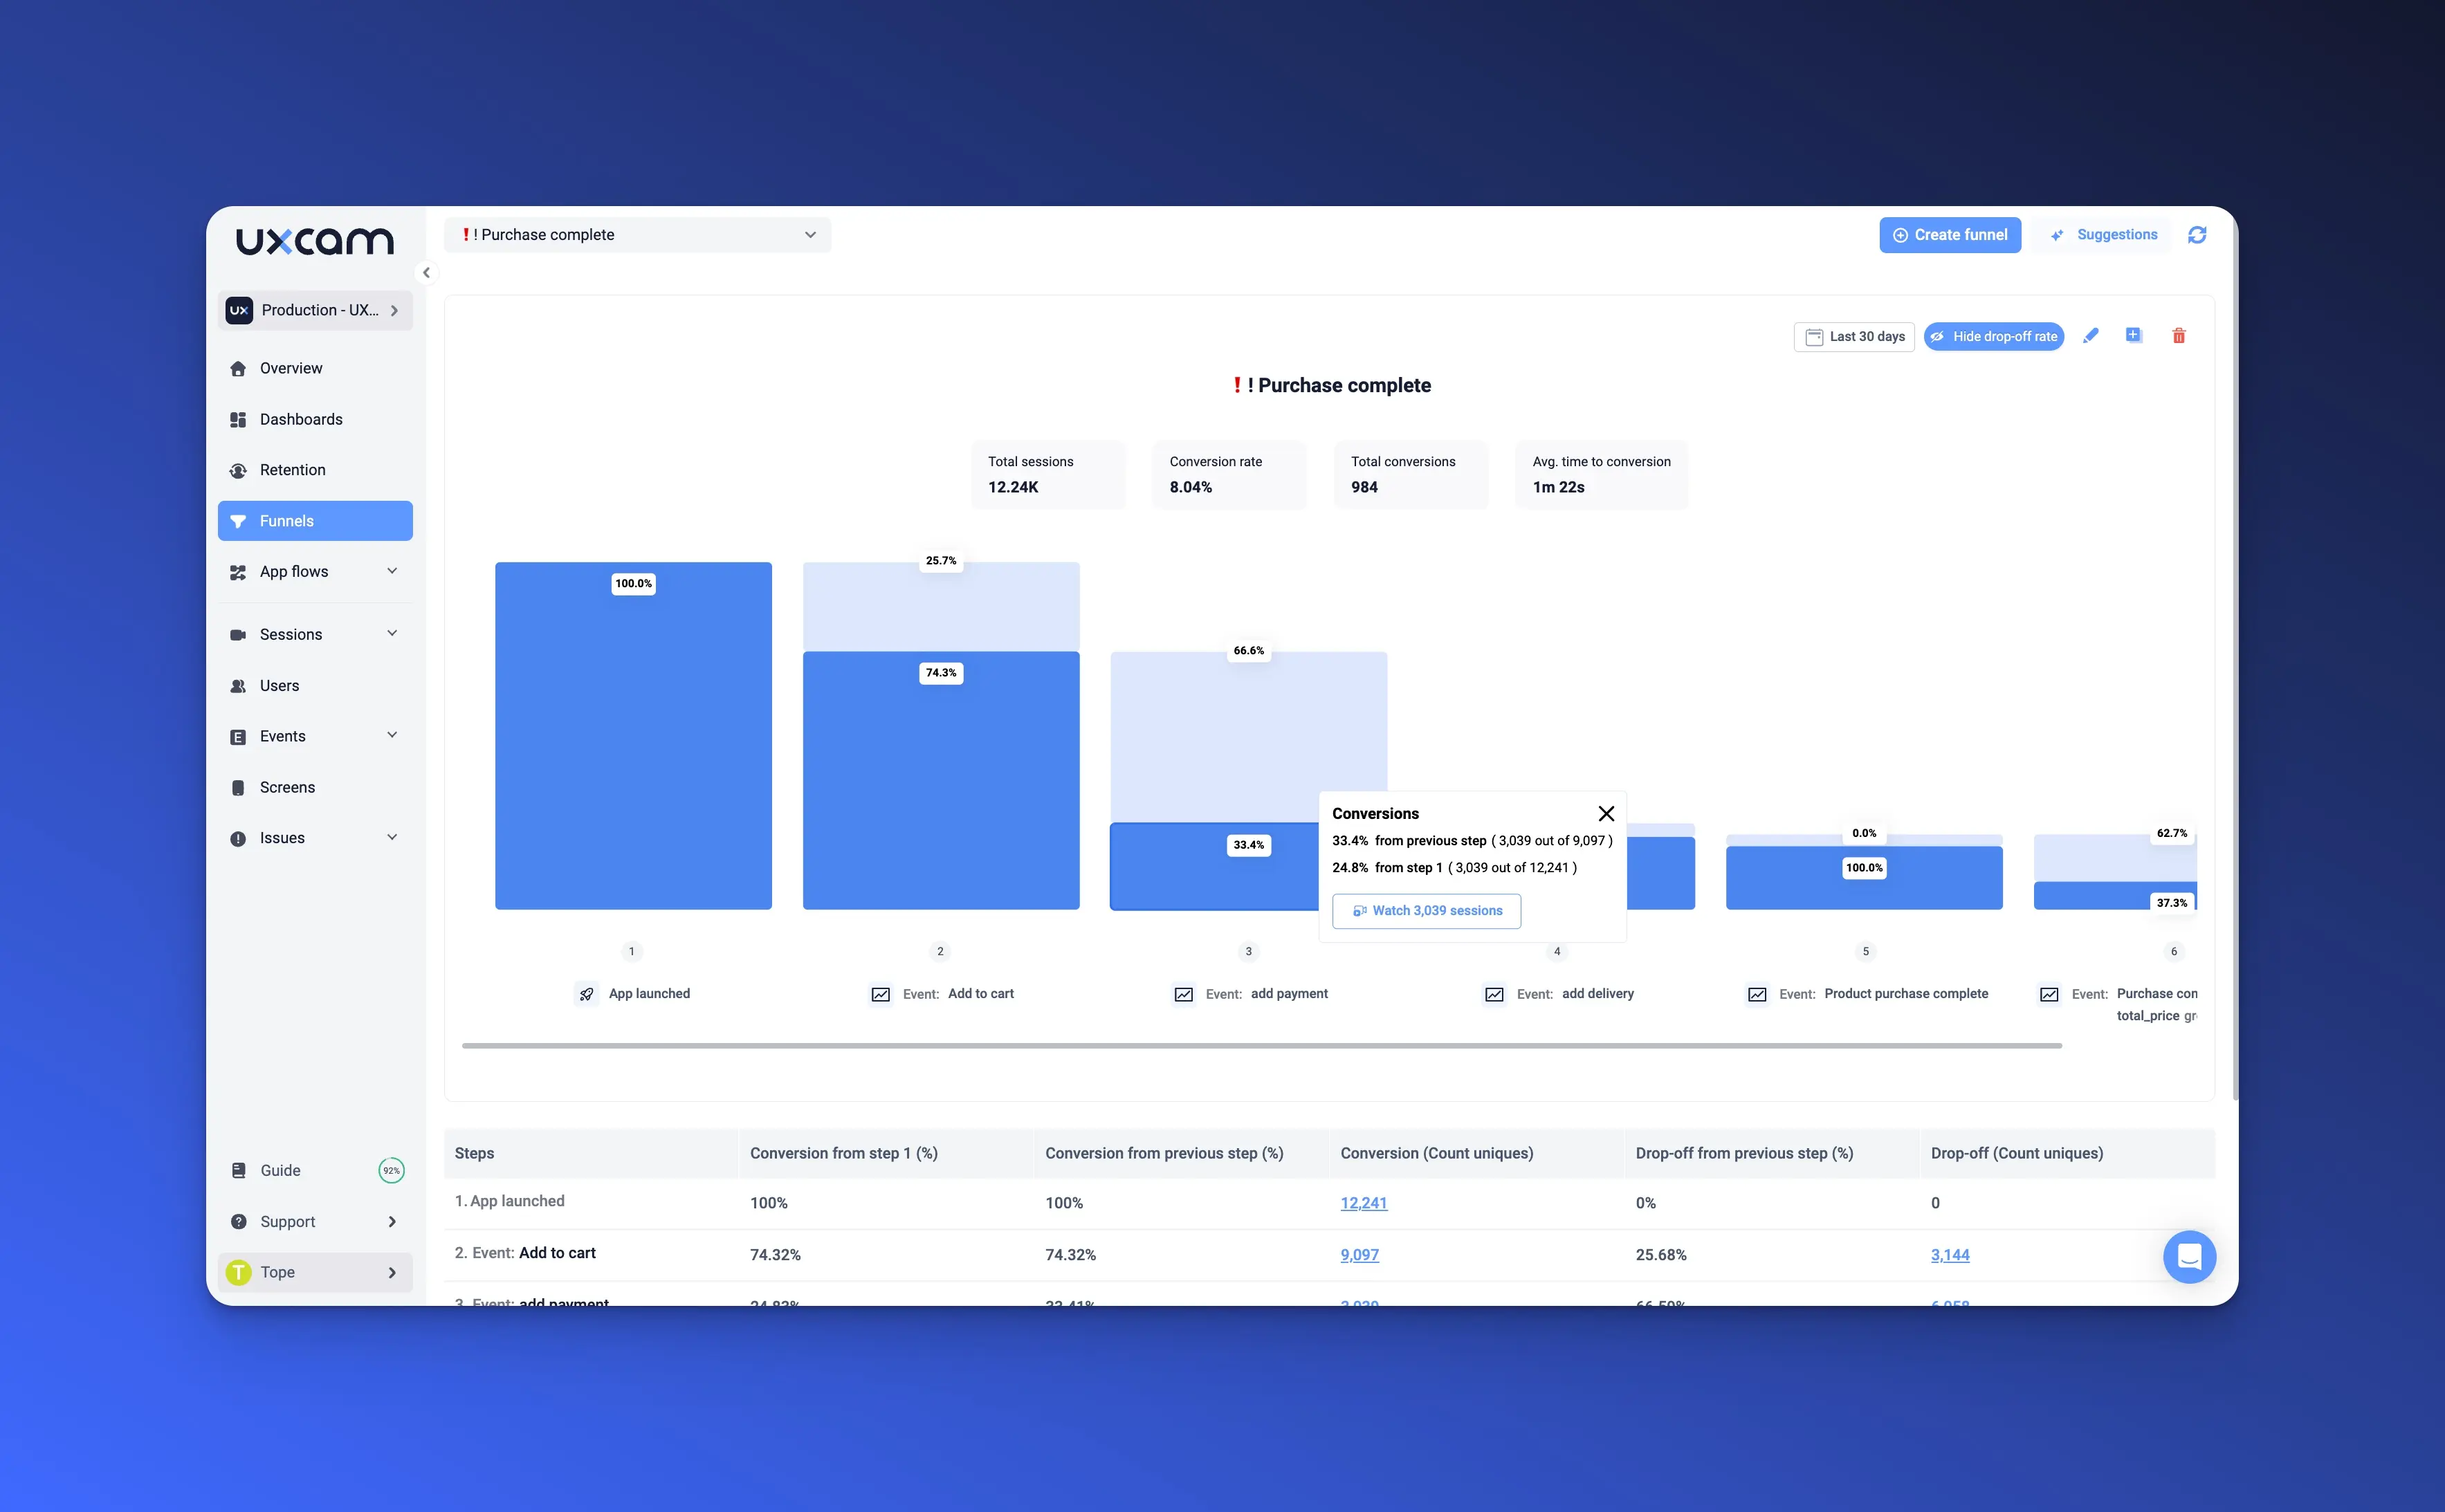
Every step tells a story. Your job is to find where users get stuck and why. Start by building a funnel in your analytics tool. Define the key steps, then track how many users make it through each stage. For example, if 60% of visitors bounce on the pricing page, something’s off. Maybe the pricing isn’t clear, or they need more details before committing. If only 10% complete a sign-up form, it might be too long or confusing.
Break it down further. Compare new vs. returning users. Do mobile users drop off earlier than desktop? Does one traffic source perform worse than others? Every insight is a clue.
Once you spot the leaks, test solutions. Simplify your checkout. Add trust signals. Make CTAs more obvious. Every small fix can push more users through the funnel.
Keep refining. Adjust the funnel, test changes, and track improvements. Your web analytics strategy is only as strong as your ability to guide users smoothly to conversion.
Step 6 - Create dashboards for data accessibility
You’ve been tracking user behavior, analyzing funnels, and identifying friction points. Now, you need a way to see everything at a glance, to instantly know what’s working and what’s not. You can’t afford to dig through endless reports every time you need an insight. You need a dashboard that turns raw data into clear, actionable insights. Instead of sifting through spreadsheets, you should be able to immediately spot drop-off points, identify high-engagement pages, and track key metrics over time, all in one place.
Start by defining what matters. What do you need to see every day? Maybe it’s conversion rates, session trends, or retention data. If you track too much, your dashboard becomes noise. If you track too little, you miss the full picture. Focus on the numbers that tell a story.


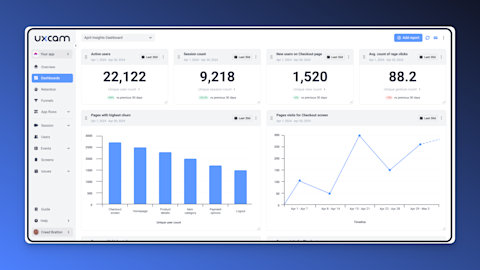
Next, customize your dashboard to fit your needs. A product manager might need to see feature adoption trends, while a marketer tracks user acquisition. A generic dashboard won’t work for everyone. That’s why UXCam’s customizable dashboards let you build views that match your priorities. Whether you need drop-off analysis, session replays, or user engagement stats, you can tailor your reports to surface the right insights.
A great dashboard isn’t just for you. Your whole team should have access to data that helps them make better decisions. Whether it’s marketing adjusting campaigns, product refining features, or customer success improving onboarding, everyone benefits when insights are clear and accessible. With UXCam, you have an extensive library for ready-to-use report as well as an AI assistant to help you get started fast.
Data is only useful if you can act on it. A good dashboard turns information into strategy—helping you spot issues, test solutions, and improve continuously. With the right setup, you’re no longer reacting to problems—you’re anticipating them.
Step 7: Test & optimize based on insights
You’ve gathered the data, but insights alone won’t improve your product—you need to act on them. This is where testing and optimization come in. Every friction point you uncover is an opportunity to refine the user experience, increase conversions, and improve engagement.
Start with A/B Testing. If users drop off at a certain step, don’t guess why—test different variations. A shorter form, a clearer CTA, or a redesigned checkout flow might make all the difference. Keep your tests focused—change one element at a time so you can measure the true impact.
For example:
Low CTA clicks? Test different colors, wording, or placement.
Cart abandonment? Try simplifying the checkout process.
High bounce rate on landing pages? Experiment with different headlines or page layouts.
While raw numbers tell you what’s happening, but they don’t explain why. That’s where UXCam’s session replays and heatmaps come in. If your data shows a high drop-off rate on a page, use session recordings to watch users interact in real time. Are they rage-clicking? Scrolling aimlessly? Hesitating before abandoning?
With heatmaps, you can see which areas of a page get the most attention and where users disengage. These insights help you pinpoint the exact pain points in your UI so you can optimize with confidence.
Finally, test, iterate, and repeat. Optimization is an ongoing process. Don’t assume a single change will fix everything—keep testing, tweaking, and refining. The key to a strong web analytics strategy is never assuming but always validating.
Step 8: Segment users for deeper insights
Not all users behave the same way. Treating them as a single group means missing out on opportunities to personalize and optimize their experience.
Break users into meaningful segments as different users interact differently with your website or app. By segmenting them, you gain clearer insights into what works for one group but not for another. Start by grouping users based on:
Device type (mobile vs. desktop)
New vs. returning users
Geographic location
Traffic source (organic, paid, social, etc.)
User behavior (active users, dormant users, drop-offs)
For example, if mobile users have a higher bounce rate, there might be a usability issue on smaller screens. If paid traffic converts at a lower rate, your ad messaging might not align with landing page content.
With UXCam’s segmentation tools, you can filter session replays by behavior, compare how different user groups navigate, and identify roadblocks specific to each segment. Instead of making broad optimizations, you can make targeted changes that drive real impact.


With the right segmentation, you can personalize experiences, improve engagement, and optimize your site or app for the audiences that matter most. Instead of fixing problems for everyone, you fix the right problems for the right users.
Step 9: Analyze retention & churn to improve engagement
Getting users to sign up is a win, but it’s just the first step. The real challenge? Keeping them engaged. If users drop off after their first visit, it means they didn’t find enough value to return. Something is missing, and it’s your job to find out what.
Retention analysis helps you track when and why users leave. Start by asking the right questions:
How many users come back after Day 1?After a week? After a month?
Where do users typically drop off in their journey?
What features do your most engaged users rely on?
Look at the patterns. If most users leave right after onboarding, your setup process might be overwhelming—or worse, underwhelming. If they disappear after using a particular feature, that feature might be confusing or broken.
This is where UXCam’s retention analytics give you a clear advantage. Instead of guessing, you can track user behavior over time to see exactly where engagement drops. Session replays let you watch users interact before they churn, revealing moments of hesitation, frustration, or confusion.


For example, if many users exit immediately after opening a new feature, it could mean:
The feature isn’t solving their problem.
The interface is unclear.
They don’t even realize its full value.
With UXCam’s insights, you don’t just see retention rates—you understand why some users stay while others leave.
Now, turn those insights into action. If users drop off after onboarding, refine the experience—add tooltips, in-app walkthroughs, or a progress indicator to keep them moving forward. If they abandon a feature, test making it more intuitive, more visible, or better explained.
Small improvements, when targeted at the right pain points, can make a huge difference. Retention isn’t about chasing lost users—it’s about making sure they never leave in the first place. Because real growth doesn’t come from just acquiring users—it comes from keeping them.
Step 10: Ensure data accuracy & continuous improvement
Your entire web analytics strategy is only as good as the data behind it. If your tracking is off, even the best insights become meaningless. Imagine making major product decisions based on flawed reports—optimizing the wrong features, fixing non-existent issues, or missing real problems altogether. That’s what happens when your data isn’t accurate.
Before you analyze trends or optimize funnels, you need to audit your data regularly. Ask yourself:
Are your tracking events firing correctly? A missing or duplicated event can throw off your entire analysis.
Are you measuring the right KPIs? You might be tracking vanity metrics instead of the ones that actually impact growth.
Do your reports reflect real user behavior? If the numbers look too good (or too bad) to be true, something might be wrong.
Data accuracy isn’t just about collecting numbers—it’s about making sure they tell the right story. If you don’t verify your data, you’re not making data-driven decisions—you’re just guessing.
This is where UXCam’s event tracking and customizable dashboards help you stay in control. Instead of digging through endless reports, you get real-time visual insights into your key metrics. If a sudden drop in conversions happens, you catch it immediately and take action—instead of realizing it weeks later.
With clear data visualization, you can spot trends, anomalies, and problem areas instantly, so you’re always working with reliable insights.
Your product evolves. Your users change. Your analytics strategy has to keep up.
Winning companies don’t set up tracking once and forget it. They continuously review, refine, and optimize their data collection. They test new ideas, challenge assumptions, and adjust based on real-time insights.
That’s the key to building a resilient, data-driven strategy—one that adapts as fast as your users do. Keep learning. Keep improving. And make sure your data is always telling you the truth.
What are the best tools web analytics?
The best web analytics tools track website traffic, user behavior, and product interactions to help businesses improve conversions and user experience.
Traditional web analytics tools, like Google Analytics, Plausible and Matomo, focus on traffic sources, marketing performance, and audience demographics. Others, like UXCam for Web, provide in-depth session replays, heatmaps, and user interaction tracking for better product experience analysis.
Understanding these differences ensures you select the right web analytics platform for your business goals, whether it's improving conversions, enhancing user engagement, or optimizing product usability.


Why UXCam for web?
Traditional web analytics tools often require teams to switch between multiple platforms to get a complete picture of user behavior. UXCam for Web eliminates that hassle by combining session replays, event tracking, and product analytics in one place.
Here’s what makes UXCam for Web stand out:
No more switching between tools – Seamlessly integrates session replays with deep analytics, so you don’t have to manually match data across different platforms.
Seamless data connection – Unlike tools that require manual ID matching, UXCam automatically links session data with user actions, making analysis effortless.
Autocapture capabilities – Eliminates complex event setup by capturing key interactions automatically, reducing engineering overhead.
Built for modern web apps – Fully supports single-page applications (SPAs) and dynamic states, ensuring accurate tracking without broken session data.
For teams looking for a complete web analytics solution that provides real user insights, UXCam for Web offers a powerful yet simple way to analyze behavior, optimize the user experience, and drive conversions.
Conclusion & next steps
Web analytics isn’t just about collecting data—it’s about making sense of it. Without a clear strategy, you risk drowning in numbers without gaining real insights. But when done right, analytics becomes a powerful tool for understanding user behavior, identifying friction points, and improving conversions.
To make analytics work for you, focus on clear business goals, actionable data, and automation. Relying solely on numbers without session replays, heatmaps, or real user insights leaves too many questions unanswered. At the same time, switching between multiple tools creates fragmented data and unnecessary complexity.
UXCam Web simplifies your analytics. With autocapture, session replays, and seamless event tracking, you get a complete picture of user behavior—all in one place. No more guesswork, no more manual setup, just real insights that drive better decisions.
If you’re ready to simplify your web analytics and start making smarter, data-driven improvements, try UXCam Web Analytics today.
You might also be interested in these;
What is Web Analytics? Definition, Metrics & Best Practices
How To Collect User Feedback for SaaS & Best Tools
SaaS Customer Retention Strategies, Benchmark Rates & Metrics
AUTHOR
Tope Longe
Product Analytics Expert
Ardent technophile exploring the world of mobile app product management at UXCam.


Related articles


Website Analysis
21 Website Visitor Tracking Tools with Top-Rated User Reviews
Discover the 21 best website visitor tracking tools, featuring top-rated user reviews to help you choose the perfect solution for understanding and enhancing your site’s...
Tope Longe
Product Analytics Expert


Website Analysis
14 Website Analytics Metrics to Track for Product Teams
Discover 14 essential website analytics metrics every product manager should track to improve user experience, boost conversions, and drive product...


Website Analysis
Top 14 SaaS Product Usage Metrics and How to Improve Them
Discover the top 14 SaaS product usage metrics to track, including engagement, retention, and conversions, plus actionable strategies to optimize and drive...
Tope Longe
Product Analytics Expert