UXCam vs Amplitude: A real comparison for mobile product analytics


Amplitude tells you what users did. UXCam shows you what they actually experienced.
That's the core difference. Amplitude is built around predefined events and structured metrics. UXCam is an AI-powered product analytics platform built around visual user behavior. Session replays, gesture tracking, heatmaps, and an AI product analyst named Tara who watches real sessions and explains what's going wrong and what to do next.
Both tools serve product teams. But they solve fundamentally different problems. This guide breaks down where each tool delivers, where Amplitude creates blind spots, and how UXCam fills the gaps that event-based analytics can't reach, especially on mobile.
If you're evaluating both, already using Amplitude and feeling like something's missing, or trying to decide where your analytics budget should go, this comparison will help you make that call.
UXCam vs Amplitude at a glance
Here's how the two tools compare across the criteria that matter most when choosing between them, or deciding whether you need both.
| Criteria | UXCam | Amplitude |
|---|---|---|
| Primary approach | AI-powered product analytics combining qualitative and quantitative insight | Event-based quantitative analytics focused on metrics and trends |
| Core data source | Visual behavior (session recordings, gestures, screens) + events | Predefined event logs and user properties |
| Setup and time to value | Days. Autocapture starts recording immediately with a single SDK | Weeks to months. Requires event planning, engineering, and release cycles |
| Answering new questions | Retroactive. Analyze already-captured data with smart events or Tara | Requires new instrumentation, engineering, and fresh data collection |
| AI capabilities | Tara: AI product analyst that visually analyzes session recordings frame-by-frame | Amplitude AI suite: conversational queries, AI agents, and trend surfacing — all limited to structured event data |
| Mobile UX visibility | Full screen-level and gesture-level visibility including rage taps, UI freezes, and unresponsive elements across all major mobile frameworks | Event-based with session replay on iOS, Android, and React Native; gestures and visual friction not captured at the same depth |
| Web support | Yes. Same visual, behavior-led approach on web and mobile | Yes. Event tracking across web and mobile |
| Session replay | Native and deeply integrated with all analytics features across mobile and web. Built into the core platform from day one. Supports iOS, Android, React Native, Flutter, Xamarin, Cordova, and web | Available across web (JS, GTM), iOS, Android, and React Native. Originally added to complement event-based analytics, not built as a core foundation |
| Heatmaps | Native tap, gesture, and scroll heatmaps for mobile; click and scroll heatmaps for web | Click maps, scroll maps, and selector maps — web only. Not available for native mobile apps. Gated behind Growth/Enterprise with Session Replay add-on |
| Crash and issue diagnosis | Visual playback of user journey before crashes, UI freezes, and errors | Captures JS console logs, network errors, and runtime errors within session replay |
| Frustration detection | Automatic capture of rage taps, rage quits, UI freezes, and unresponsive gestures — connected across heatmaps, funnels, issue analytics, and Tara | Frustration signals detected during session replay playback. Not connected across broader analytics features |
| Team accessibility | Used directly by PMs, designers, QA, engineers, and CS teams | Primarily used by analytics and data teams |
| Pricing model | Session-based with predictable costs; no event volume scaling | Usage-based tied to MTUs and event volume; costs grow with scale |
Now let's go deeper into what each tool actually does and where the gaps appear.
What is Amplitude?


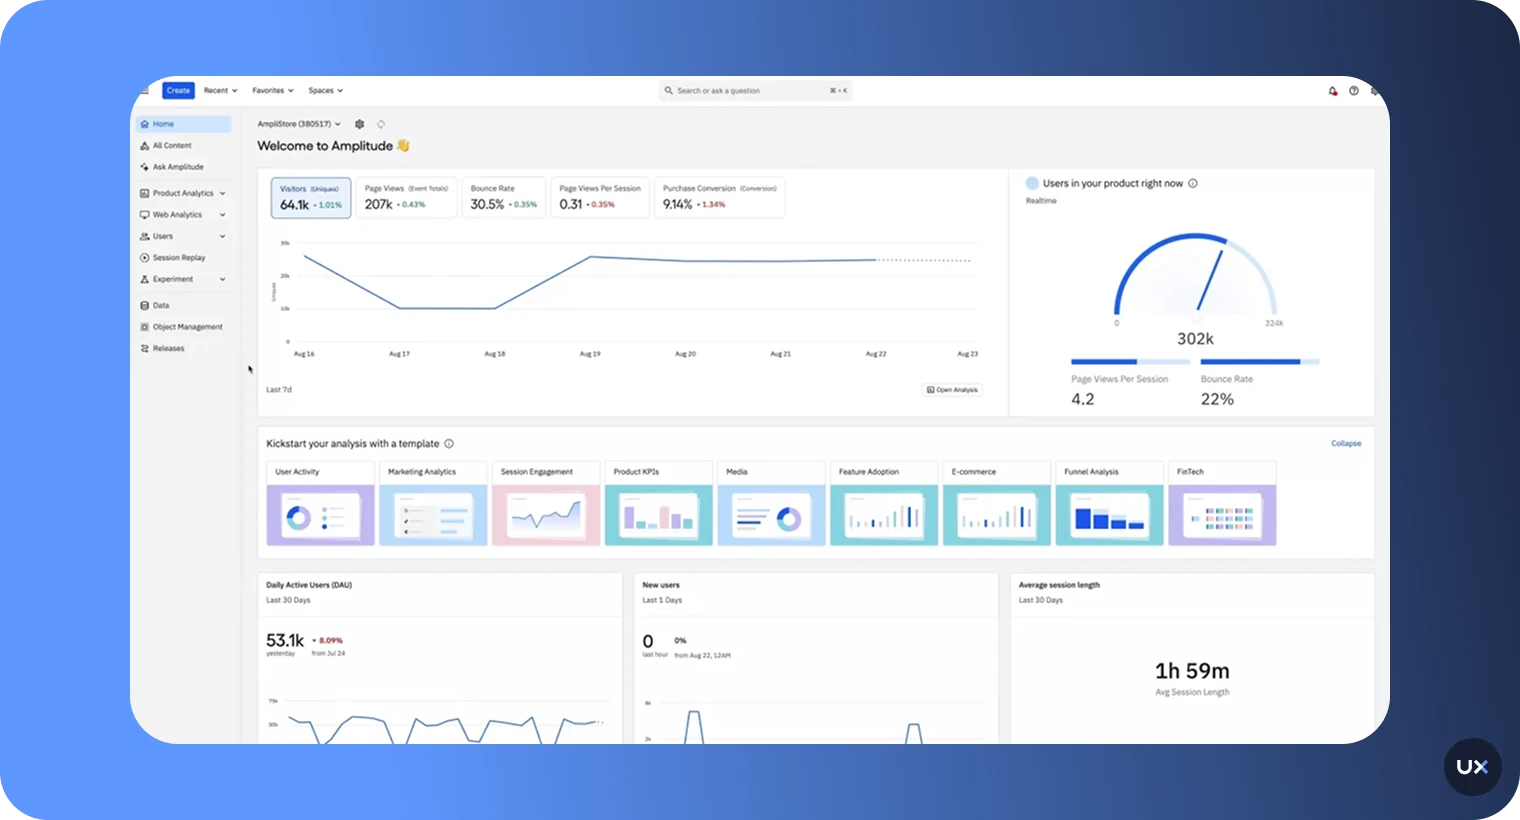
Amplitude is a quantitative, event-based product analytics platform. It tracks predefined user actions like button clicks, page views, and feature triggers, then organizes that data into funnels, cohorts, retention curves, and trend reports.
It's designed for product, growth, and analytics teams that want structured answers to one question: what did users do?
For teams with stable product flows, dedicated analysts, and the engineering resources to instrument and maintain events over time, Amplitude is a solid foundation for measuring known behaviors at scale.
What Amplitude does well
Amplitude's strength is structured measurement. If you know exactly what you want to track and have the resources to set it up, it delivers.
Event-based analytics at scale. Amplitude handles large volumes of event data and provides clean trend reporting across long timeframes. If your team lives in dashboards and KPIs, this is where Amplitude shines. You can track daily active users, feature adoption, and conversion rates reliably across millions of events.
Funnel analysis with cohort depth. Amplitude's funnel builder lets you define multi-step conversion flows and break them down by user segments. You can compare how different cohorts move through the same flow over time, which is useful for measuring the impact of experiments or releases.
Retention and lifecycle tracking. Amplitude offers flexible retention analysis including N-day, unbounded, and custom retention views. For teams measuring long-term engagement or trying to understand when users churn, this gives a clear quantitative picture.
Cross-platform event tracking. Amplitude tracks user actions across web and mobile through a unified event schema. If you need a single view of what users did across platforms, Amplitude's identity resolution and cross-platform tracking handle this well.
Collaboration and governance. Amplitude includes features for data governance, taxonomy management, and team collaboration. For larger organizations with multiple product teams, this helps keep event definitions consistent.
Session replay and heatmaps. Amplitude has added session replay capabilities across web, iOS, Android, and React Native. It also now offers heatmaps (click maps, scroll maps, and selector maps) as part of its Session Replay offering. These are meaningful additions, but important context matters: session replay was not part of Amplitude's original architecture. It was introduced to complement their event-based analytics model, not as the foundation for how the platform works. Heatmaps are currently web-only and gated behind Growth or Enterprise tiers with the Session Replay add-on. For mobile teams, this means no native mobile heatmaps. The depth and integration of these features differs from platforms that were built around visual behavior from the start.
Amplitude AI. Amplitude has built a growing AI suite under the "Amplitude AI" umbrella. This includes Ask AI (a conversational interface for natural language data queries), AI Agents (automated monitoring that can sense, analyze, and flag data-driven issues), AI Context (which lets admins provide business-specific guidelines to improve response accuracy), and newer capabilities like AI Visibility and Amplitude MCP. These are useful tools for working faster with structured data.
Where Amplitude falls short for mobile teams
Amplitude's event-first model creates real constraints. And those constraints compound over time, especially for mobile product teams.
The instrumentation problem
Every behavior you want to track in Amplitude must be planned, defined, coded, and maintained. This is not a weekend project. Amplitude implementations can take months to get right, and for enterprise teams, full instrumentation has been known to take up to a year.
And here's the fundamental catch: you can only see what you already thought to track. If you didn't anticipate a behavior and instrument an event for it, it doesn't exist in Amplitude. You're blind to anything outside your predefined tracking plan.
The re-instrumentation cycle
When your product changes (new screens, redesigned flows, updated features) your event schema has to change too. That means engineering tickets, code changes, app releases, and waiting for fresh data. Every new question that requires a new event adds lag between the question and the answer.
For mobile teams shipping updates every two weeks, this creates a permanent gap between what the product does and what the analytics can show.
The engineering bottleneck
Product managers can't just go explore. If you want to track something new, you need engineering to build and ship it. This creates a dependency where the people who need insights most are waiting on the people who build the product.
Session replay exists, but the architecture matters
Amplitude now offers session replay across web, iOS, Android, and React Native, with solid debugging context like JS console logs, network errors, and runtime error capture. It also includes frustration signal detection during playback.
But there's an important architectural difference between a platform that added session replay to an event-based system and a platform that was built around visual behavior from day one.
In UXCam, session replay is the connective tissue for the entire platform. You can jump from a funnel drop-off directly into the replay of a user who dropped off at that step. You can go from a heatmap interaction to the session where it happened. You can filter sessions by frustration signals like rage taps or UI freezes. You can ask Tara, UXCam's AI product analyst, to watch sessions for you, explain what she found and what should be your next steps.
In Amplitude, session replay complements the event-based model. It provides visual context alongside event data, which is valuable. But the core analytical workflow still revolves around events. Frustration signals are surfaced during replay playback rather than being connected across funnels, heatmaps, and AI analysis the way they are in UXCam.
For teams that need more mobile framework coverage beyond iOS, Android, and React Native (such as Flutter, Xamarin, or Cordova), UXCam's broader native support is worth considering.
Heatmaps: web only, higher tiers only
Amplitude now offers heatmaps, but with two significant limitations for mobile teams. First, heatmaps are web-only. There's no native mobile heatmap support for iOS or Android. Second, the feature is gated behind Growth and Enterprise tiers with the Session Replay add-on.
UXCam offers native tap, gesture, and scroll heatmaps for mobile apps from the start, across every supported framework. For mobile-first teams, this is a gap Amplitude hasn't closed.
Mobile gestures still lose context in events
Mobile apps run on gestures: swipes, taps, pinches, long presses. In event logs, all of these are flattened into the same data structure. A confident single tap, a hesitant double-tap, a frustrated rapid-tap, and an accidental tap on a non-interactive element are four entirely different user experiences. Event-based analytics treats them all the same.
While Amplitude's session replay can now show some of this visual context, it's only visible when you're watching individual replays. It doesn't surface in funnel analysis, cohort reports, or trend dashboards the way UXCam's gesture-level data does.
The gap in one sentence: Amplitude answers "what happened." UXCam answers "what did the user experience, and why."
What is UXCam?


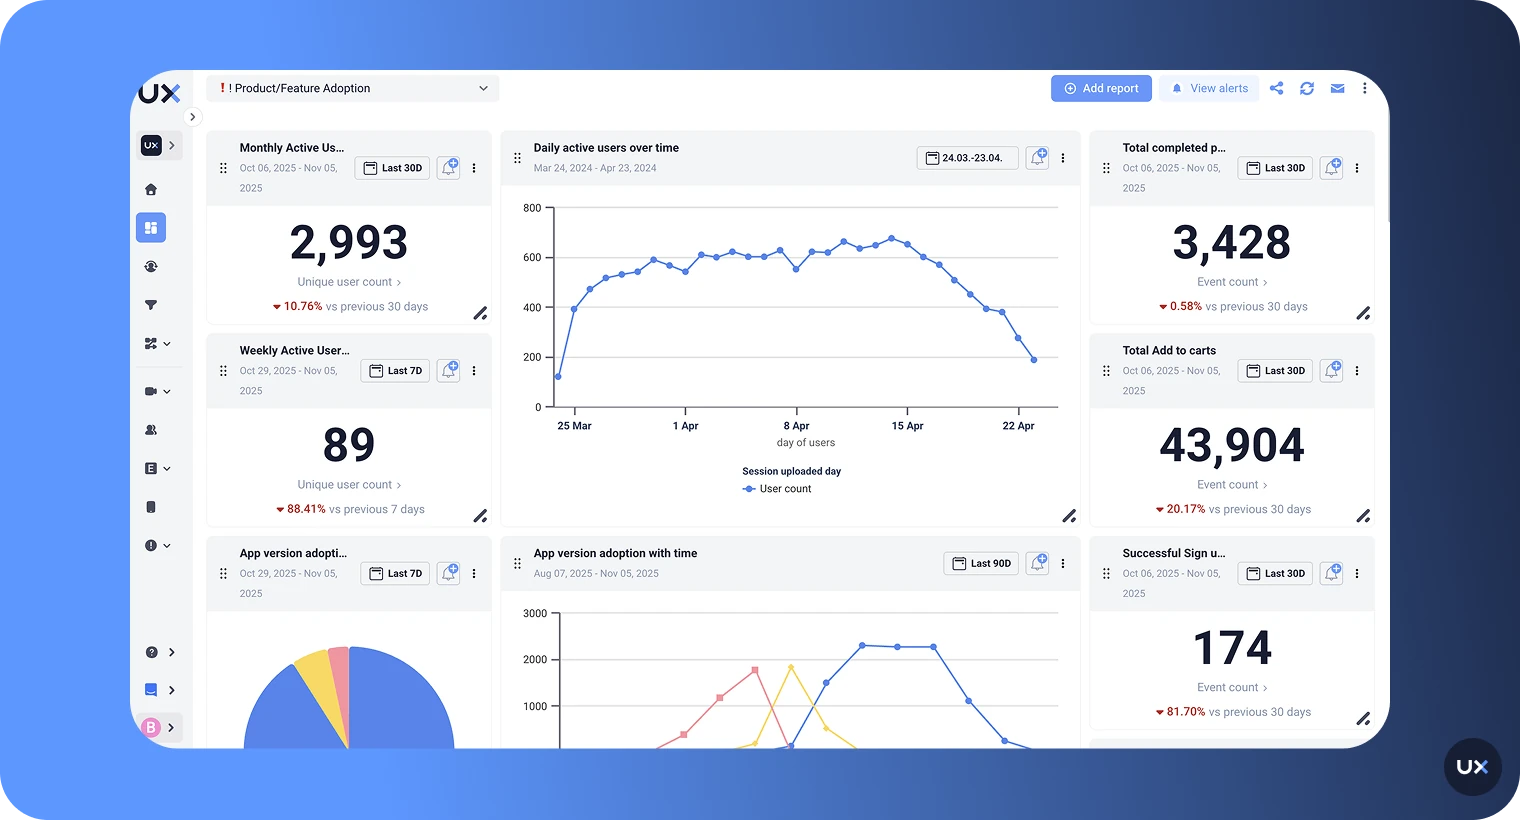
UXCam is an AI-powered product analytics platform that unifies qualitative and quantitative analytics in one place. It combines session replay, heatmaps, funnel analytics, retention analysis, issue analytics, and AI-powered insights to help teams understand the "why" behind user behavior, not just the "what."
Built as the mobile-first leader in AI product analytics, UXCam now also supports web analytics. Teams can apply the same visual, behavior-led approach across both mobile and web using a single SDK on each platform, with no need to juggle separate tools.
Where Amplitude requires you to predict what's worth tracking before you ship, UXCam's intelligent autocapture records screens, gestures, interactions, and technical events automatically from day one. No event planning. No engineering tickets. No waiting for data.
The platform is trusted by over 37,000 products worldwide, with a 4.6 rating on G2 and strong reviews on Capterra and Gartner Peer Insights.
Why UXCam was built differently
Most product analytics platforms started with events. UXCam started with sessions.
That architectural choice shapes everything. Because UXCam captures the full visual session by default, every feature in the platform connects back to what users actually saw and did. Funnels link to session replays. Heatmaps link to specific sessions. Issue analytics link to the visual playback of what happened before a crash. Tara watches the recordings themselves.
This "session-first" approach means that every event set up in UXCam is automatically validated against real visual behavior. In event-first tools, events can be captured in the wrong place or missed entirely, leading to incorrect reporting that teams don't discover until it's too late.
What UXCam captures that Amplitude cannot
Session replay built into the core platform
UXCam's session replay was the foundation the entire platform was built on. It's not a bolt-on or an add-on. Every other feature in UXCam — funnels, heatmaps, retention analytics, issue analytics, Tara — connects directly to session replays.
This means you can go from any data point to the actual user experience in one click. See a funnel drop-off? Watch the sessions. See a rage tap cluster on a heatmap? Jump into the session. See a crash spike? Watch what users experienced right before it happened.
UXCam supports session replay natively across iOS, Android, React Native, Flutter, Xamarin, Cordova, and web. This broader mobile framework coverage is a direct result of being built mobile-first. Amplitude's replay supports web, iOS, Android, and React Native, but teams on Flutter, Xamarin, or Cordova don't have the same option.
Gesture analysis that reveals intent
Mobile interactions run on gestures, and UXCam captures them in full detail. Taps, swipes, pinches, rage taps, and unresponsive gestures are all recorded and visualized through heatmaps that show exactly where users interact on each screen.
When you see a cluster of rage taps on a button that should be working, or confused taps on a non-interactive element, you have immediate visual evidence of a UX problem that no event log would capture.
Native mobile heatmaps — not just web
This is where the gap is clearest. UXCam offers native tap, gesture, and scroll heatmaps on mobile, across every supported framework. You can see exactly where users are tapping, swiping, and scrolling on any screen of your app.
Amplitude's heatmaps are web-only. If you're building a mobile app and want to see interaction patterns across your screens without watching individual replays, UXCam is the only option between the two.
Visual funnels connected to real behavior
UXCam's funnel analytics show conversion and drop-off across user flows, similar to Amplitude. But from any funnel step, you can jump directly into session replays of users who dropped off at that point and see exactly what happened.
Instead of theorizing about why 30% of users left at step 3, you watch five sessions and know within minutes. Was it a confusing form? A keyboard covering the submit button? An error message? You see it. No guessing required.
Crash and error diagnosis with visual playback
When a crash or UI freeze happens, UXCam doesn't just log it. Through issue analytics, it shows you the user's full visual journey leading up to the failure, including rage taps, hesitation, and the exact steps that triggered the problem.
Amplitude's session replay can capture JS console logs, network errors, and runtime errors, which is helpful for debugging. But UXCam's approach connects crash and error data to visual playback, heatmaps, and AI-powered analysis through Tara, giving teams a more complete picture of what went wrong and how to fix it.
Frustration detection that connects everywhere
UXCam automatically detects frustration signals like rage taps, unresponsive gestures, UI freezes, and crashes without any manual event setup. These are captured from the moment the SDK is installed and connected across heatmaps, funnels, issue analytics, and Tara.
Amplitude now detects frustration signals during session replay playback, which is a useful addition. But there's a difference between seeing frustration in an individual replay and having frustration data woven into your funnels, heatmaps, dashboards, and AI analysis. UXCam's approach means you can filter any report by frustration signals, not just spot them while watching recordings.
Autocapture that eliminates the instrumentation bottleneck
UXCam uses a single-SDK autocapture approach. Install once and it starts recording screens, gestures, events, and technical metrics automatically. You can retroactively define smart events on data that's already been captured. No code changes, no release cycles.
This fundamentally changes how fast teams can answer questions. With event-first tools, a new question often means new instrumentation. With UXCam, the data is already there.
One platform for mobile and web
Unlike tools that started on web and added mobile as an afterthought, UXCam was built mobile-first with native support for all major frameworks: iOS, Android, React Native, Flutter, Xamarin, Cordova, and more.
But UXCam is not mobile-only. The platform now includes full web analytics support, allowing teams to apply the same visual behavior approach across both platforms. This means one tool for session replays, funnels, heatmaps, and user journey analysis across mobile and web, instead of stitching together separate solutions.
How Tara changes what's possible with session analytics
This is where the comparison gets most interesting, and where UXCam pulls furthest ahead as an AI product analytics tool.
The AI gap between the two tools
Amplitude has invested significantly in AI. Their Amplitude AI suite includes Ask AI for natural language data queries, AI Agents for automated issue monitoring, AI Context for business-specific tuning, and newer capabilities like AI Visibility (showing how your brand appears in AI search results) and Amplitude MCP (querying Amplitude from external tools like Claude or Cursor).
These are genuinely useful capabilities. But they all share one fundamental limitation: they only work on structured event data. Amplitude's AI can summarize trends, surface anomalies, and help you query your metrics faster. It cannot watch what a user actually experienced.
Tara, UXCam's AI product analyst, works at a completely different level. She doesn't rely on metadata, event logs, or predefined tracking. She watches actual session recordings visually, the way a human analyst would. She identifies patterns, friction, confusion, and broken experiences that dashboards and logs can't detect.
This isn't a difference in degree. It's a difference in kind.
| Tara (UXCam) | Amplitude AI | |
|---|---|---|
| Data source | Visual session recordings with agentic vision analysis | Structured event logs and metadata |
| What it detects | Confusing UI states, non-responsive elements, hesitation, hidden buttons, broken flows, silent failures | Trends, anomalies, and patterns in predefined event data |
| Event dependency | None. Analyzes the untagged 95% of your app that events don't cover | Full dependency. Can only analyze instrumented events |
| Output | Explanation of why users behave a certain way, plus a concrete action plan with session evidence | Metric summaries, trend highlights, query assistance, and automated monitoring |
| Honesty | Trained to say "I don't have enough data" rather than guess | Standard AI response behavior |
| Best for | Understanding why something is happening and what to fix | Understanding what changed in your metrics and querying data faster |
What Tara actually does
Think of Tara as a product analyst who never sleeps. She continuously reviews session recordings, identifies usability issues, explains why they're happening, and recommends concrete next steps. Every insight is backed by direct links to the exact session evidence.
When your checkout funnel shows a drop-off, you can ask Tara: "Why are users dropping off during payment?"
She doesn't return a chart. She watches the relevant sessions, identifies the patterns — users hesitating after an unfamiliar error state, tapping disabled elements, scrolling back looking for reassurance — and returns an explanation with evidence and an action plan.
Every insight is tied to real session recordings you can verify yourself. If Tara doesn't have enough data, she says so and asks to review more sessions. She won't hallucinate answers, which is a known problem with AI tools that are designed to always give a response regardless of data quality.
Amplitude's Ask AI can help you query "what's the drop-off rate at step 3?" quickly. Tara can tell you why users are dropping off and what to fix first. That's the difference between a faster query tool and an AI product analyst.
How teams use Tara in practice
Drop-off diagnosis. Amplitude shows the drop-off number. Tara watches the sessions, identifies the friction, and tells you what to fix first.
Post-release validation. After shipping, ask Tara to analyze the first 50 sessions. She looks for confusion, broken expectations, and moments where the interface technically works but the experience feels wrong. She catches issues before they show up in your metrics.
Prioritization with evidence. Ask Tara what the most impactful problems are right now. She finds patterns across sessions: what happens often, what blocks users, what causes abandonment. She helps your team prioritize based on reality, not opinions.
Support ticket investigation. Paste a user ID into Tara and ask what happened. She reconstructs the visual experience, turning vague tickets like "it didn't work" into concrete, reproducible evidence.
Feature discovery. Ask Tara to summarize how users try to complete a task. She shows all the paths, including the ones you didn't design, revealing how users actually interpret your product.
The questions each tool can answer
This table maps real product questions to which tool can actually answer them. It's the practical test: when your team needs an answer, where do you go?
| Product question | Amplitude | UXCam |
|---|---|---|
| Where in the funnel are users dropping off? | ✅ Yes | ✅ Yes |
| Why are users dropping off at that step? | ❌ No. Shows the number, not the reason | ✅ Yes. Session replay and Tara show the visual experience |
| Are users confused by our new feature? | ❌ No. Only tracks if the feature was used | ✅ Yes. Watch sessions of users interacting with it |
| Is that button tap engagement or frustration? | ⚠️ Frustration signals available in replay playback, but not across analytics | ✅ Yes. Rage taps and unresponsive gestures detected automatically and connected across all features |
| What error messages are users seeing? | ⚠️ Only if errors are instrumented as events, or visible in replay | ✅ Yes. Tara visually identifies error messages even without events |
| What happened before this user's crash? | ⚠️ Event logs plus console/network errors in replay | ✅ Yes. Visual playback with full gesture and interaction context |
| How do users actually navigate our app? | ⚠️ Limited to instrumented screen events | ✅ Yes. Full screen flow visualization with autocapture |
| What should we fix first? | ❌ No. Shows metrics, not prioritized action plans | ✅ Yes. Tara identifies impact patterns and recommends next steps |
| What did this specific user experience? | ⚠️ Event timeline plus replay on supported platforms | ✅ Yes. Full session replay natively connected to all analytics |
| Where are users tapping on my mobile screens? | ❌ No. Heatmaps are web-only | ✅ Yes. Native mobile heatmaps across all supported frameworks |
| Are there UX issues we don't know about? | ❌ No. Only sees what's been instrumented | ✅ Yes. Autocapture and Tara find the "unknown unknowns" |
Setup, cost, and team access compared
Beyond features, Amplitude and UXCam create very different realities for how your team works day to day.
| Time to Value | UXCam | Amplitude |
|---|---|---|
| Initial setup | Install one SDK. Autocapture starts immediately | Plan event schema, implement events, ship, wait for data |
| Time to first insight | Same day. Watch your first session replay within hours | Weeks to months depending on instrumentation scope |
| Full implementation | Days to weeks | Can take 6 months to a year for enterprise teams |
| Answering a new question | Retroactive. Use smart events or ask Tara on existing data | New instrumentation, engineering, release, data accumulation |
| Adapting to product changes | Automatic. Autocapture adjusts as screens change | Manual. Event schema must be updated with each product change |
Who can use the tool
| UXCam | Amplitude | |
|---|---|---|
| Product managers | ✅ Direct use with session replay, Tara, dashboards | ⚠️ Often needs analyst support for complex queries |
| Designers | ✅ Heatmaps and session replay for UX validation | ⚠️ Heatmaps web-only; limited visual UX context on mobile |
| Engineers / QA | ✅ Issue analytics with visual crash playback | ⚠️ Console logs and error capture in replay; log-based debugging |
| Customer success | ✅ Look up any user's session to understand their experience | ⚠️ Event timelines plus replay on supported platforms |
| Data / analytics teams | ✅ Funnels, retention, segmentation, dashboards | ✅ Deep cohort analysis, statistical features, governance |
| Training required | Low. Visual tools are self-explanatory | Moderate to high. Query builder and event taxonomy require learning |
Pricing realities
Amplitude's pricing model is usage-based, primarily tied to Monthly Tracked Users (MTUs) and event volume.
The Starter (free) tier includes up to 50,000 MTUs and 10 million events processed per month, which is generous for smaller teams getting started. The Plus plan starts at $49/month (billed annually) and covers between 1,000 and 300,000 MTUs with essential features like feature flags and online support. Growth and Enterprise tiers are custom-priced, intended for larger volumes and advanced needs like data governance and predictive analytics.
Critical features are gated behind higher tiers. Advanced behavioral cohorts, data governance, deeper analysis capabilities, and heatmaps all require Growth or Enterprise pricing to access. Teams frequently upgrade not because they're getting more value, but because they've hit the restrictions of their current plan.
There's also a hidden cost: event maintenance. As events accumulate, teams need to clean up deprecated events, maintain taxonomy, and manage instrumentation across releases. And because pricing scales with MTUs and event volume, costs can grow unpredictably as your product usage increases.
UXCam's pricing model is session-based, not event-based. This creates more predictable costs that don't spike every time you add a new interaction to track.
UXCam offers a free plan with 3,000 monthly sessions including limited access to session replay, filters, and data retention, with no credit card required. Paid plans (Starter, Growth, Enterprise) scale based on session volume and feature access, with no hidden costs tied to event volume growth.
Because autocapture records everything by default, there's no "instrumentation tax." You don't pay more just because you want to track more behaviors.
| UXCam | Amplitude | |
|---|---|---|
| Pricing basis | Session volume | MTUs and event volume |
| Free tier | 3,000 sessions/month, no credit card | 50,000 MTUs, 10M events/month |
| Paid starting price | Custom (Starter plan) | $49/month (Plus plan, billed annually) |
| Cost predictability | High. Session counts are stable and predictable | Lower. Costs grow with MTU count and event volume |
| Hidden costs | None. Autocapture included in all plans | Event maintenance, re-instrumentation engineering time, training |
When Amplitude alone is sufficient
To be fair, there are scenarios where Amplitude is the right standalone choice:
Stable products with well-known flows. If your app hasn't changed significantly in months and your event tracking is mature, Amplitude delivers reliable quantitative measurement of known behaviors.
Dedicated analytics teams. If you have data analysts or scientists who build and maintain event schemas, Amplitude's depth in cohort analysis and statistical rigor is hard to match.
Metrics-first culture. If your team makes decisions primarily based on KPIs, retention curves, and growth metrics, and you have a separate process for qualitative research, Amplitude serves that workflow well.
Cross-platform event unification. If your primary need is a single quantitative view of user actions across web, mobile, and backend systems, Amplitude's event unification is a strength.
AI-assisted metric exploration. If your team primarily needs faster access to quantitative answers (what changed, when, by how much), Amplitude's Ask AI and AI Agents can speed up the analytics workflow within their event data model.
When UXCam alone makes sense
UXCam works as a powerful standalone AI product analytics platform, particularly for teams that need to understand how users actually experience their product.
Mobile-first teams. UXCam was built for mobile from day one with native support for iOS, Android, React Native, Flutter, Xamarin, and Cordova. Gesture capture, screen-level analysis, mobile heatmaps, and mobile issue detection are core to the platform, not afterthoughts.
Cross-platform teams that need both mobile and web. UXCam supports web analytics alongside mobile, giving teams a single tool for visual behavior analysis across platforms. No need for separate session replay tools for web and mobile.
Fast-iterating products. When screens and flows change frequently, event schemas become a maintenance burden. UXCam's autocapture adapts automatically.
Product and design-led teams. If your decisions are driven by understanding user experience rather than statistical event trends, UXCam gives you direct visibility into friction, confusion, and broken flows through session replays, heatmaps, and Tara.
Teams without dedicated data analysts. UXCam is built for product managers, designers, and engineers to use directly. Ask Tara a question, watch a session, look at a heatmap. The insight is visual and immediate.
Teams that need answers today. Because UXCam captures data from the moment the SDK is installed, you can answer questions on day one. No waiting months for instrumentation to mature.
How teams use UXCam and Amplitude together
Many teams use both tools. The pattern is consistent: Amplitude surfaces the trend, UXCam explains the behavior behind it.
The typical workflow
Step 1: Amplitude flags a change. A funnel drop-off increases. Retention drops for a cohort. A feature's usage pattern shifts unexpectedly.
Step 2: UXCam provides the visual explanation. The team switches to UXCam, filters sessions by the relevant segment or flow, and watches what users actually experienced.
Step 3: Tara accelerates the investigation. Instead of manually reviewing dozens of sessions, the team asks Tara to analyze the relevant sessions and explain what she found. She returns patterns, evidence, and recommended actions.
Step 4: Evidence drives the decision. Instead of debating hypotheses, the team shares session replay clips or Tara's analysis in sprint planning, turning speculation into validated evidence.
The integration
UXCam integrates directly with Amplitude. Once connected, UXCam session replay URLs are pushed into Amplitude, making it easy to jump from an Amplitude event or user profile directly into the UXCam session where that event occurred.
This means Amplitude users can go from "this user dropped off at step 3" to watching exactly what that user experienced, in a single click.
Why Amplitude customers add UXCam
The most common reason: Amplitude shows them what changed, but they can't explain why.
Funnel drop-offs with no explanation. Retention shifts they can't diagnose. Feature engagement numbers that don't tell them if users are succeeding or struggling. Crash reports without enough context for reproduction.
Amplitude's AI can help surface these trends faster, and replay can provide some visual context. But when teams need to understand the full picture — especially on mobile, across all frameworks, with gesture-level detail and AI that watches actual user behavior — UXCam fills the gaps that Amplitude's event-first architecture can't reach.
Make insight-driven product decisions
Amplitude and UXCam solve different problems. The question isn't which tool has more features. It's which insight gap is costing you more.
If your biggest challenge is measuring known behaviors at scale with statistical rigor, Amplitude serves that well. If you also need faster access to quantitative answers, their AI suite can help.
If your challenge is understanding why users behave the way they do — why they drop off, where they get confused, what they experience before they churn, and what to fix first — then UXCam is the stronger choice. Especially for mobile, where event-based analytics leaves the most gaps.
And if you're looking for a single AI-powered product analytics platform that gives you both the metrics and the behavioral context, UXCam delivers that: quantitative analytics, session replays, heatmaps, issue detection, and Tara — an AI product analyst who watches sessions for you and tells you what to do next.
Many teams use both. Some use UXCam alone. The ones who struggle most are the ones relying on event data alone and wondering why they can't explain what's happening in their product.
Ready to see what your users actually experience? Start a free UXCam trial or get a demo to see how it works with your own product.
Related articles


Related articles


Tool Comparisons
Top 10 Smartlook Alternatives for Product Teams in 2026
Discover the best Smartlook alternatives for valuable product and UX insights. Explore four powerful tools to enhance app user experience and...


Jonas Kurzweg
Product Analytics Expert


Tool Comparisons
Smartlook vs UXCam: Which is the better mobile app analytics solution for modern teams?
Detailed comparison of Smartlook and UXCam for React Native, Flutter, iOS, and Android apps. See SDK differences, session replay quality, and why UXCam is the stronger choice for mobile...

Begüm Aykut
Growth Marketing Manager
Tool Comparisons
UXCam vs Amplitude: A real comparison for mobile product analytics
Compare UXCam and Amplitude for mobile product analytics. See where event-based metrics work, where they fall short, and how UXCam's AI-powered product analytics platform reveals what's actually happening in your...
Begüm Aykut
Growth Marketing Manager