Behavioral Cohort Analysis - How To Use Them to Improve UX


Retaining users over the long term has always been a recurring issue among mobile app development teams. Data shows that more than 90% of users typically abandon an app before the 30-day mark—not ideal if you’re looking for long-term success.
In the pursuit of sustained success, developers are turning to sophisticated tools and methodologies to gain insights into user behavior and preferences. One of these tools is behavioral cohort analysis.
In this UXCam guide, we’re demystifying this powerful technique and detailing how it can help you improve your app’s user retention rates.
Let’s dive in.
Helpful summary
Overview: The article discusses leveraging behavioral cohort analysis with UXCam to enhance user retention.
Why you can trust us: We’ve helped 37,000+ mobile product teams optimize their user experience and retention strategies with data.
Why it matters: Behavioral cohort analysis improves retention efforts, enables detailed behavioral tracking, facilitates predictive analysis, and informs product development.
Action points: We suggest identifying key user behaviors, personalizing the user experience, optimizing the onboarding process, conducting A/B testing, improving app performance, and re-engaging dormant users as strategies to use behavioral cohort analysis.
Further research: Check out our other guides on cohort analysis to see how it can benefit your specific product and user base.
What is behavioral cohort analysis?
Behavioral cohort analysis is an analytical technique that involves creating and analyzing cohorts that share similar behavioral characteristics.
A cohort is a group of users who have completed a specific action or have the same set of attributes within a defined time period (e.g., “users who signed up in January”). A behavioral cohort is only focused on the actions and behavior of a user—not attributes like age, gender, location, etc.
Here’s an example of a behavioral cohort analysis done using UXCam.
SuperEats, a food delivery app, aimed to improve customer loyalty by analyzing user retention data through cohort analysis. Despite offering a 50% discount on initial orders, user retention dropped after the promotional period.


A retention table tracking user engagement over 90 days revealed key insights—a significant decline in user retention from week 0 to week 4. In other words, the benefits associated with the discount were not enough to retain users past 4 weeks.
To address this, SuperEats offered points and rewards for every order to maintain user engagement past the 4-week mark.
Benefits of behavioral cohort analysis in user retention
Improves retention efforts
Cohort analysis helps assess retention strategies by tracking how well user groups are retained over time. It helps identify successful strategies and make data-driven decisions to improve retention efforts.
Enables detailed behavioral tracking
Behavioral cohort analysis lets you compare user behaviors over time, revealing long-term trends. By grouping users into categories based on how they were acquired or their behavior, businesses can find patterns or product changes that affect user retention.
Informs product development
Analyzing user engagement with new features helps businesses understand the impact of product changes on retention and engagement. This guides product development and feature optimization.
How to do behavioral cohort analysis with UXCam
Identify key user behaviors
Set up experiments
Save cohorts
Analyze cohorts
Step 1 - Identify key user behaviors
The first step is to identify the user behaviors that you want to analyze. There’s no “right” way to go about this—but we recommend using UXCam’s wide range of analytics tools to identify interesting trends and patterns.


These include:
Event analytics: Track feature usage, interactions, and other custom events to understand how users are engaging with your product.
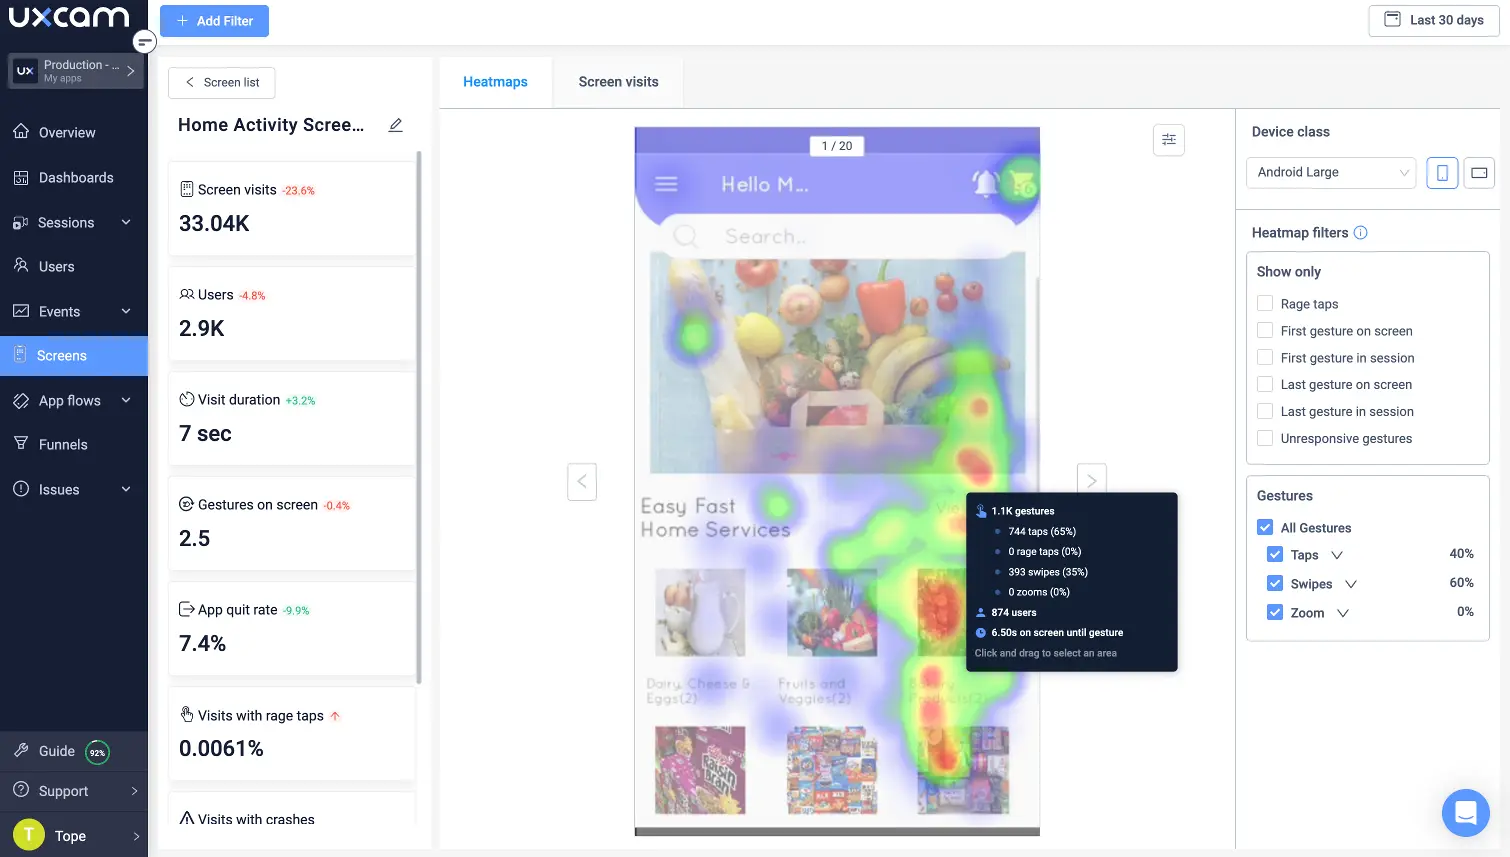
Heatmaps: Visualize where users click, tap, scroll, and navigate on your app or website to identify areas of interest or confusion.
Session replays: Watch real user sessions to see exactly how they interact with your product.
When we say patterns, what you’re looking for is an interesting behavior that you have a hunch is linked to some outcome—positive or negative.
For example, are users that engage with your new feature weekly more likely to become long-term users? In this case, the behavior (engaging with the feature) will be our start action, and the outcome we think it may be linked to (coming back to the app) will be the return action.
Step 2 - Set up experiments
Once you have identified potential patterns and behaviors, it's time to set up experiments to test your hypothesis.
With UXCam’s Retention Analysis feature, this is easy.
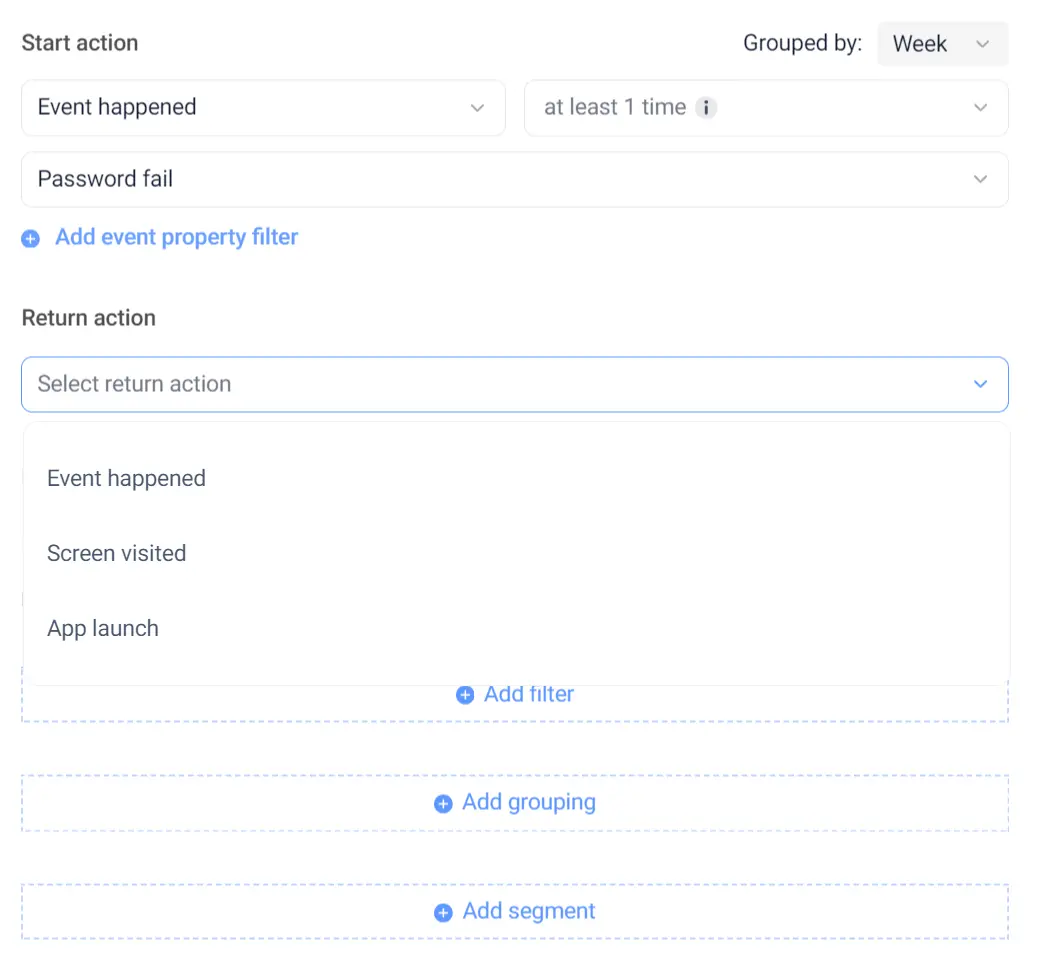
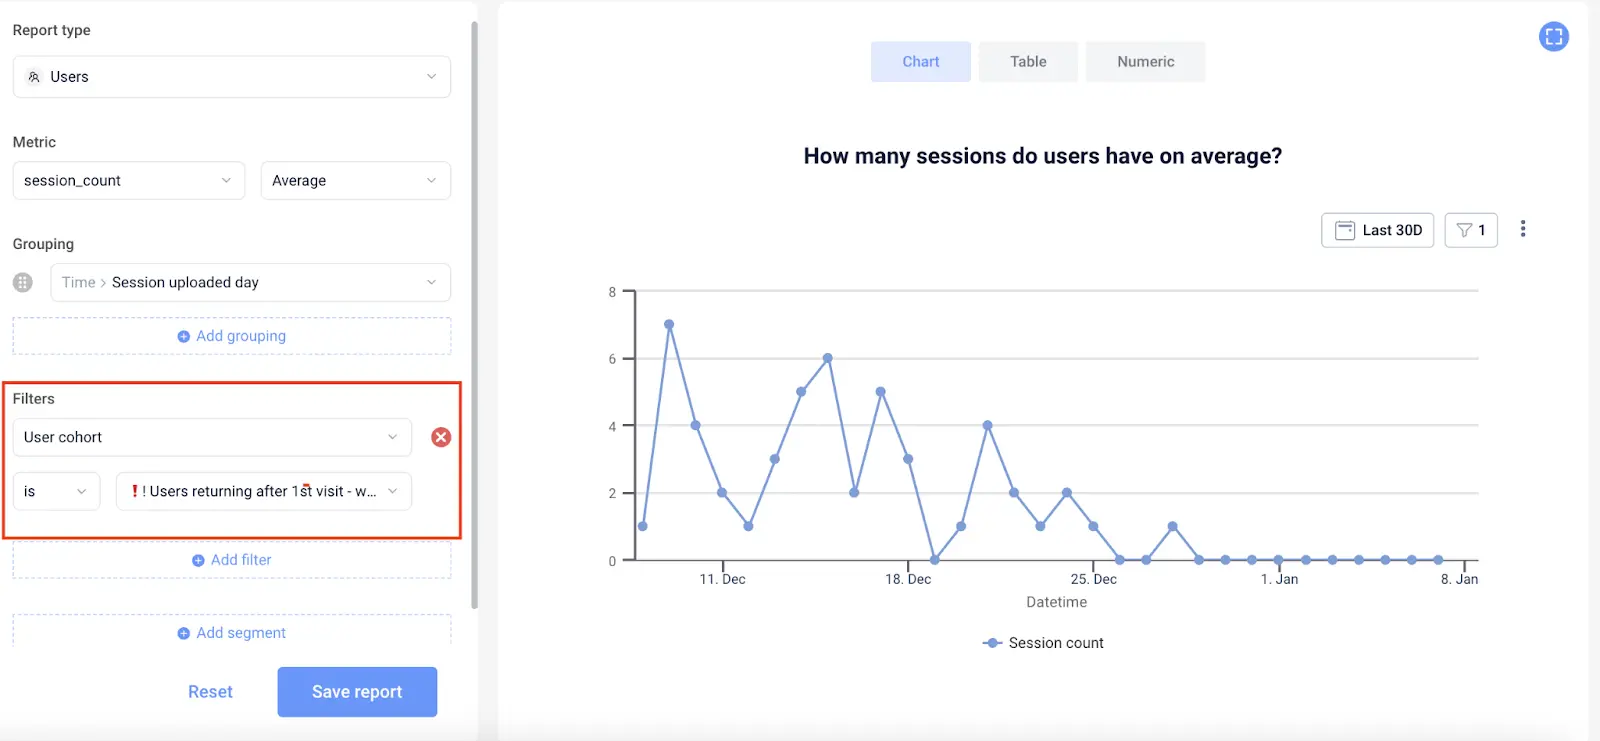
Just open it up and, in the report builder, enter the behavior you want to analyze as the “Start action”. You have plenty of options to choose from, since UXCam’s Smart Events can track any actions and behaviors that happen in your app—no coding required.


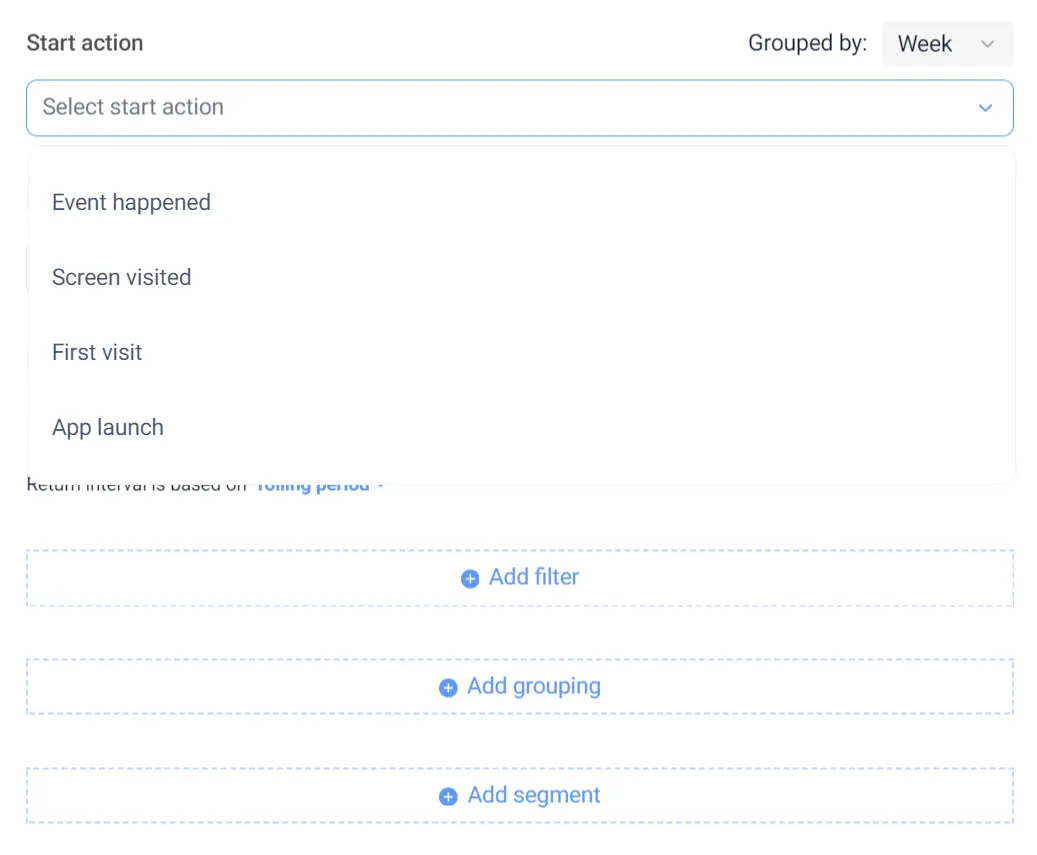
Then specify a “Return action” to measure how many users who exhibited the start behavior also completed the return action.


You can also add filters, groups, and segments to get more specific results.
Step 3 - Save cohorts
UXCam will now generate a chart and table with your retention analysis results. The chart will show the percentage of users who completed the return action after performing the start action, broken into weekly cohorts.
Each cell in the table represents a cohort.


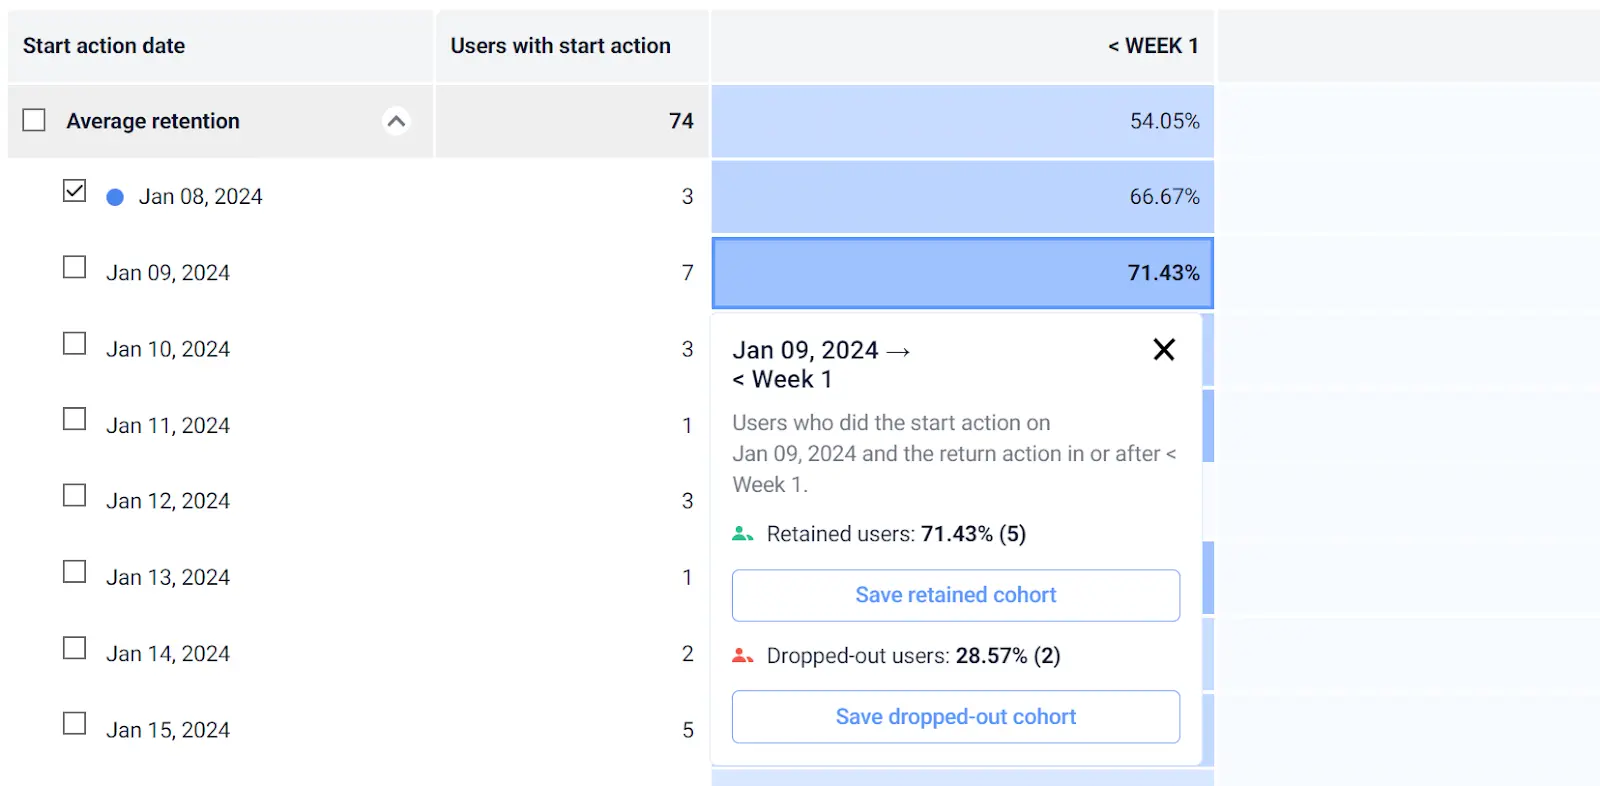
Clicking on a cell opens up a menu where you can easily save either the retained cohort or the dropped-out cohort.
Any cohorts you save can be analyzed to uncover deeper insights into their behavior.
Step 4 - Analyze cohorts
Now, head over to the “Manage Cohorts” screen to see all the cohorts you’ve saved.


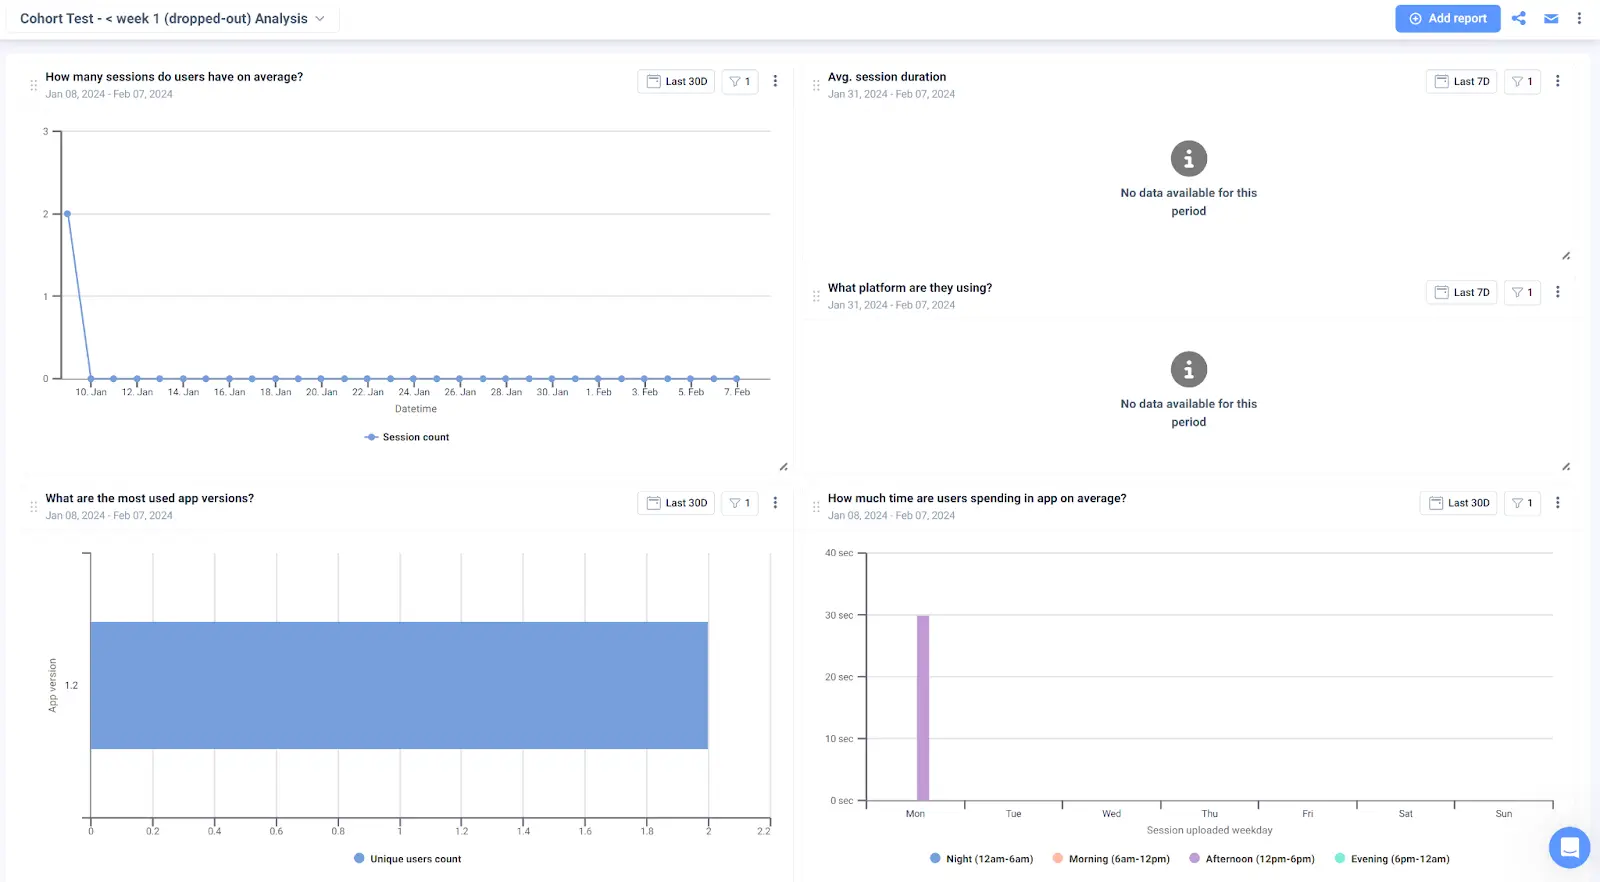
From here, you can click the “Analyze Cohorts” button to dive deeper into the behavior of specific cohorts. This will bring up a new screen where you can choose which reports you’re interested in—UXCam will automatically populate a dashboard with data on screens visited, rage taps, usage data, and more.
You can also apply saved cohorts to other UXCam features for deeper insights—more on that in a moment.
Use cases for behavioral cohort analysis
1. Optimize your onboarding flow
The initial interactions a user has with an app significantly influence their likelihood of continued usage. Cohort analysis can refine the onboarding process, ensuring that new users quickly find value in the app.


You can use UXCam's funnel feature to capture each stage in your onboarding process. By filtering funnels using saved cohorts, teams can investigate user behavior further.


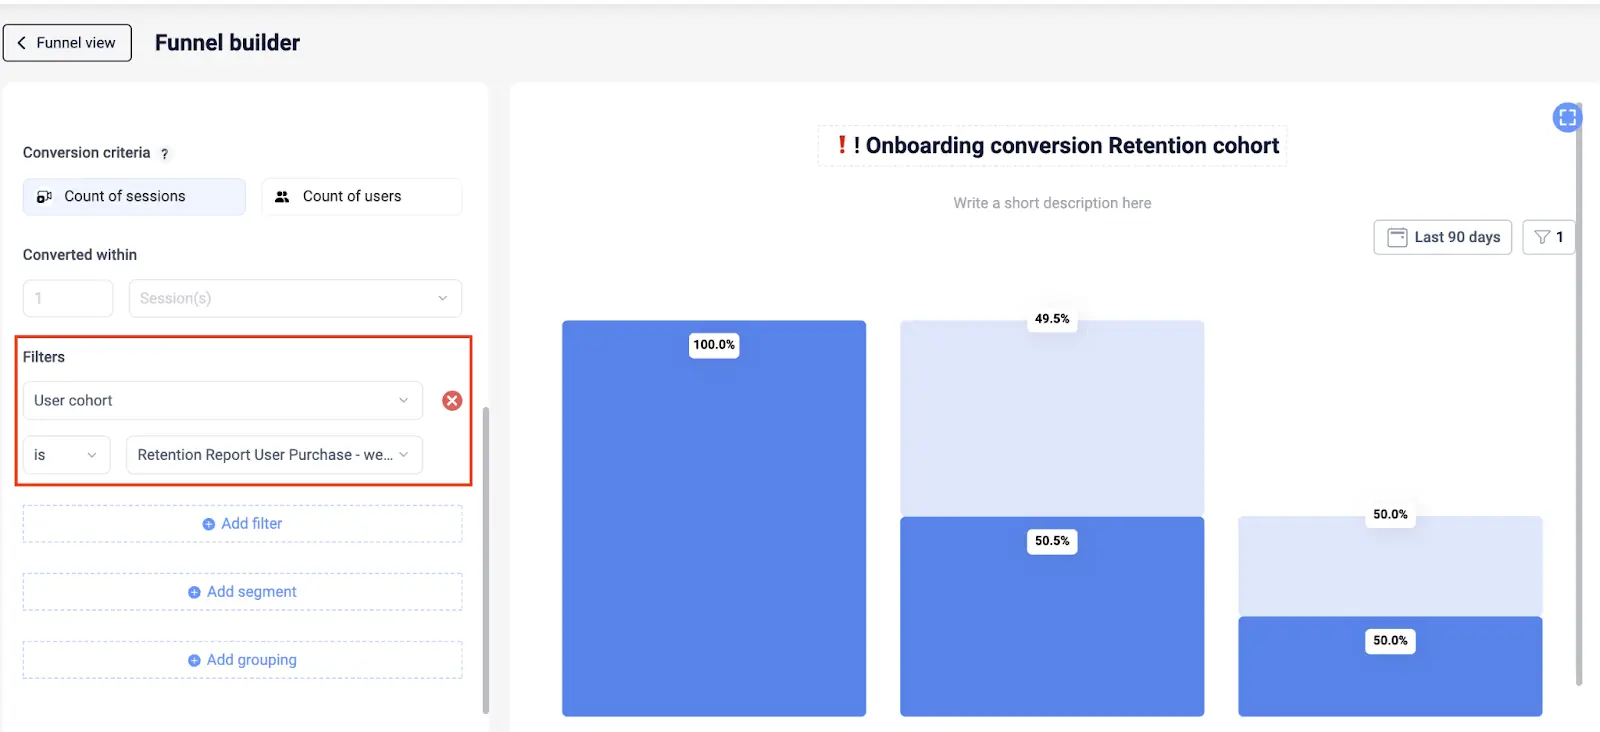
For example, filtering funnels by saved retained cohorts helps understand whether users who complete the onboarding flow exhibit better retention.
2. A/B testing
Cohort analysis serves as a robust foundation for A/B testing, allowing teams to measure the impact of different app features or designs on user retention.


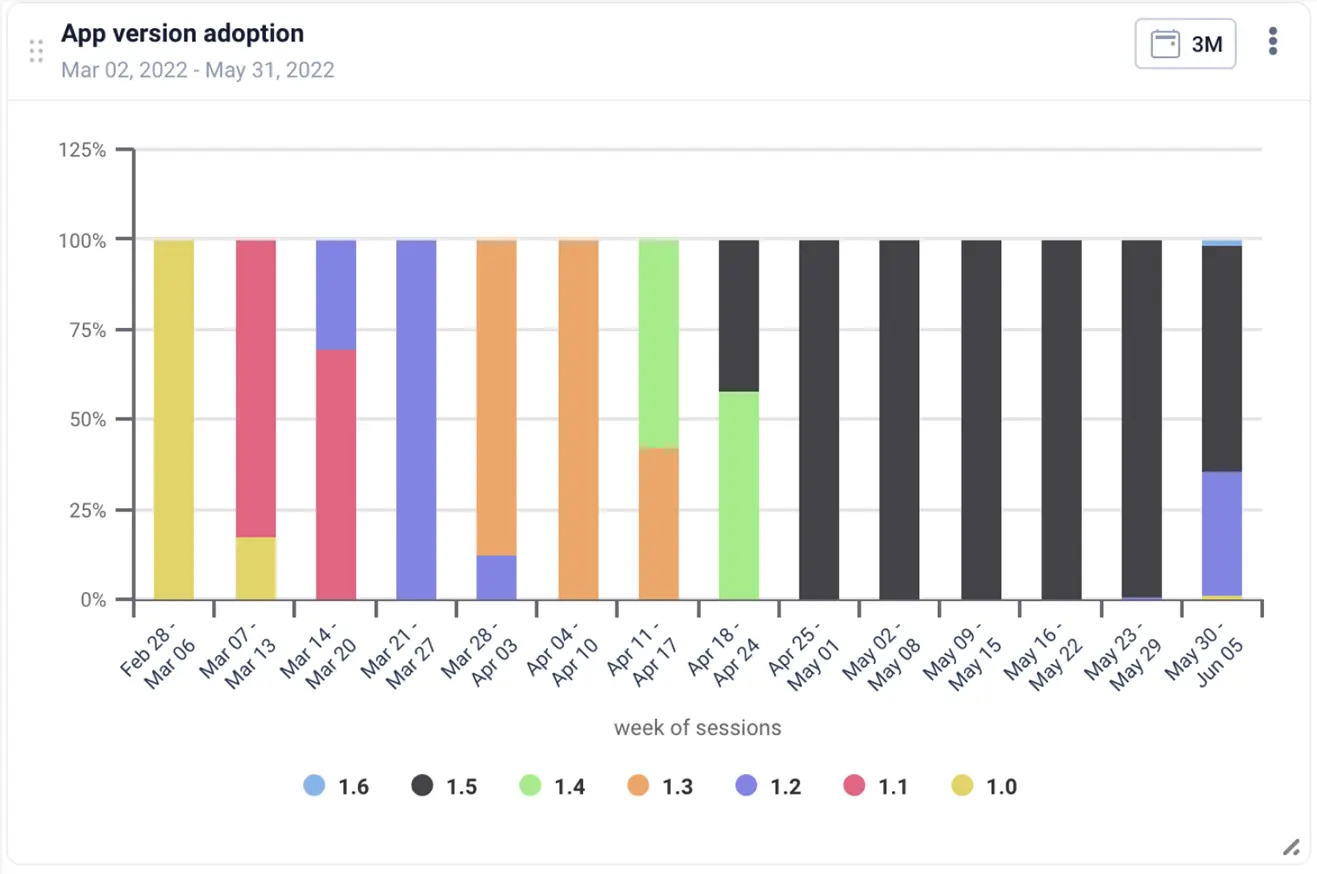
UXCam facilitates A/B test analysis by segmenting users according to the app version they use, providing important insights for data-driven decision-making.
Comparing how similar cohorts respond to different versions of the app empowers teams to roll out features with confidence, backed by tangible data on their impact on user retention.
3. Improve app performance
If cohort analysis reveals issues like crashes or slow load times leading to user abandonment, addressing these technical issues becomes imperative.


UXCam's issue analytics feature aids in identifying such technical glitches, ensuring that app performance is optimized for improved user retention.
Conclusion
The goal of leveraging behavioral cohort analysis is to use the insights gained to create a more engaging and valuable experience for users. By adopting these practical strategies, mobile app development teams can enhance user retention, leading to sustained success in an increasingly competitive landscape.
Sign up for free to unlock the power of behavioral cohort analysis with UXCam and take your user retention strategies to new heights.
You might also be interested in these;
5 Best behavioral analytics tools & software for mobile apps
User Stories vs. Use Cases: A comprehensive guide
How to conduct effective customer retention analysis
What is churn rate and how do we calculate it?
AUTHOR
Tope Longe
Product Analytics Expert
Ardent technophile exploring the world of mobile app product management at UXCam.


Related articles


Mobile app analytics
12 Mobile App Analytics Metrics That Actually Matter in 2026
Mobile app analytics metrics are the quantitative signals product teams use to measure performance, engagement, and...


Silvanus Alt, PhD
Founder & CEO | UXCam


Mobile app analytics
Mobile App Retention Benchmarks by Industry (2026)
Mobile app retention benchmarks for 2026, broken down by industry. Day-1, day-7, day-30 retention rates for fintech, ecommerce, social, gaming, and more,...
Silvanus Alt, PhD
Founder & CEO | UXCam


Mobile app analytics
Sentry vs Datadog: Features, Pricing, and Which One Fits Your Production Stack
Sentry vs Datadog compared head-to-head on features, pricing, and the production stacks each one...
Silvanus Alt, PhD
Founder & CEO | UXCam