6 Best Error Monitoring Software Tools To Analyze App Crashes
Staying ahead of application errors, crashes, and other performance issues is vital to delivering a great user experience. About 88% of users are unlikely to return to your app or website due to a poor experience.
With a high churn rate, your sales and app traffic will dip. Instead, you can employ error monitoring software and tools to track app crashes and get detailed insights into the causes, possible consequences, and solutions.
What are the best error monitoring tools for mobile apps?
The six best error monitoring tools and software for product and engineering teams are UXCam, Bugsnag, Raygun, Rollbar, Sentry, and Firebase Crashlytics.
This article will guide you through the features and capabilities of these tools, including their benefits, ratings, pricing, and more.
Best error monitoring software
| Tool | Best for |
|---|---|
| UXCam | Understanding the "why" behind app crashes and issues on mobile apps. |
| Bugsnag | Bugsnag |
| Raygun | Real-time error monitoring and crash reporting. |
| Rollbar | Continuous code improvement with proactive error detection. |
| Sentry | Real-time error tracking with detailed stack traces. |
| Firebase Crashlytics | Lightweight crash reporting integrated within the Firebase platform |
UXCam
G2 User Rating: 4.7/5
Ideal for: Understanding the "why" behind app crashes and issues on mobile apps
Pricing: Free plan/ Contact support for pricing for the Starter, Growth, and Enterprise plans
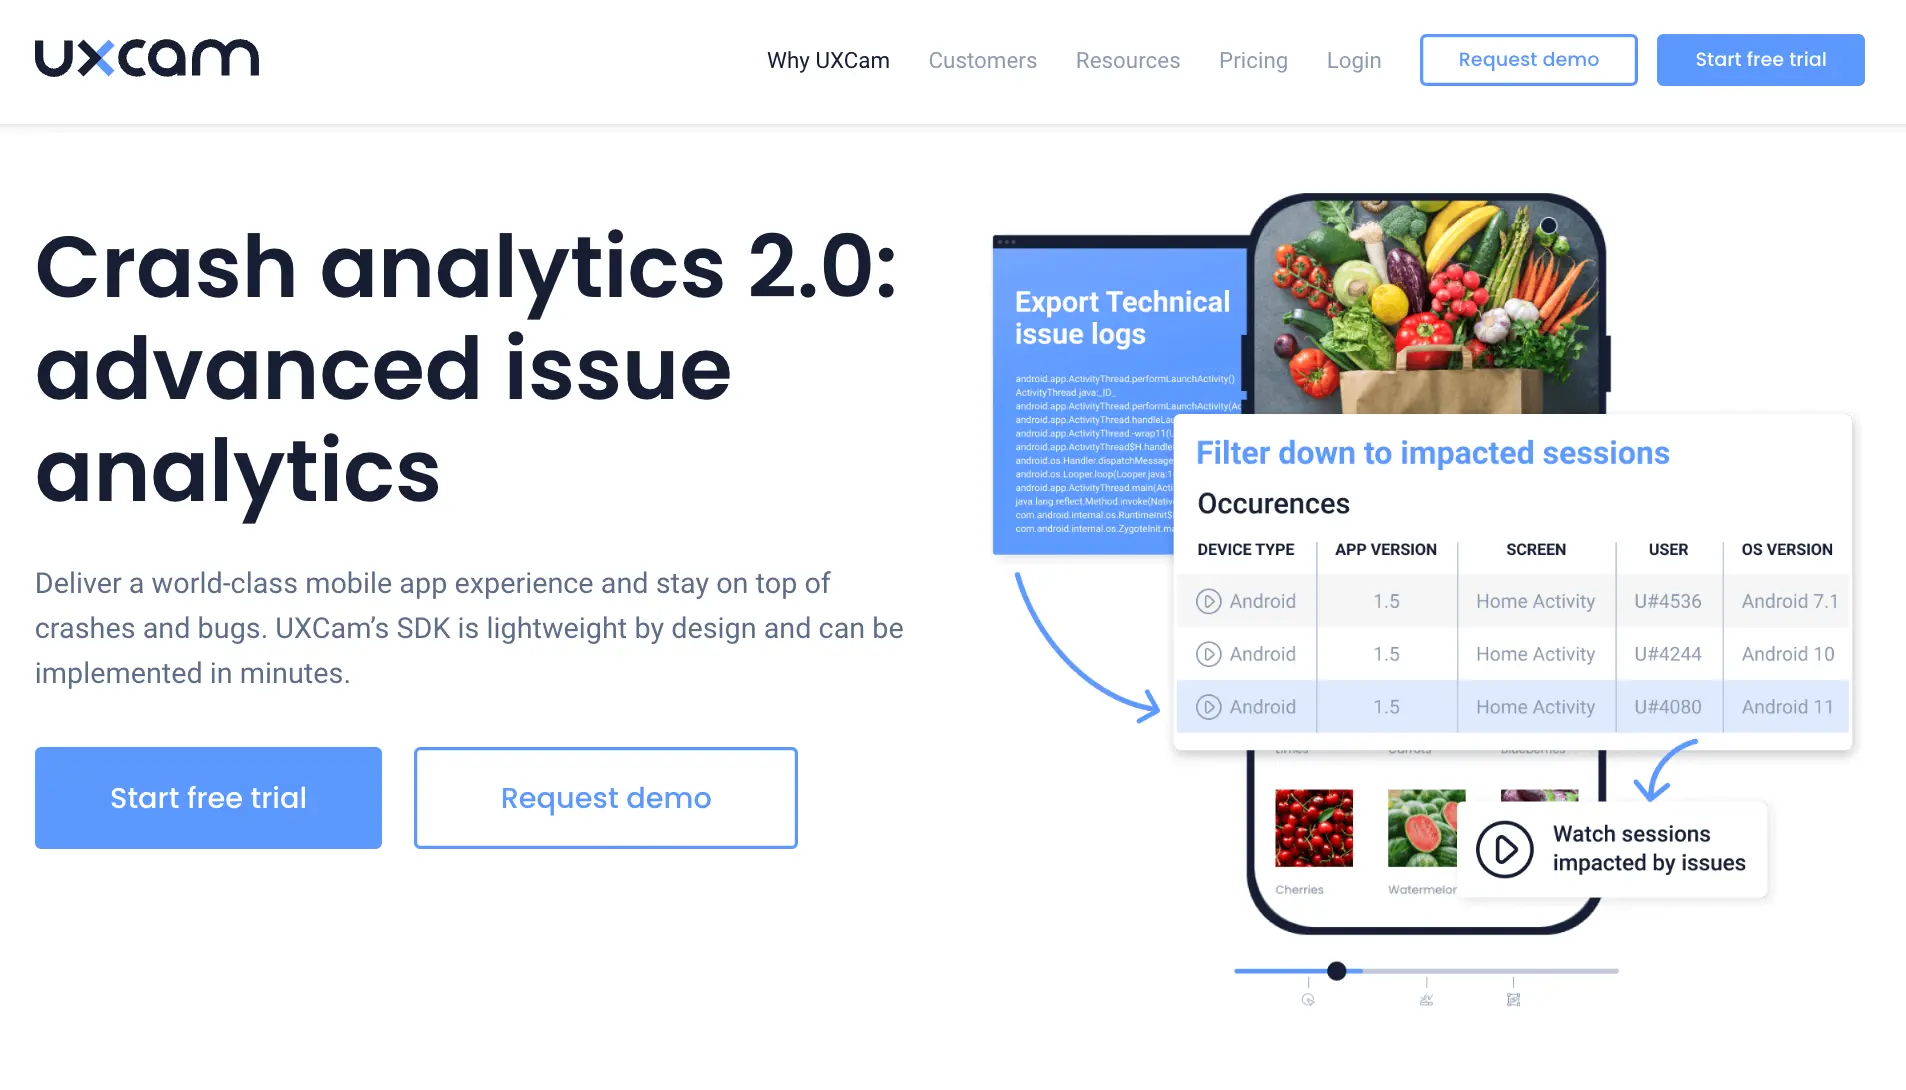
UXCam is a leader in mobile app issue monitoring analytics. It captures every micro-interaction in your app to deliver actionable data reports. The tool offers powerful features to help teams use contextual insights to refine app performance and experience.
Whether you’re a product or engineering team, UXCam provides better context on every issue, allowing you to get to the root cause behind bugs, UI freezes and crashes. You get detailed issue reports and can easily collaborate with stakeholders to ensure app performance and stability. UXCam comes highly recommended for mobile app error monitoring as it works on the common all native and non-native mobile app development including iOS, Android, Flutter, React Native, Xamarin, Cordova, and Unity.
Features
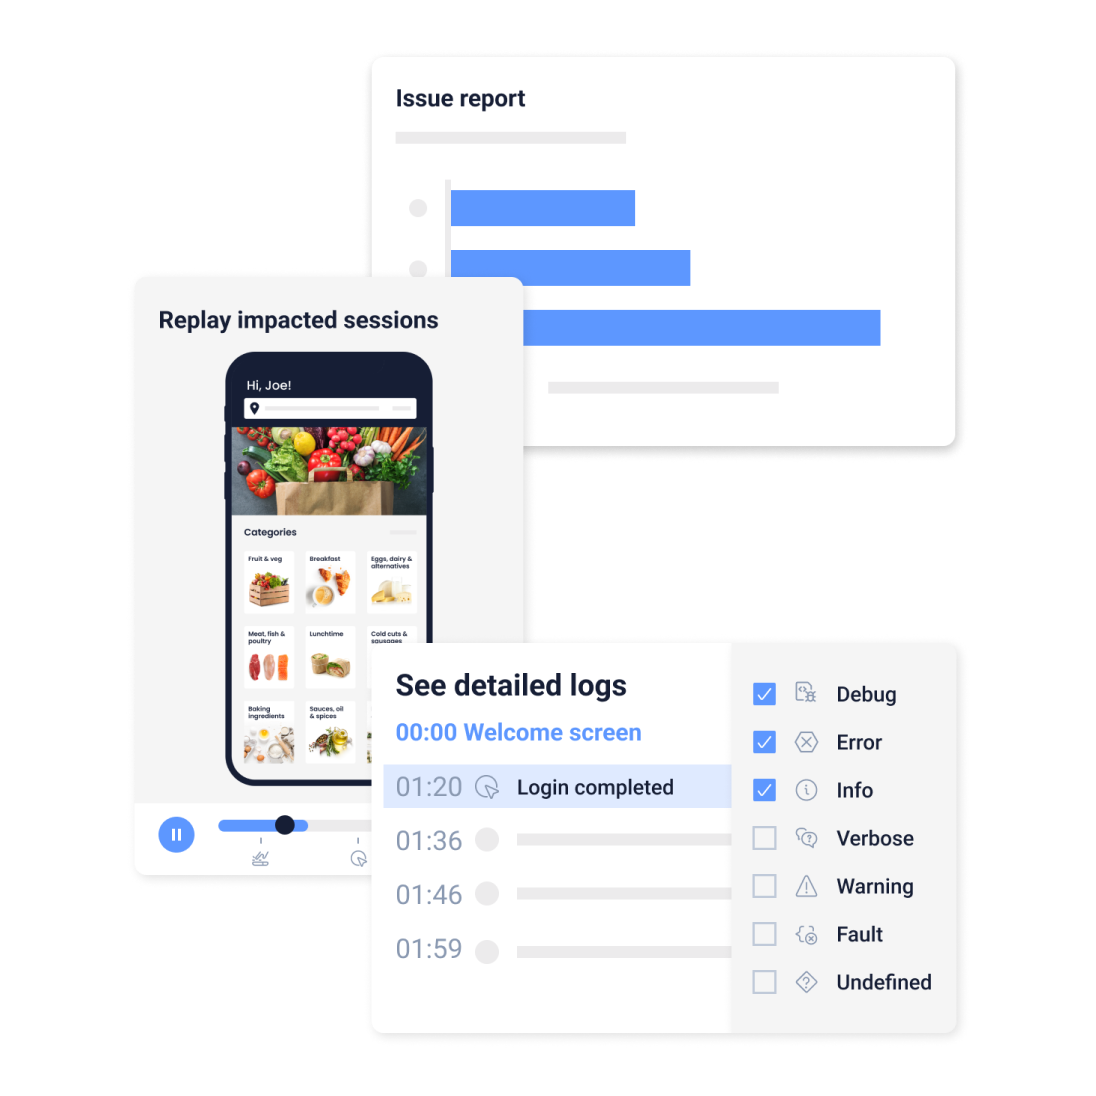
Issue Analytics: You can track and fix technical issues in real-time before they impact your user experience. With Issue Analytics, you get access to crash and UI freeze reports, and you can export the logs for detailed analysis. Plus, you get data on users and sessions impacted by technical issues.

Session Tagging: When reviewing multiple sessions for technical issues, you can easily tag them to identify sessions with similar problems. This way, you can always return to the tagged user sessions for further investigation. You can also use the “viewed session” tag to mark sessions that have been investigated.
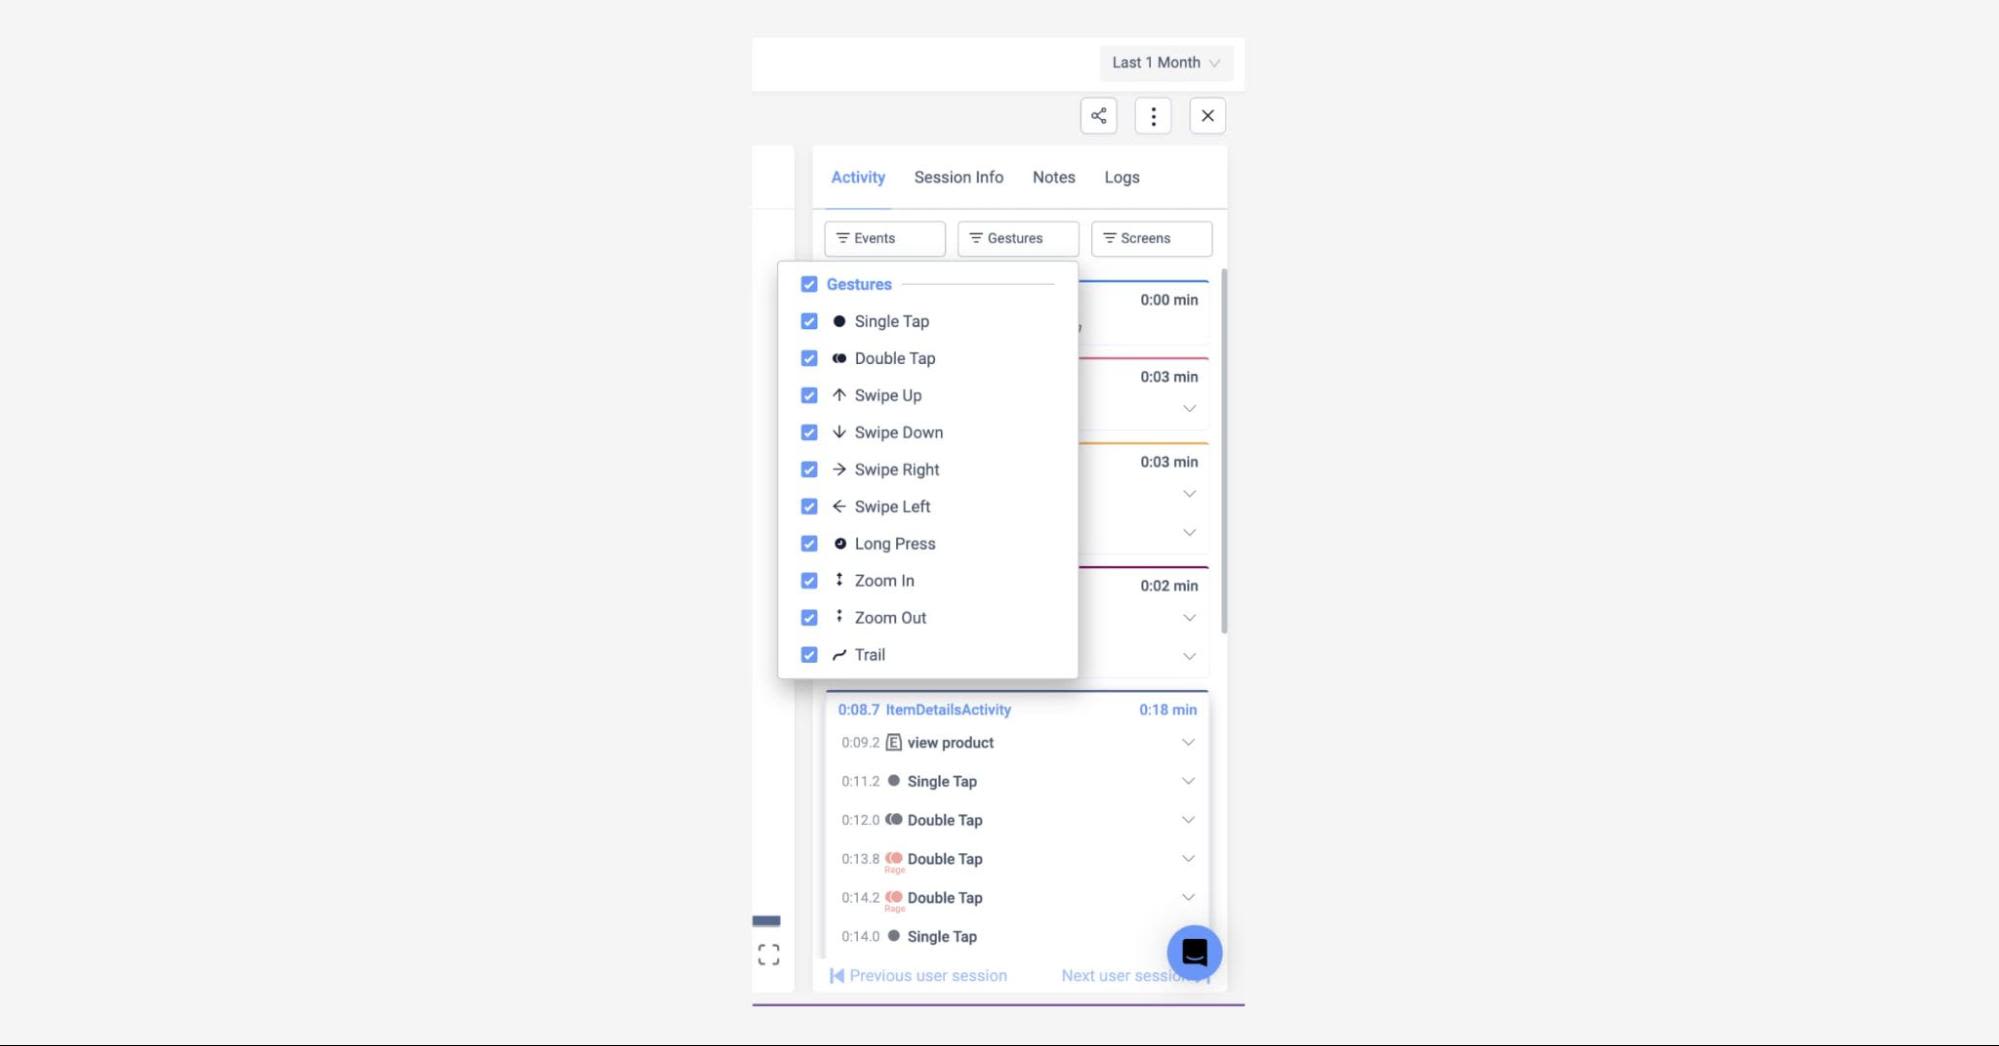

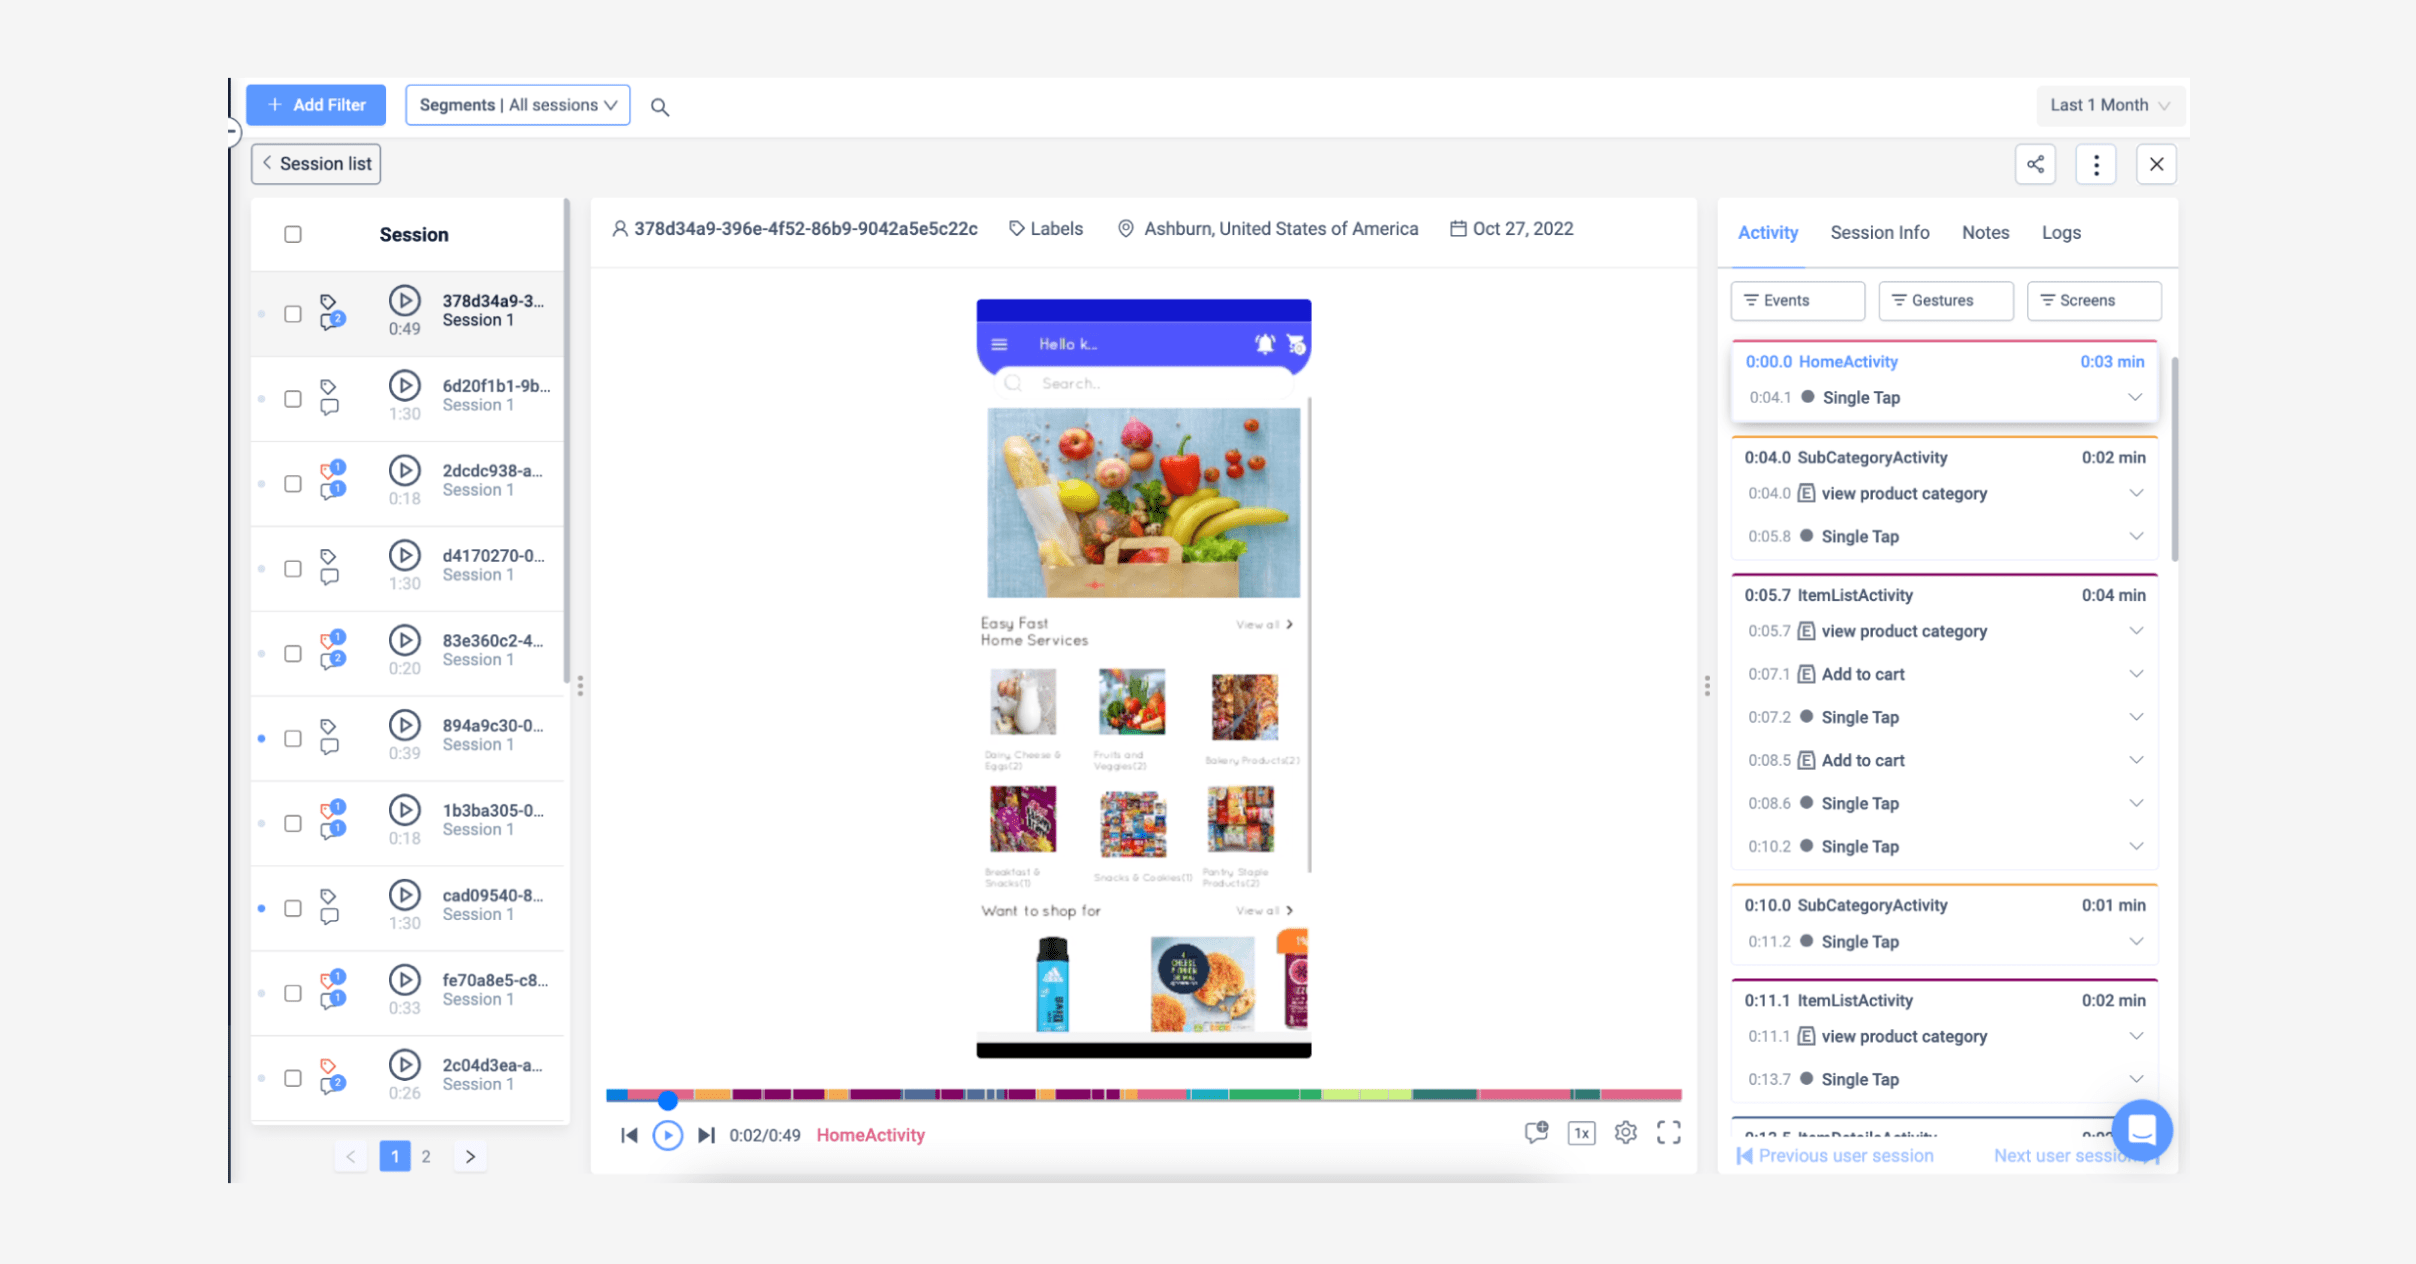
Session Replay: How did a crash occur? What really happened during the event? With session replay, you get a complete picture of crashes and other technical issues. The feature allows you to record all sessions, which you can replay and analyze to understand the causes of crashes.

Screen Flow Analytics: With Screen Flow, you can visualize users' movement on your app. This helps you identify their drop-off points and determine if the drop-offs resulted from technical issues. You can use reverse flow to identify all points where users drop off or get stuck.


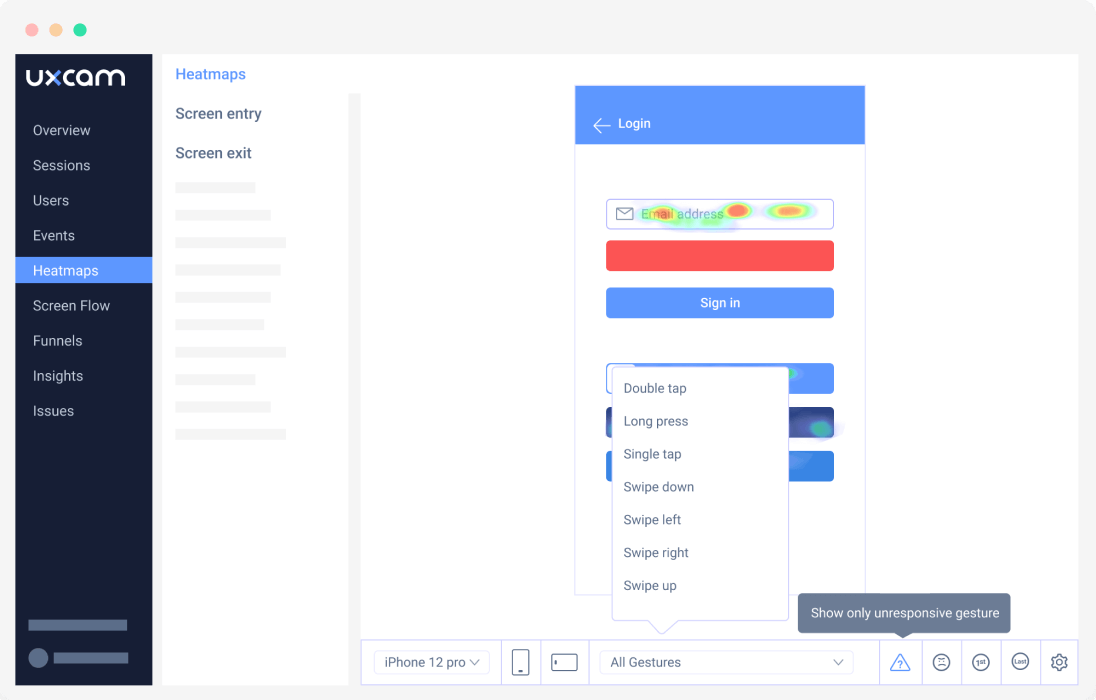
Screen Heatmaps: UXCam's detailed screen heatmaps help you review the screens where UI freezes occurred, enabling you to quickly identify and report handled exceptions.

Pros
UXCam offers the Issue Analytics feature, which provides in-depth visibility into crashes and UI freezes. You can use custom events to find correlations between crashes and events. More importantly, you can rewatch how users experienced UI freezes and crashes to determine the ideal fixes.
Cons
The tool doesn’t list the pricing for the different plans -- you’ll need to contact support to get this information. The free plan offers limited session recordings; you’ll need to upgrade your plan. Some users say they prefer to pay monthly instead of the 1-year contract.
You shouldn’t allow app crashes and UI freezes to impact your user experience and increase your churn rate. The best mobile product and engineering teams deploy UXCam to monitor their mobile app, identify errors, get better insights, and resolve issues quickly.
You can request a demo to see how UXCam works if you have any questions.
Bugsnag
G2 User Rating: 4.3/5
Ideal for: Mobile apps only
Pricing: Free plan / Standard: $76/month; Enterprise; Contact support
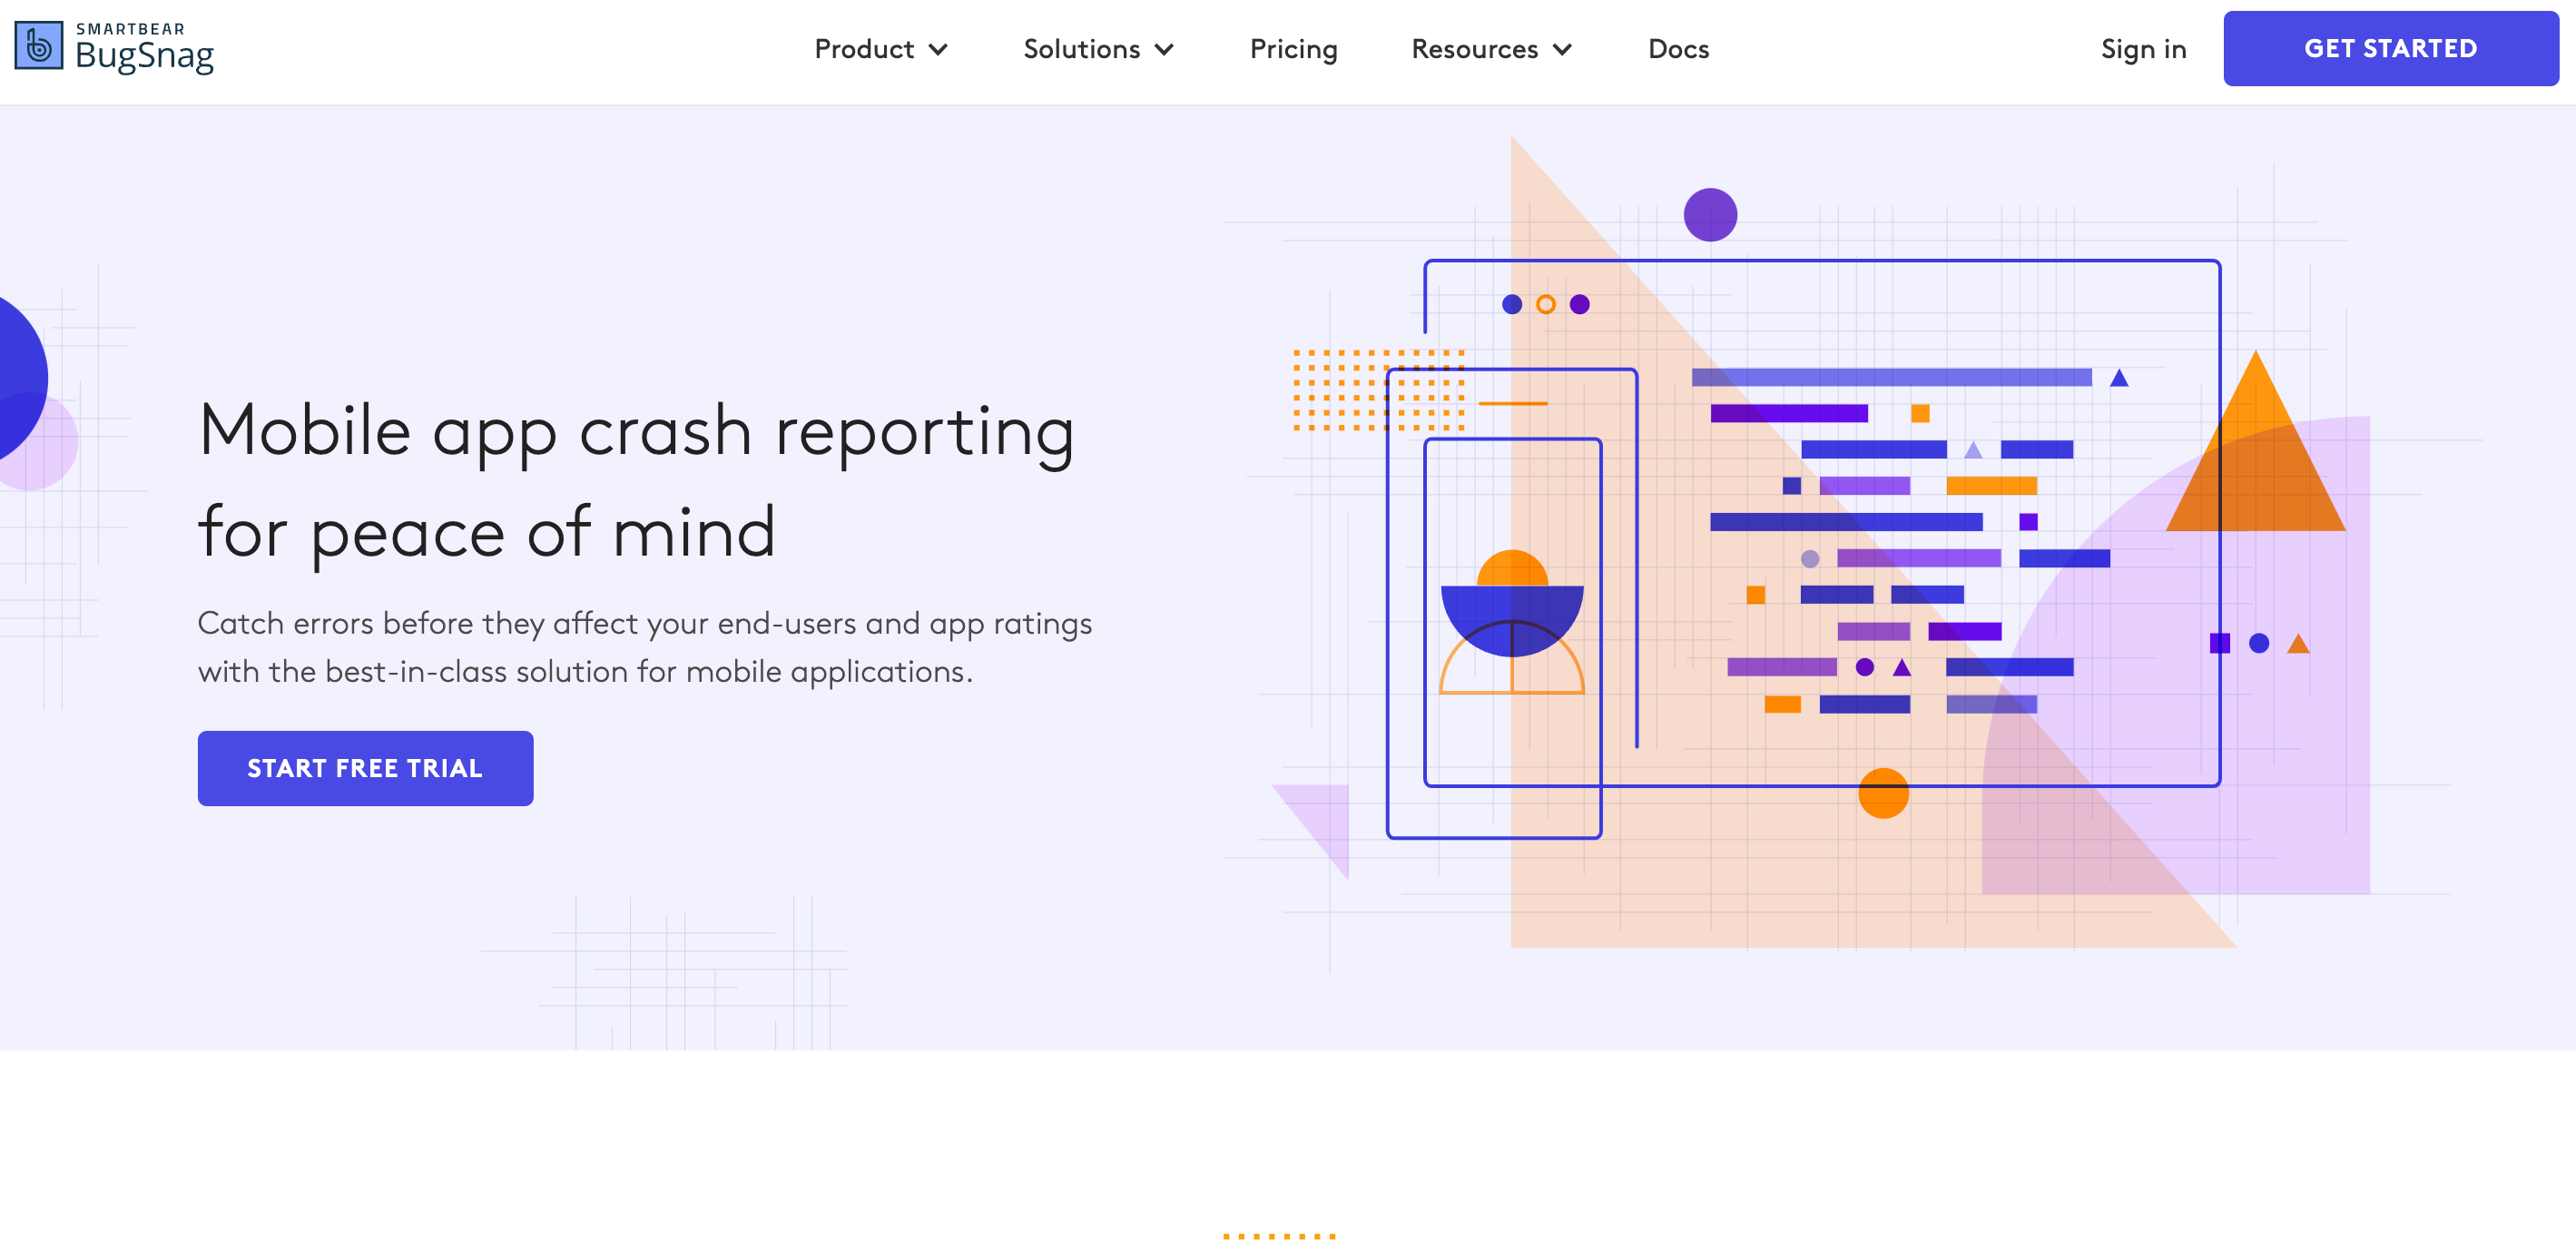

Bugsnag is an error-monitoring and reporting software for mobile apps. It allows developers to identify and fix bugs efficiently while enabling them to see the effects of any code implementation.
Features
The tool offers application stability management that allows teams to determine whether to fix bugs or build new features to improve app stability. It supports integrations for every development aspect, like Bugzilla, Amazon SQS, Webhook, etc.
Bugsnag offers a personalized view of all errors, allowing you to segment errors on multiple attributes to get comprehensive error data. You can host Bugsnag on-premise using a cloud instance or your infrastructure for optimal scalability, control, and compliance.
Pros
Bugsnap offers a free plan, which supports up to 7.5k monthly events. It gives you detailed crash reports, including the exact code that crashed, and offers SaaS and self-hosted solutions. The software supports over 50 platforms, such as Android, Ember, React, Vue, etc.
Cons
Users feel the documentation of some features is insufficient, making it difficult to use them. Others think its paid plans are expensive compared to other tools.
Raygun
G2 User Rating: 4.3/5
Ideal for: Web and mobile apps
Pricing: Crash Reporting: $60/month; Real User Monitoring: $120/month; APM: $120/month; Enterprise: Contact support.
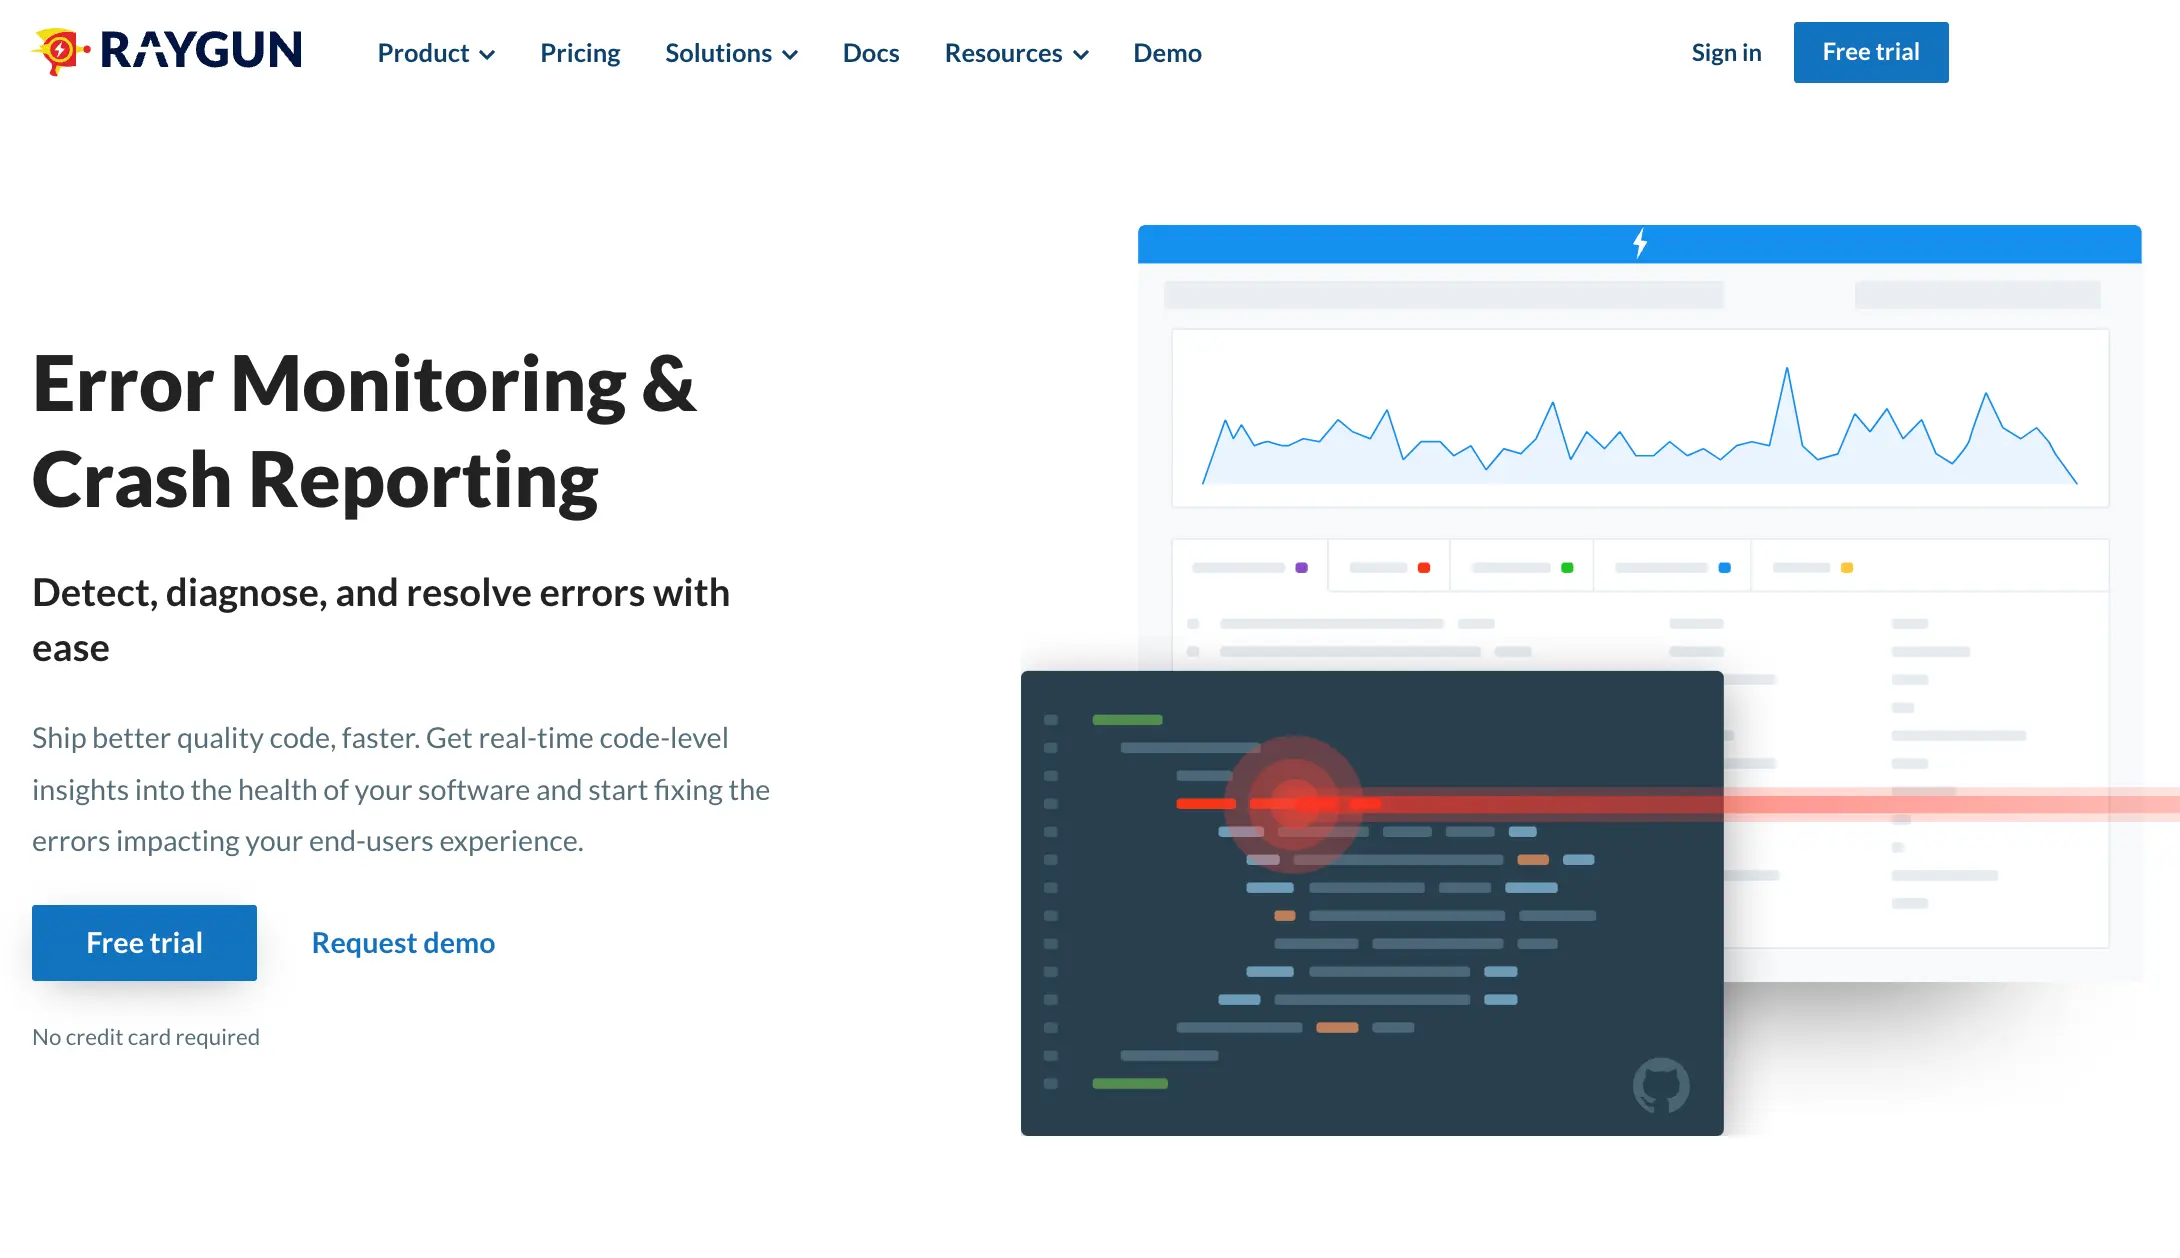
Raygun is a monitoring tool for web and mobile apps, and it offers teams visibility into the quality and performance of their apps. It can detect, replicate, and resolve technical issues to drive better customer experiences.
Features
The tool offers dashboards, which provide a single pane of glass for all your error and performance data. You can customize your dashboards to access the data that matters to you. It has an alerting feature to notify you about any issues within your apps.
Raygun supports integrations like GitHub, Slack, Jira, Assembla, Campfire, Bughead, etc. The deployment tracking system monitors every new feature and deployment to ensure optimal performance and know when there’s an issue.
Pros
The ability to monitor new deployments saves teams from time-consuming manual reviews. It detects bugs in real time and alerts you. The tool offers flexible pricing, which lets you select your estimated errors, sessions, and traces depending on your monthly usage.
Cons
Pricing is based on key tools, like crash reporting and user monitoring, instead of the typical plan-based pricing that offers access to all tools. It may not send alerts when a particular issue reoccurs, and the interface might be challenging for some users.
Rollbar
G2 User Rating: 4.5/5
Ideal for: Software & applications
Pricing: Free plan/ Essentials: $12.50/month; Advanced: $82/month; Enterprise: Contact sales for pricing.
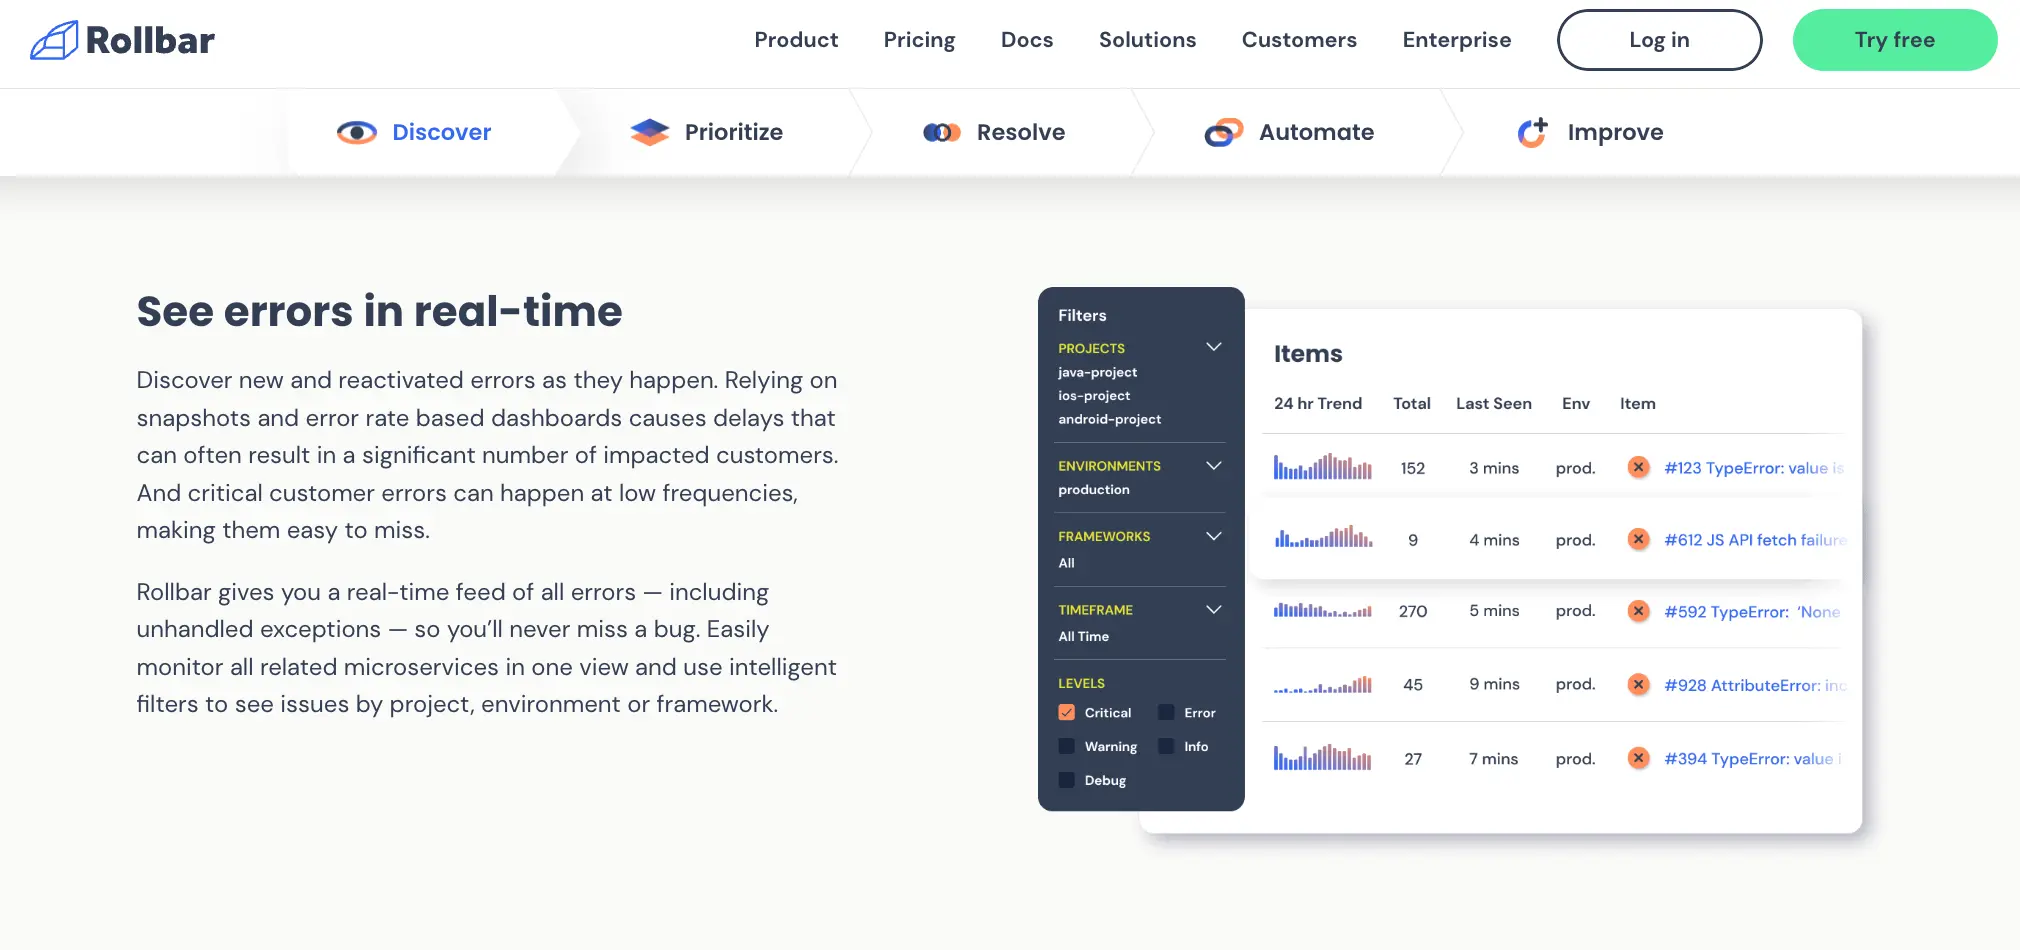
Rollbar is an error tracking and logging tool for software teams. It allows teams to identify, predict, and resolve technical errors in real time. This tool sends instant alerts whenever errors occur to enable teams to respond immediately, minimizing the chances of crashes.
Features
The software offers real-time monitoring, allowing you to discover new and recurring errors as they happen. It groups similar errors and sends just one alert instead of sending alerts for every error. With custom automated workflows, you can improve error handling and analysis.
Rollbar supports integrations like VictorOps, PagerDuty, and Slack to provide instant notifications to teams. The Rollbar Improve feature provides historical trends and metrics to allow teams to understand and improve their code.
Pros
Rollbar allows you to group similar errors to avoid overwhelming you with hundreds of notifications. It offers a free plan that supports up to 5k error events monthly and an excellent interface for a seamless experience. Customers say it’s suitable for both backend and frontend error tracking.
Cons
Completing custom searches seems a challenging task for several users. Some integrations are not entirely seamless, including Android SDK and AWS Lambda. There are also cases of error duplication during new deployments.
Sentry
G2 User Rating: 4.4/5
Ideal for: Applications
Pricing: Free plan / Team: $26/month; Business: $80/month; Enterprise: Contact sales for pricing.
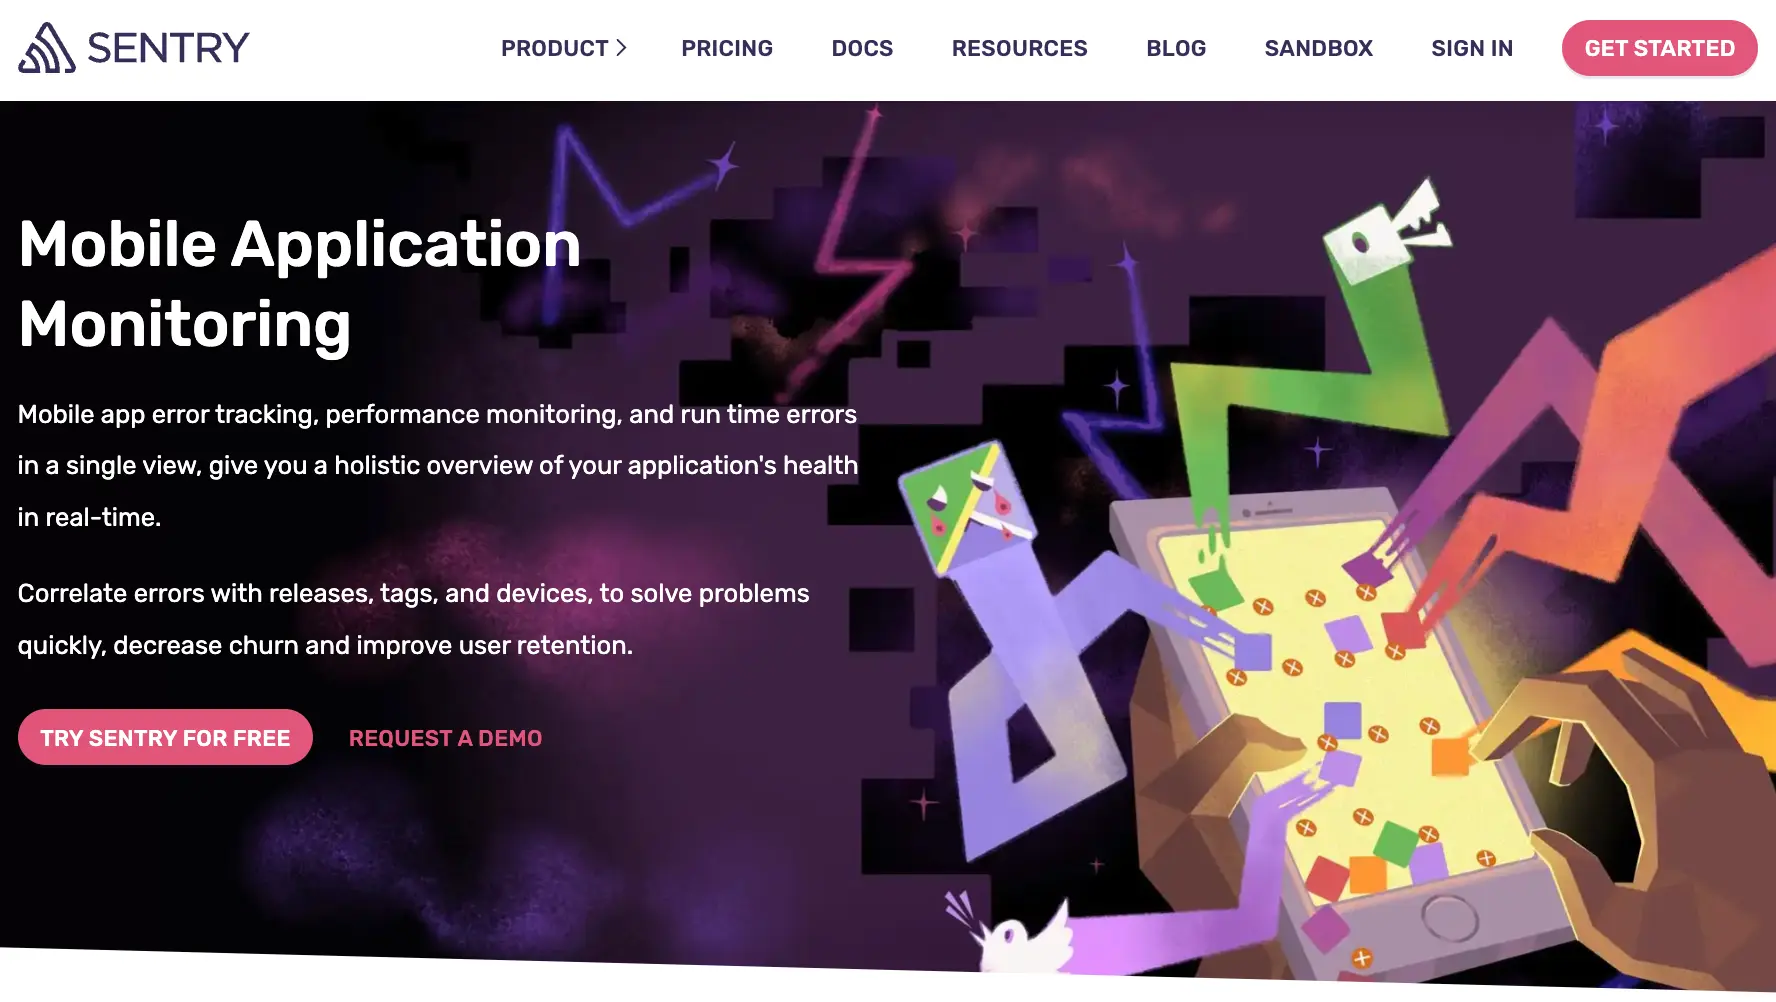
Sentry is an application performance monitoring and error-tracking tool which lets you take care of busted API calls, broken lines of code, and crashes. It offers all the features you need to filter, analyze, and resolve errors to keep your app running smoothly.
Features
You can use custom queries to keep an eye on the most critical parts of your apps and get to the root cause of any error. With dashboards, you get a single glass pane for all transactions and errors across your apps. Plus, you can access all issues across different projects in a single view to save you time.
Distributed tracing lets you trace issues to the source, even if the problem is due to an event in another project or a slow API call. Sentry also offers stack traces, which provide all the critical information on errors, including source code, error filters, and stack locals.
Pros
Sentry offers lots of valuable data in a friendly and accessible interface. It allows users to monitor metrics, including core web vitals and page speed. The tool collects adequate details on problems that happen to users. Real-time alerting keeps teams aware of issues whenever they occur.
Cons
Error reporting seems technical; users might need some knowledge to get it to work. It lacks some useful features like alert configuration, copying, and tagging. Users are unable to group related issues, and this impacts productivity.
Firebase Crashlytics
G2 User Rating: 4.3/5
Ideal for: Android, iOS, tvOS, and macOS apps
Pricing: Stark Plan: Free; Blaze Plan: Pay as you go. Payment depends on different factors, including document reads, GB stored, document deletes, etc.
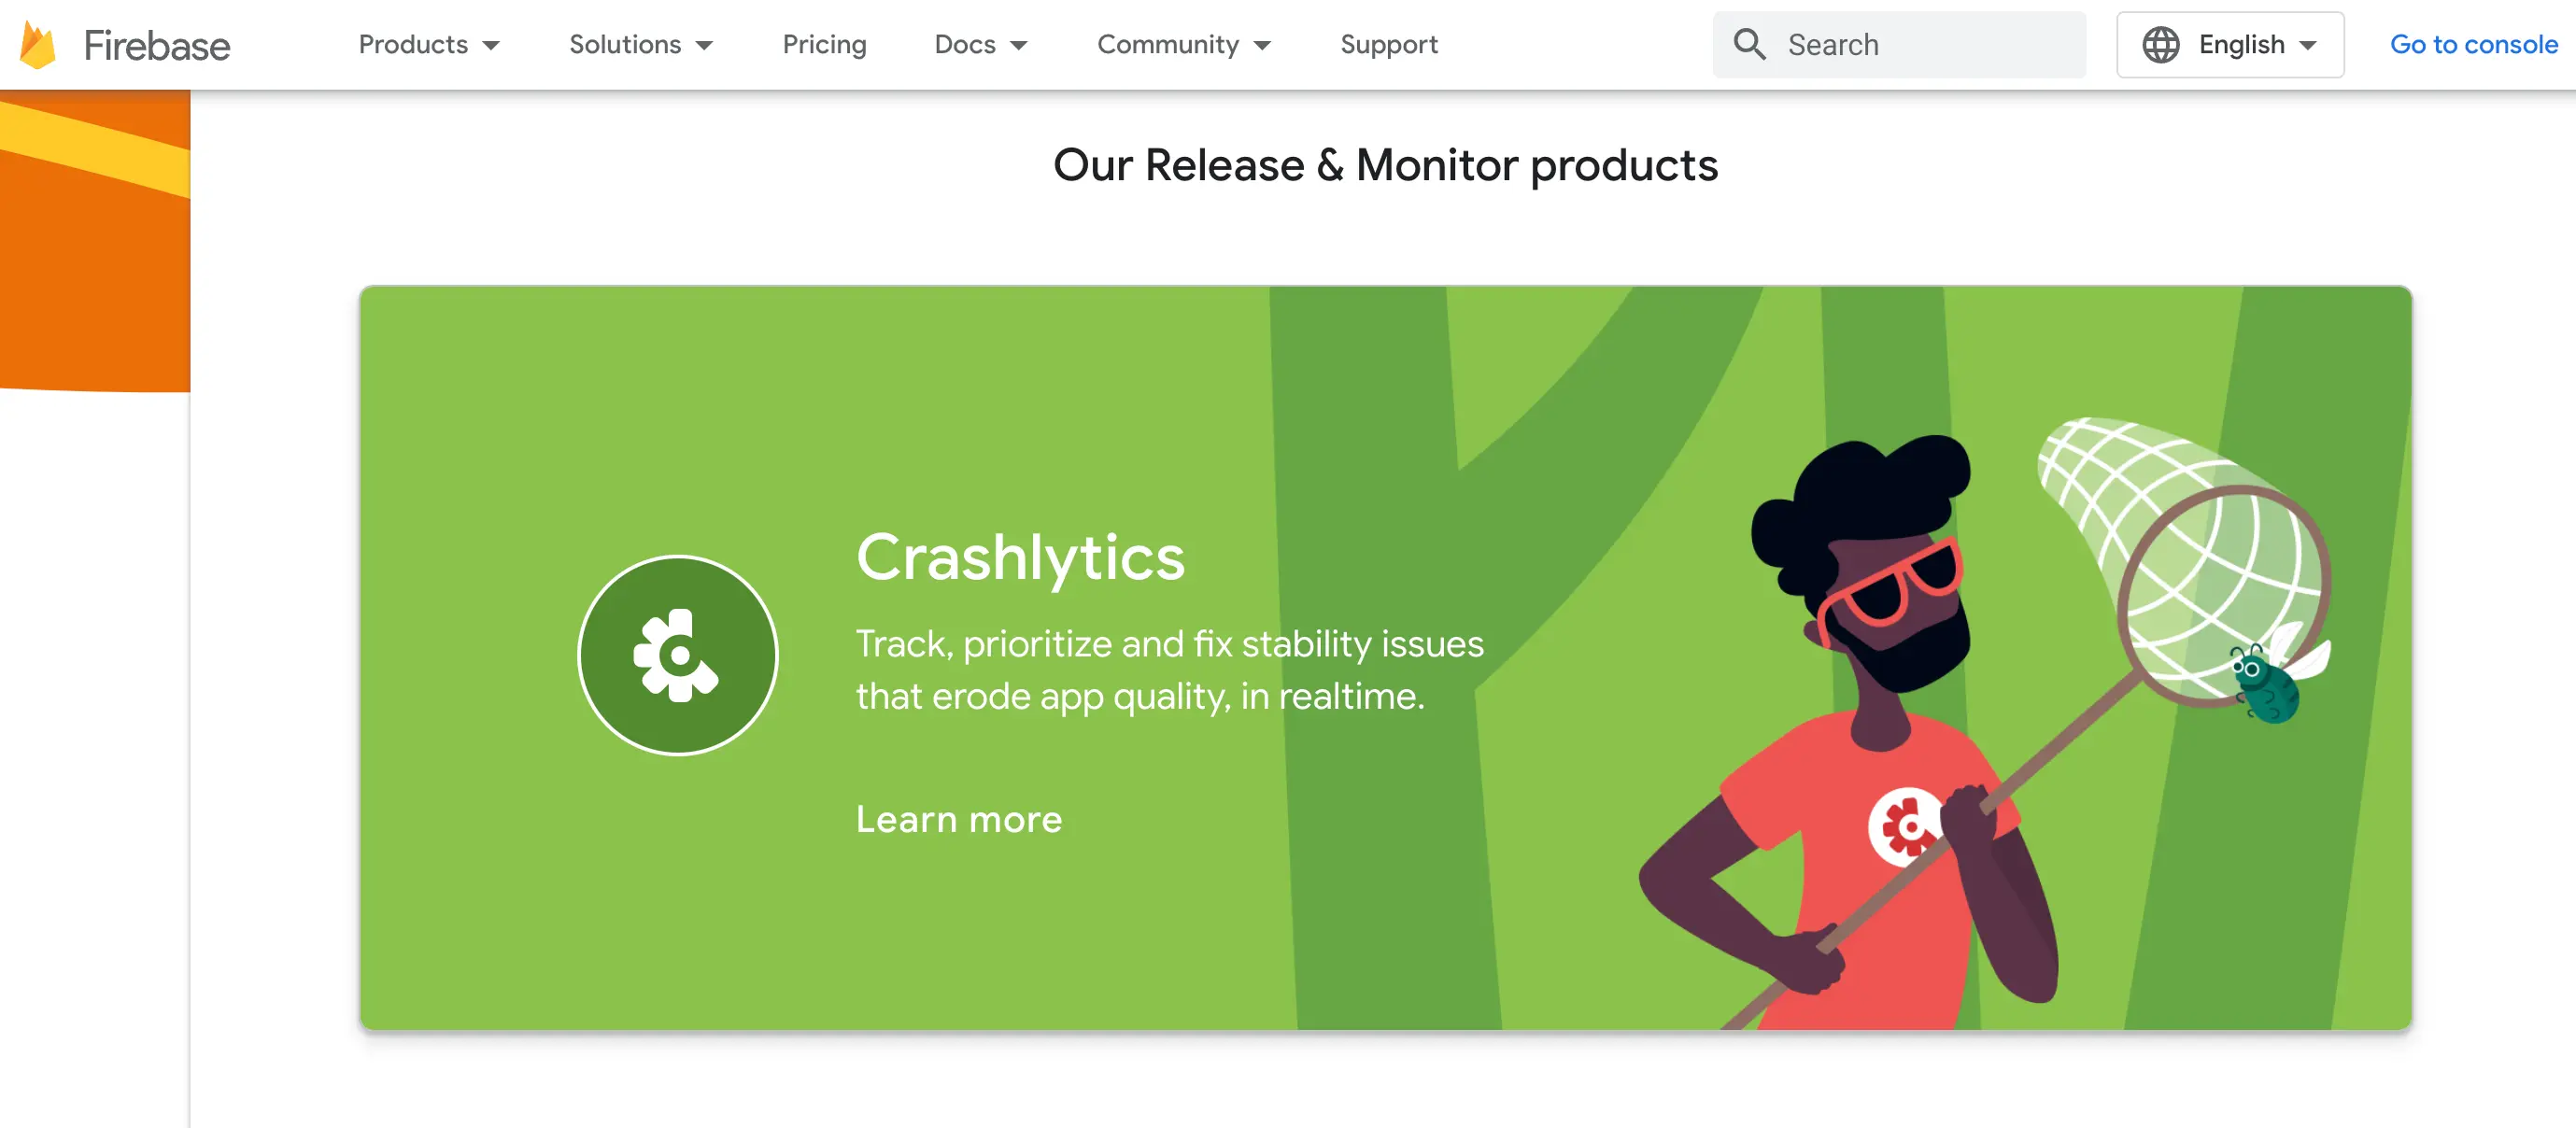
Owned by Google, Firebase Crashlytics is a crash-reporting tool for tracking, prioritizing and fixing app crashes. It offers valuable insights into crashes and supports different platforms, such as Android and tvOS, for real-time monitoring.
Features
The tool offers different integrations, including Jira and Slack, for seamless bug tracking and project management. It delivers real-time alerts for errors to keep you ahead of technical issues.
Crashlytics offers curated crash reports to provide contextual information and highlight critical issues. It features analytics to simplify debugging and give you access to user insights. More importantly, it offers Crash Insights to highlight stability problems and provide resources for troubleshooting them.
Pros
You only need a Google account to start creating projects, and pricing for the Blaze Plan depends on your usage, making payments flexible and predictable. It allows you to integrate with Google Play to access your crash reports in the Crashlytics dashboard. You can customize your reports to include keys, app logs, and non-fatal errors.
Cons
Users feel it’s challenging to use on iOS. New users might find it hard to understand the UI. While the interface is good-looking, users say it needs some improvement to ensure ease of use.
Error monitoring software: a quick refresher
An effective crash investigation starts with picking the right error monitoring software to get deep insights into every issue. Here are some basics that you’ll find helpful.
What is error monitoring software?
Error monitoring software is a tool that tracks bugs and errors and logs them for analysis. These tools can be deployed during any phase of an app lifecycle to monitor errors that might impact app development, deployment, or user experience.
They offer real-time alerts to notify developer teams of any errors or crashes, making it possible to fix problems before they impact workflows and cause downtimes.
What are the best error monitoring tools?
The best error-monitoring tools are Bugsnag, UXCam, Raygun, Rollbar, Sentry, and Firebase Crashlytics. These tools offer all the features you need to stay on top of errors and crashes, including real-time alerting, reporting, custom workflows, etc.
Finding the right tool when looking for error-monitoring software is vital. Consider the number of features a tool offers, integrations, ease of use, framework support, technical support, and pricing.
Why is error monitoring important?
Users expect an uninterrupted, error-less experience when using your app, software, or website. As a result, app performance issues like UI freezes and crashes impact their experience, leading to a high churn rate, revenue loss, and disrupted workflows.
With error monitoring, you get alerted when a problem occurs, allowing you to fix them before they impact your user experience. You also get detailed and better insights into each error to help you find an effective fix and prevent recurring issues.
You might also be interested in these;
Best iOS crash reporting tools
Best Android crash reporting tools
React Native Performance Monitoring - Best Tools & Technique
5 Best mobile app monitoring tools to track app performance
AUTHOR
Tope Longe
Product Analytics Expert
Ardent technophile exploring the world of mobile app product management at UXCam.

Related articles
Conversion Analysis
Mobile App Conversion Rate Benchmarks & Tips for 2026
Get the latest benchmarks, best practices, and proven strategies for mobile app conversion rates in our comprehensive...

Jonas Kurzweg
Product Analytics Expert
Conversion Analysis
The Flutter mobile app heatmap tool: UXCam
Learn how UXCam's Flutter mobile app heatmap tool provides actionable insights to improve your user experience. Simple setup and advanced...

Jonas Kurzweg
Product Analytics Expert
Conversion Analysis
Top 51 Mobile App KPIs: Ultimate List 2026
51 mobile app KPIs — determine the KPIs and metrics that matter the most for your...

Jonas Kurzweg
Product Analytics Expert

