Best 15 Heatmap Analysis Tool for Web and Mobile Apps in 2026

Understanding how users interact with your product is no longer optional, it’s critical. Heatmaps are a practical data visualization tool to know how your users navigate your product.
They answer essential questions like:
Which elements are users trying to click but are ignoring?
How far are users scrolling on your key landing pages?
Where are users experiencing frustration (e.g., rage clicks)?
Whether you manage a website, a mobile app, or a cross-platform digital experience, selecting the right heatmap tool is the necessary first step toward optimizing your conversion rates and improving the user experience (UX).
With so many options available, each offering unique features and capabilities, selecting the best tool can feel overwhelming. We've curated a list of the top website and mobile heatmap tools that stand out for their functionality, ease of use, and ability to provide actionable data across both web and mobile platforms.
Quick Summary: Everything you need to know
The best tools offer more than just colorful maps; they combine visual data with quantitative analytics to give you the full context behind user behavior.
Here are our top recommendations for various needs:
UXCam: Best for combining heatmaps with session replays across web and mobile
Hotjar: Best for marketers for websites
VWO: Best for experimentation
| Tool | Best For | Platform Supported |
|---|---|---|
| UXCam | Product and UX teams seeking comprehensive product analytics with AI insights; | Web & Mobile |
| Hotjar | Marketers, UX designers | Web |
| Smartlook | Teams seeking visual insights | Web & Mobile |
| Fullstory | Enterprises needing deep analytics | Web & Mobile |
| Mouseflow | UX teams analyzing funnels/forms | Web |
| Lucky Orange | Real-time conversion tracking | Web |
| Contentsquare | Large enterprises | Web & Mobile |
| Glassbox | Large mobile-centric enterprises | Web & Mobile |
| VWO | Enterprise experimentation and insights | Web |
| Crazy Egg | SMBs testing layouts | Web |
| Inspectlet | Simple session recording and error logging | Web |
| Plerdy | CRO and SEO specialists | Web |
| Capturly | Simple, all-in-one web analytics | Web |
| Microsoft Clarity | Best free optionfor small-to-midsize traffic | Web & Mobile |
| LogRocket | Developer-focused performance and product analytics | Web & Mobile |
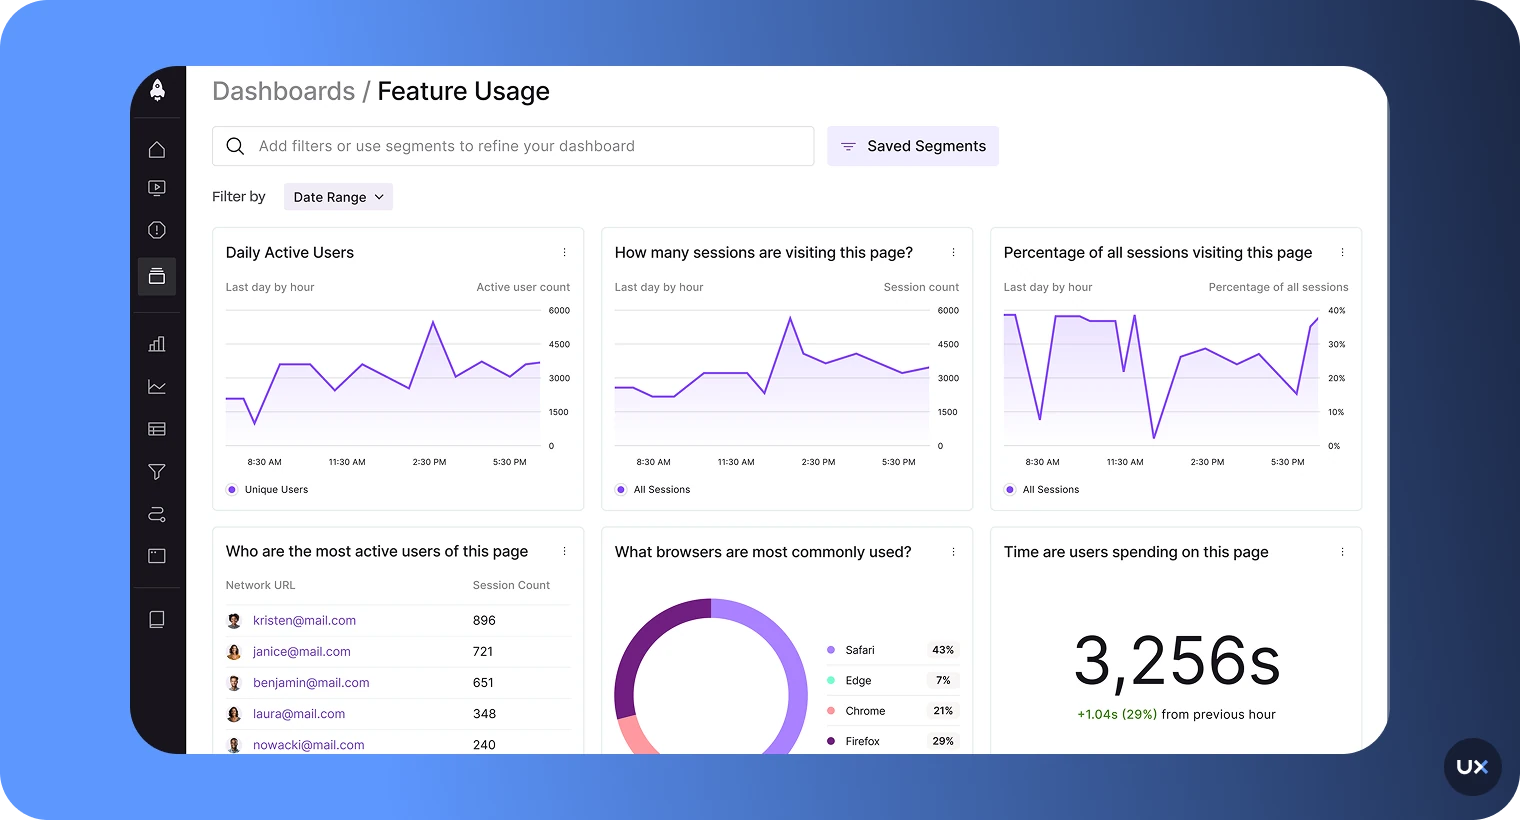
1. UXCam
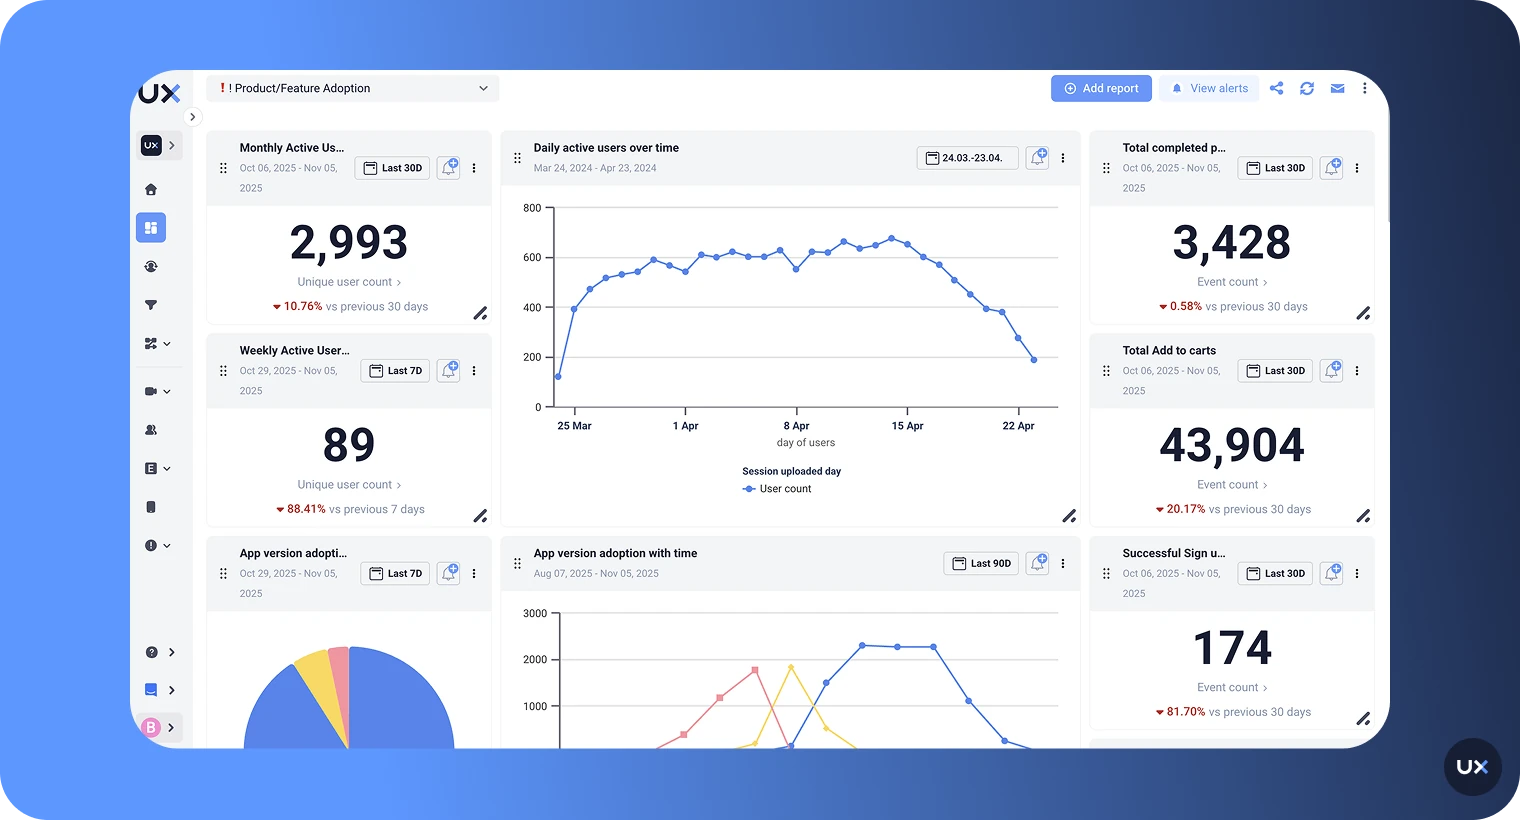
UXCam is a comprehensive, cross-platform product and UX analytics tool built to help teams visualize exactly how users interact with their websites, mobile apps, and web apps. It automatically captures every user action, including taps, swipes, and gestures, without requiring manual tagging, making it effortless to identify usability issues and friction points.
By unifying qualitative and quantitative data in one dashboard, UXCam is the go-to platform for product and development teams focused on delivering a perfect user experience across all devices.


Key features
Automatic event tracking: Capture every user action and interaction without manual tagging or setup.
Combined heatmaps and session replays: See heatmaps for every device and operating system, then watch the corresponding user session for full context.
AI insights (Tara): Get automated summaries and behavior analysis powered by our AI assistant.
Issue analytics: Detect errors, rage clicks, and performance problems in real time.
Funnels & Retention analytics: Identify drop-offs and measure long-term engagement.
Pros
Combines quantitative metrics with qualitative session replays for a full, contextual understanding of user behavior.
The lightweight SDK ensures high performance and starts tracking instantly with no complex setup required, which is crucial for development teams.
Offers data hosting options in the USA, EU and UAE.
AI analyst highlights friction points and summarizes key trends, accelerating time-to-insight for busy teams.
Offers advanced segmentation tools to filter heatmaps by device, page, user type, or specific gestures.
Session replay and heatmaps are available for both web and mobile apps.
Cons
Free plan offers limited usage volume.
Does not include built-in A/B testing capabilities.
Pricing
UXCam offers a free plan covering up to 3,000 monthly sessions. Custom paid plans (Starter, Growth, Enterprise) are available based on session volume and features.
2. Hotjar
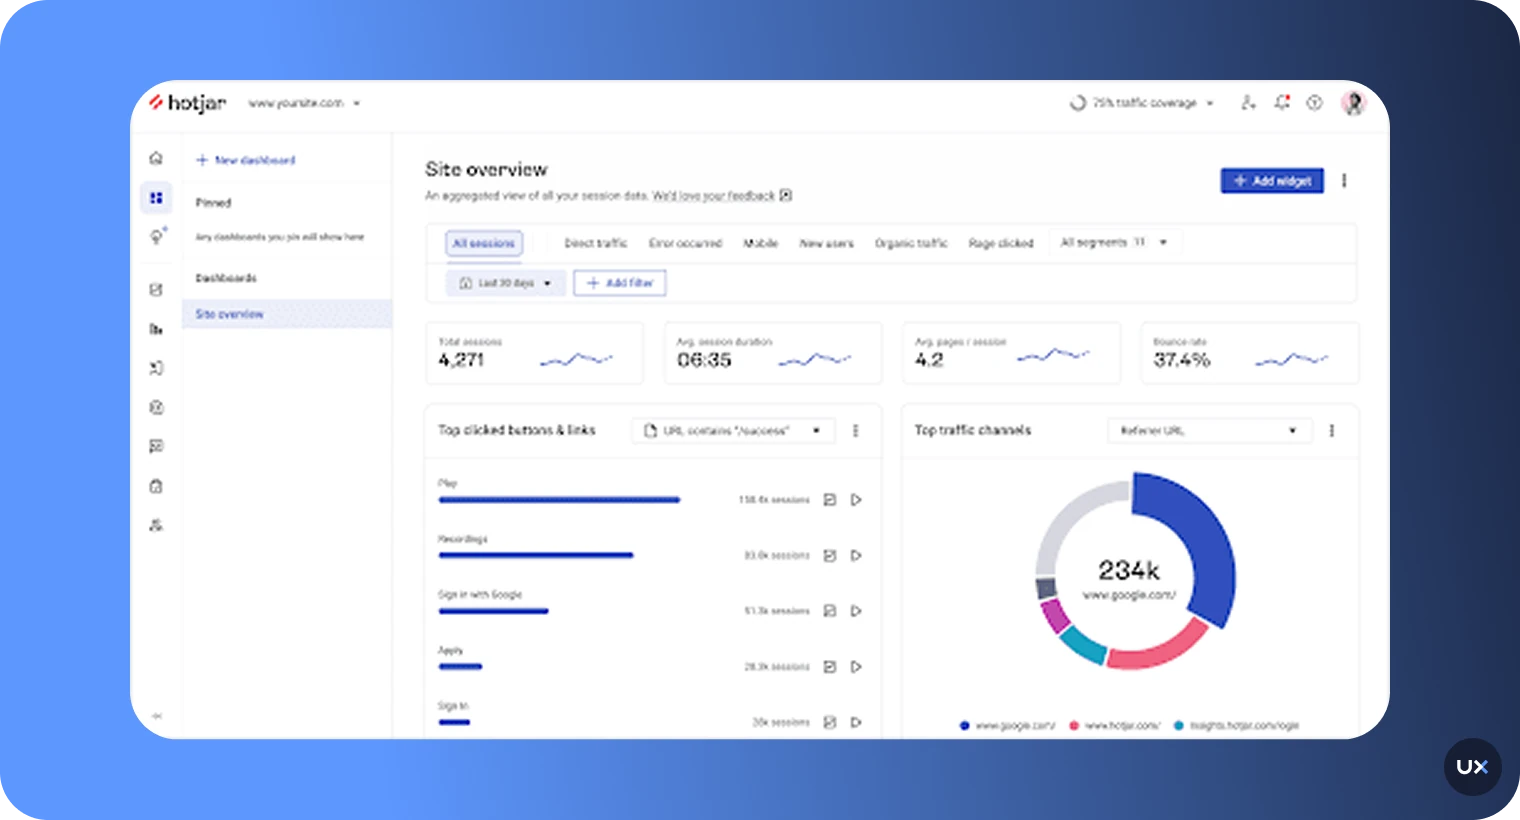
Hotjar is a popular all-in-one analytics and feedback tool that offers heatmaps, session recordings, and surveys for websites only. It visualizes clicks, scrolls, and movements, revealing where visitors engage or drop off on websites. It’s ideal for marketers and UX designers.


Key features
Heatmaps: Visualize clicks, scrolls, and mouse movement to see which parts of a page attract or lose attention.
Session recordings: Watch user sessions to understand interactions, identify friction, and detect drop-offs.
Surveys and feedback widgets: Collect direct user input to learn the reasons behind their actions.
Funnels: Track user journeys and pinpoint where visitors abandon tasks or conversion flows.
User interviews: Recruit participants and run live interviews for qualitative insights.
Pros
Provides a comprehensive suite of features in one platform, including heatmaps, replays, and feedback.
Offers a very generous free plan that supports up to 20,000 sessions.
Features a user-friendly and easy-to-navigate interface.
Offers flexible pricing plans with custom-enterprise options available.
Excellent for collecting both quantitative data and direct qualitative user feedback.
Cons
Focused on websites
Limited data storage is provided on lower-tier plans.
May have a slight impact on site speed if not properly optimized.
Does not offer automatic issue detection like rage clicks and UI freezes
Lacks the advanced cross-platform segmentation features of a truly unified tool.
Pricing
Hotjar offers a free plan that supports up to 20k sessions and access to core features. Paid plans start at $40 per month and scale based on session volume and data retention, with custom-enterprise options available.
3. Smartlook
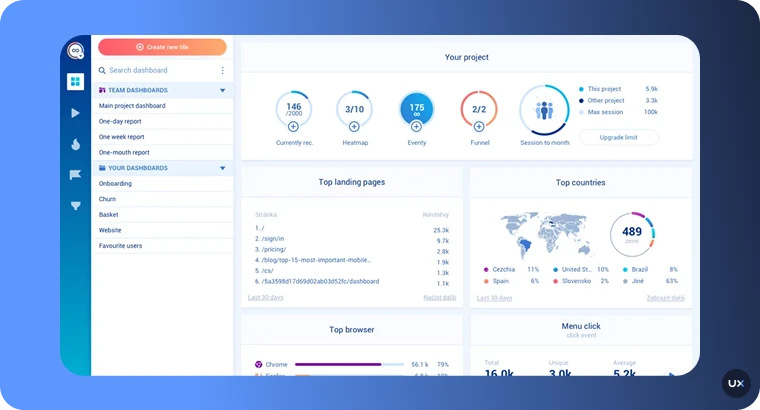
Smartlook is a website analytics tool that shows how visitors interact with your site. It combines session replays, heatmaps, and event tracking to reveal user behavior. Designed for both mobile and web, Smartlook helps teams visualize how users interact with every element of their product, from clicks and scrolls to gestures and navigation patterns.


Key features
Session replays: Watch how users navigate and interact with your website in real time.
Cross-platform heatmaps: See where visitors click, scroll, or hover most on both web and mobile.
Event tracking: Automatically capture clicks, page views, and custom events without coding.
Funnels: Visualize user paths and pinpoint where visitors drop off in the conversion process.
Error and rage-click tracking: Detect bugs, frustration signals, and usability issues instantly.
Pros
Affordable compared to most other cross-platform analytics tools.
Supports both web and mobile applications from a single platform.
Custom events can be defined without requiring coding.
Features an intuitive interface and fast setup.
Funnels reveal precise drop-off points in user journeys.
Cons
Lacks the built-in AI assistant for automated insights and summaries.
Heatmaps for dynamic pages may show inconsistent data.
Fewer advanced AI or predictive analytics features.
Limited segmentation and filtering options on lower plans.
Does not offer in-depth feedback widgets for collecting qualitative data.
Pricing
Smartlook offers a free plan, a Pro plan starting around $55/month, and custom-Enterprise plans for high traffic and advanced features.
4. Fullstory
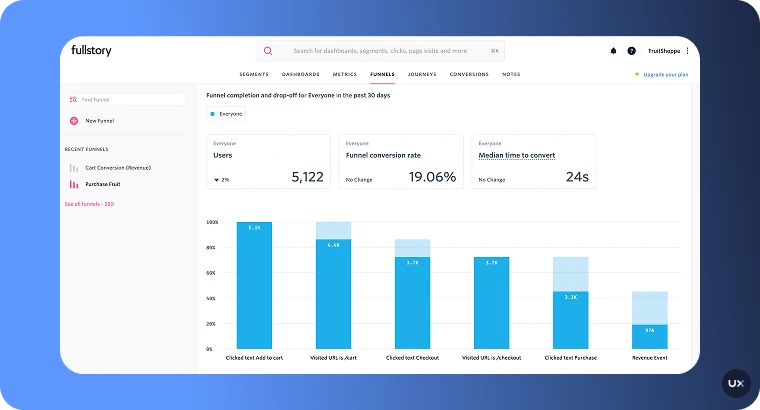
FullStory is a digital experience analytics and session replay platform that captures every user interaction like clicks, taps, scrolls, and page transitions. Its powerful search and AI insights help teams spot friction, fix bugs, and optimize UX across web and mobile apps for better user satisfaction and conversions.


Key features
Autocapture of user interactions: Clicks, scrolls, movement and form inputs get recorded automatically.
Session replays: Watch real user sessions to see exactly how visitors navigate your site or app.
Heatmaps & scrollmaps: Visualize where users click and how far they scroll across your pages.
Funnels & conversion tracking: Map user journeys and identify where drop-offs occur.
Journey mapping: Automatically trace users’ paths across pages and sessions.
Pros
Provides extremely detailed, granular user data.
Offers scalable solutions for businesses of all sizes, especially powerful for enterprises.
Features strong collaboration tools for product, design, and engineering teams.
Captures user interactions automatically across both web and mobile apps.
Powerful search and segmentation capabilities for deep, retroactive analysis.
Cons
Features a higher price point, especially for premium features and higher session volume.
May offer more data than necessary for small sites with limited traffic.
Paid plans scale by session volume and data retention.
Requires custom pricing for Business, Advanced, and Enterprise tiers.
Lacks the specific focus on developer-centric issue analysis that UXCam provides for mobile apps.
Pricing
Fullstory offers a free tier with limited sessions and basic analytics. Paid plans (Business, Advanced, and Enterprise) scale by session volume, data retention, and features, with custom pricing for larger teams.
5. Mouseflow
Mouseflow is a web analytics tool that records user sessions, clicks, scrolls, and movements across your website. It helps teams identify friction points, analyze user journeys, and improve conversions through heatmaps, funnel tracking, and form analytics.


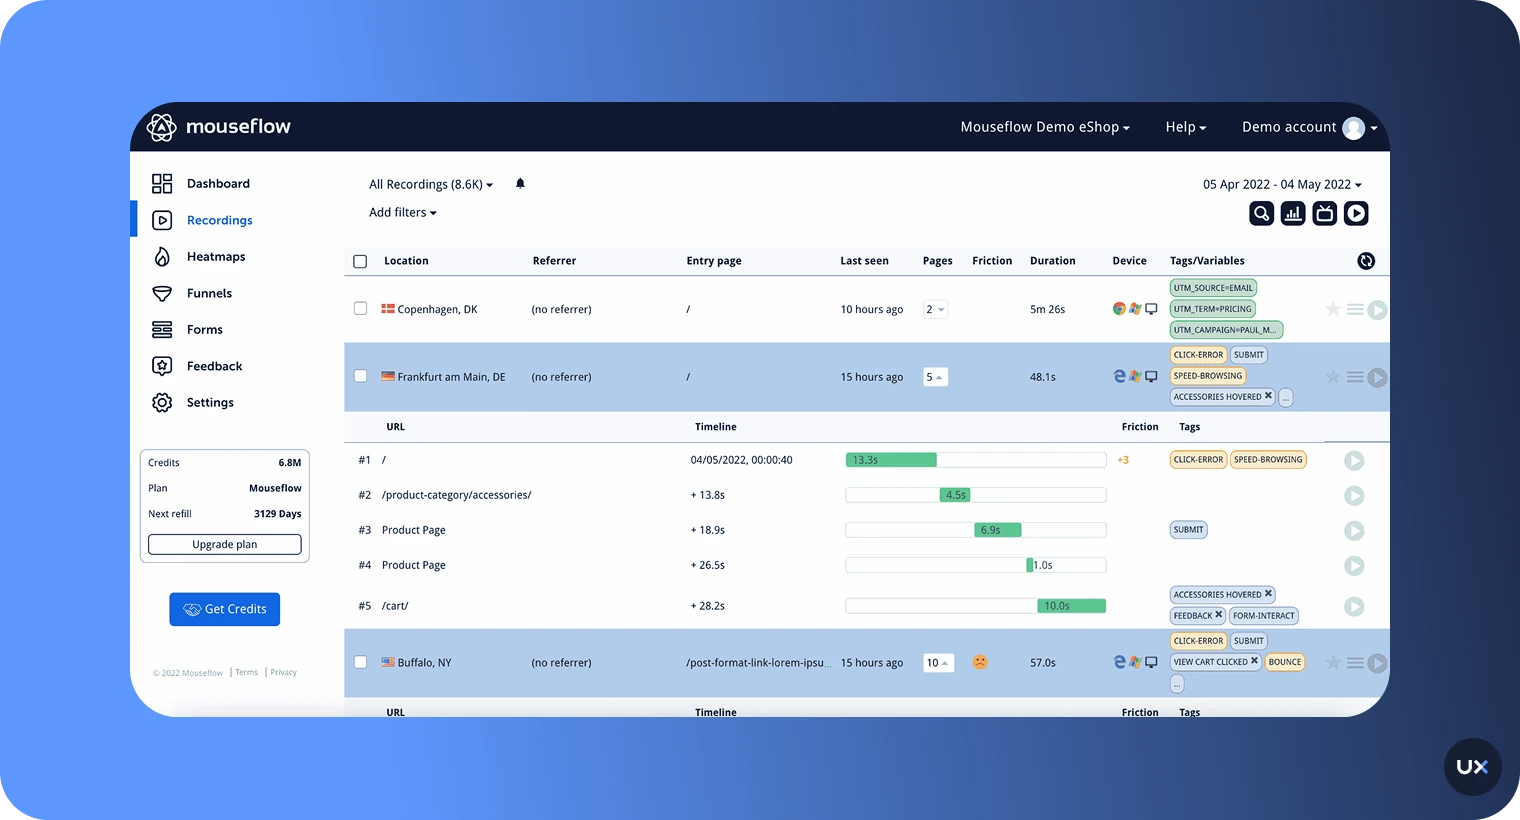
Key features
Heatmaps: Visualize user clicks, scrolls, movement, attention, and even geographic data across pages.
Session recordings: Replay actual user sessions to understand behavior and friction points.
Funnels: Track conversion paths and identify where visitors drop off in their journey.
Form analytics: See which fields users abandon, time spent per field, and completion rates.
Friction detection: Automatically flags rage clicks, dead clicks, and rapid movements signaling frustration.
Pros
Provides advanced analytics features for in-depth analysis of forms and funnels.
Offers multiple specific heatmap types, including geographic and attention maps.
Compliant with strong privacy controls like GDPR and CCPA.
Features real-time data processing.
Automatic friction detection helps quickly identify usability issues.
Cons
Lacks native mobile app analytics capabilities (focused on web).
Steeper learning curve due to the number of advanced features.
Higher costs at premium tiers.
Session replay cannot be used simultaneously with heatmaps for direct context on web pages.
The primary use case is detailed funnel and form analysis, which may require more focus than other tools.
Pricing
Mouseflow offers a free plan. Paid plans start at $25/month for 5,000 sessions, and scale to plans costing $109/month for 25,000 sessions or $319/month for 100,000 sessions, with custom pricing for enterprise-level usage.
6. Lucky Orange
Lucky Orange is a conversion optimization and heatmap tool that records user sessions, clicks, and scrolls to reveal where visitors get stuck or drop off on websites. It includes live chat, surveys, and funnels, helping marketers and UX teams improve engagement and boost conversions in real time.


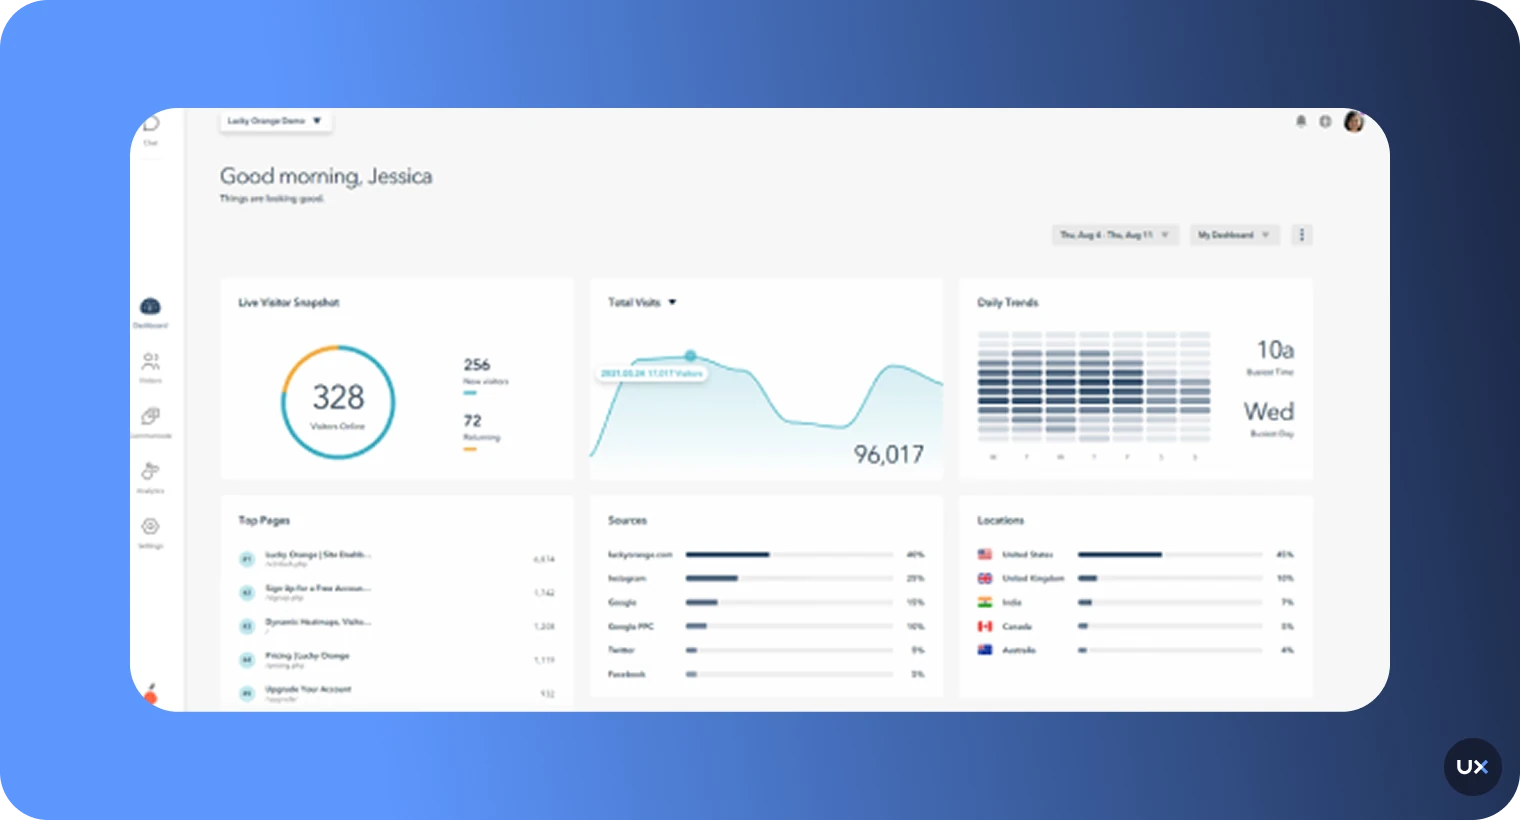
Key features
Heatmaps: Visualize click, scroll, and movement data directly on your website pages.
Session recordings: Replay individual visitor journeys to identify confusion, drop-offs, or bugs.
Live chat and visitor profiles: Chat with users in real time while viewing their on-site activity.
Conversion funnels and form analytics: Track user paths and pinpoint steps or fields causing abandonment.
Advanced filtering and segmentation: Analyze behavior by device, source, cart value, or custom parameters.
Pros
Combines multiple conversion tools (heatmaps, replays, chat) in one platform.
Competitive pricing options, including a very affordable starter plan.
Easy to set up and use.
Heatmaps work with all sorts of website elements, including drop-down menus.
Allows seeing clicks, moves, and scrolls in real time.
Cons
Limited support for native mobile app analytics (focused solely on websites).
The interface may be overwhelming for new users due to the many features.
Limited integrations compared to other enterprise tools.
The free plan offers a very limited allowance of only 100 monthly sessions.
Lacks the depth of mobile gesture analysis that UXCam offers.
Pricing
Lucky Orange offers a free plan with up to 100 monthly sessions. Paid plans begin at about $32/month annually for 3,500 sessions and scale to $839/month for 300,000 sessions, with a custom enterprise tier above that.
7. Contentsquare
Contentsquare is an enterprise-level platform that delivers deep digital experience analytics. It provides heatmaps, session replays, journey analysis, and AI-driven insights to reveal how users click, scroll, and navigate. Built for product, UX, and marketing teams at scale, it helps identify friction and drive better business outcomes through real behavior data.


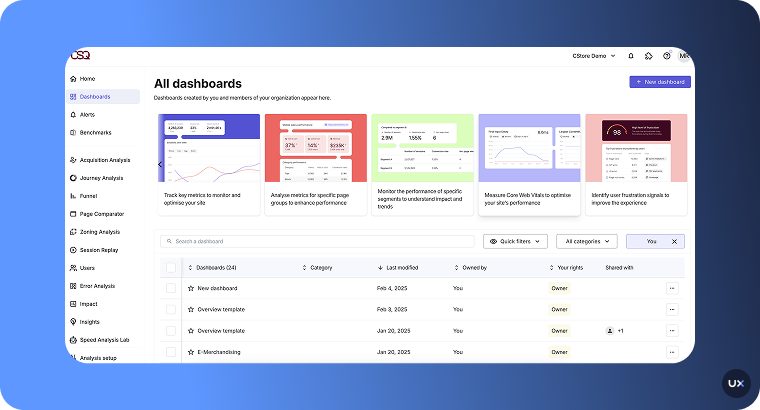
Key features
Automatic interaction capture: Record every click, scroll, tap, and form entry without manual tagging.
Heatmaps and zoning analysis: See which on-page elements attract attention and which get ignored.
Session replays: Watch full user sessions to understand navigation patterns and friction points.
Journey mapping: Visualize user paths across pages, channels, and devices to uncover drop-offs.
AI insights (Sense): Automatically detect issues, measure their impact, and suggest improvements.
Pros
Provides highly advanced analytics capabilities.
Uses powerful AI-powered insights for proactive and automated issue detection.
Excellent training resources tailored for enterprise teams.
Designed to handle massive traffic volumes (enterprise-level) across web and mobile.
Zoning analysis provides a unique way to segment and measure content effectiveness.
Cons
Geared heavily towards large enterprises, often requiring bigger budgets.
Requires significant onboarding and training to utilize all features fully.
Pro and Enterprise pricing is customized, lacking transparent tier pricing.
May not be the right fit for small or mid-size businesses due to complexity and cost.
Lacks the lightweight SDK approach optimized for mobile dev teams (unlike UXCam).
Pricing
Contentsquare offers a free plan for basic analytics, with paid plans starting at $40 per month. Pro and Enterprise pricing is customized based on traffic volume and business needs.
8. Glassbox
Glassbox is a digital experience analytics platform that provides high-fidelity, true native mobile app heatmaps, making it a strong alternative for teams focused on enterprise-level mobile UX. It captures every tap, swipe, and gesture across iOS and Android apps, offering deep behavioral insights without requiring manual tagging.


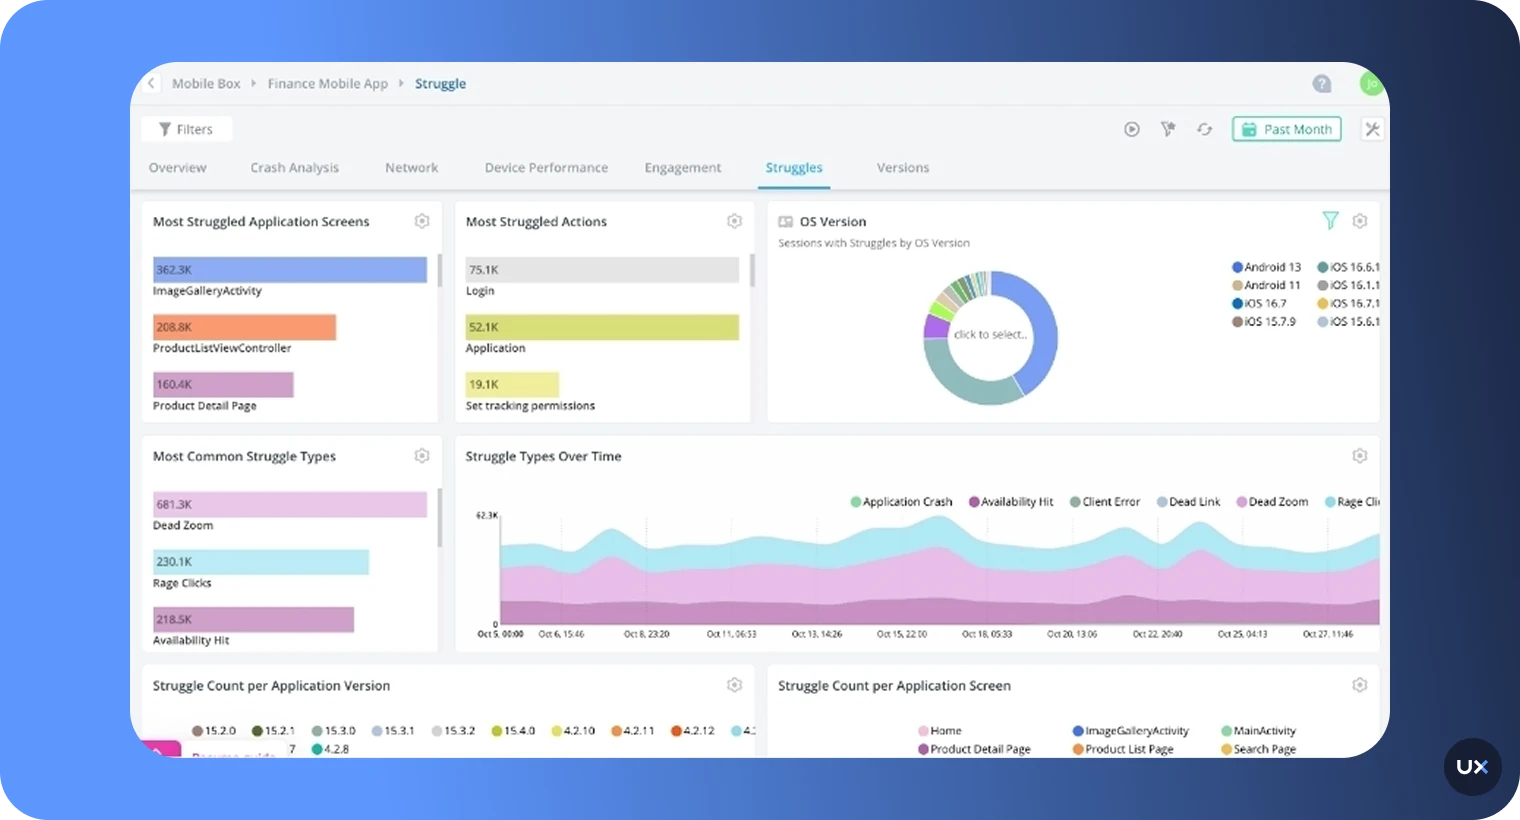
Key features
Session replay: High-fidelity replays that help teams understand the “why” behind user actions.
Friction & struggle detection: Automatically identifies rage taps, dead taps, and UI frustration points.
Journey mapping: Understand complete user paths across mobile and web experiences.
Crash & performance analytics: Detect UI freezes, slow screens, crashes, and ANRs with contextual visual data.
Funnels & conversion optimization: Track key flows like signup, checkout, and onboarding, and combine funnel insights with heatmaps and replays to uncover hidden drop-offs.
Pros
Offers strong native mobile heatmap support and mobile app analytics.
Excellent for enterprise-scale mobile analytics.
Automatic struggle detection saves manual analysis time.
Provides highly secure and compliance-ready features.
Combines strong performance monitoring with behavioral insights.
Cons
Designed for large organizations, and may be too heavy for small teams.
Requires initial onboarding and training to fully unlock its value.
Advanced features may require technical support or training.
Uses custom pricing, which is based on session volume and data-retention.
Data volume limits can significantly increase costs as usage scales.
Pricing
Glassbox uses custom pricing, based on your selected package, session volume, and data-retention period.
9. VWO
VWO is a comprehensive Conversion Rate Optimization platform whose Insights suite includes powerful heatmap data visualizations. It is well-suited for high-traffic websites and enterprises that integrate experimentation (A/B testing) with user behavior analysis. VWO Insights helps to gain a better understanding of the actions of your website visitors.


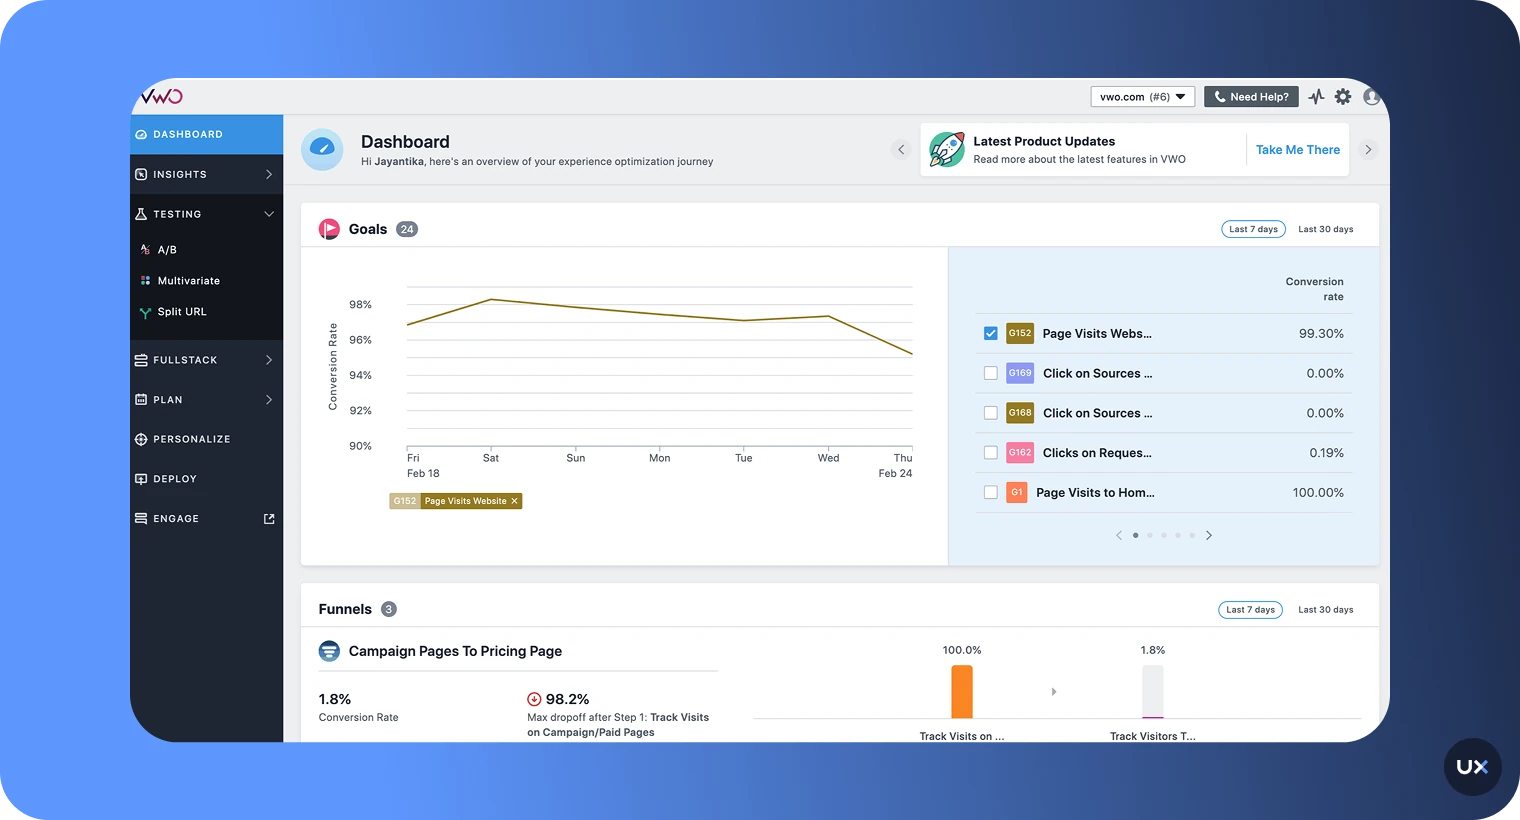
Key features
Heatmaps: Offers click maps, scrollmaps, click areas, and element lists.
Audience segmentation: Heatmaps can be filtered depending on the type of user, device, or browser.
Integrated A/B testing: Part of a larger platform that allows direct experimentation based on heatmap insights.
Funnels, and form analytics: Tracks user journeys and drop-offs across web forms and funnels.
Cross-device tracking: Supports viewing heatmaps from desktop, mobile, and tablet.
Pros
Provides a full-featured CRO platform, combining heatmaps with powerful A/B testing.
Ideal for enterprises with high session volume and large-scale testing needs.
Offers advanced segmentation capabilities (user cohorts, custom attributes).
Generative AI features are available to analyze data.
Includes an "Observation feature" to attach heatmap screenshots to insights for collaboration.
Cons
Does not support native mobile app analytics (focused on web).
High starting price point for the Insights suite (€596/month) compared to other tools.
Requires a significant budget, making it less accessible for small businesses or teams with low budget.
The primary value is realized when used in combination with the larger VWO experimentation suite.
The generative AI features are typically only available on premium plans.
Pricing
VWO Insights starts at €596/month, with Enterprise pricing customized.
10. Crazy Egg
Crazy Egg is a website behaviour analytics tool that provides heatmaps, scrollmaps, session recordings, and A/B testing to show what visitors do on your pages. It’s well-suited for marketers, UX designers, and conversion-driven teams who want clear visual data to improve page layout, placement of CTAs, and overall user engagement.


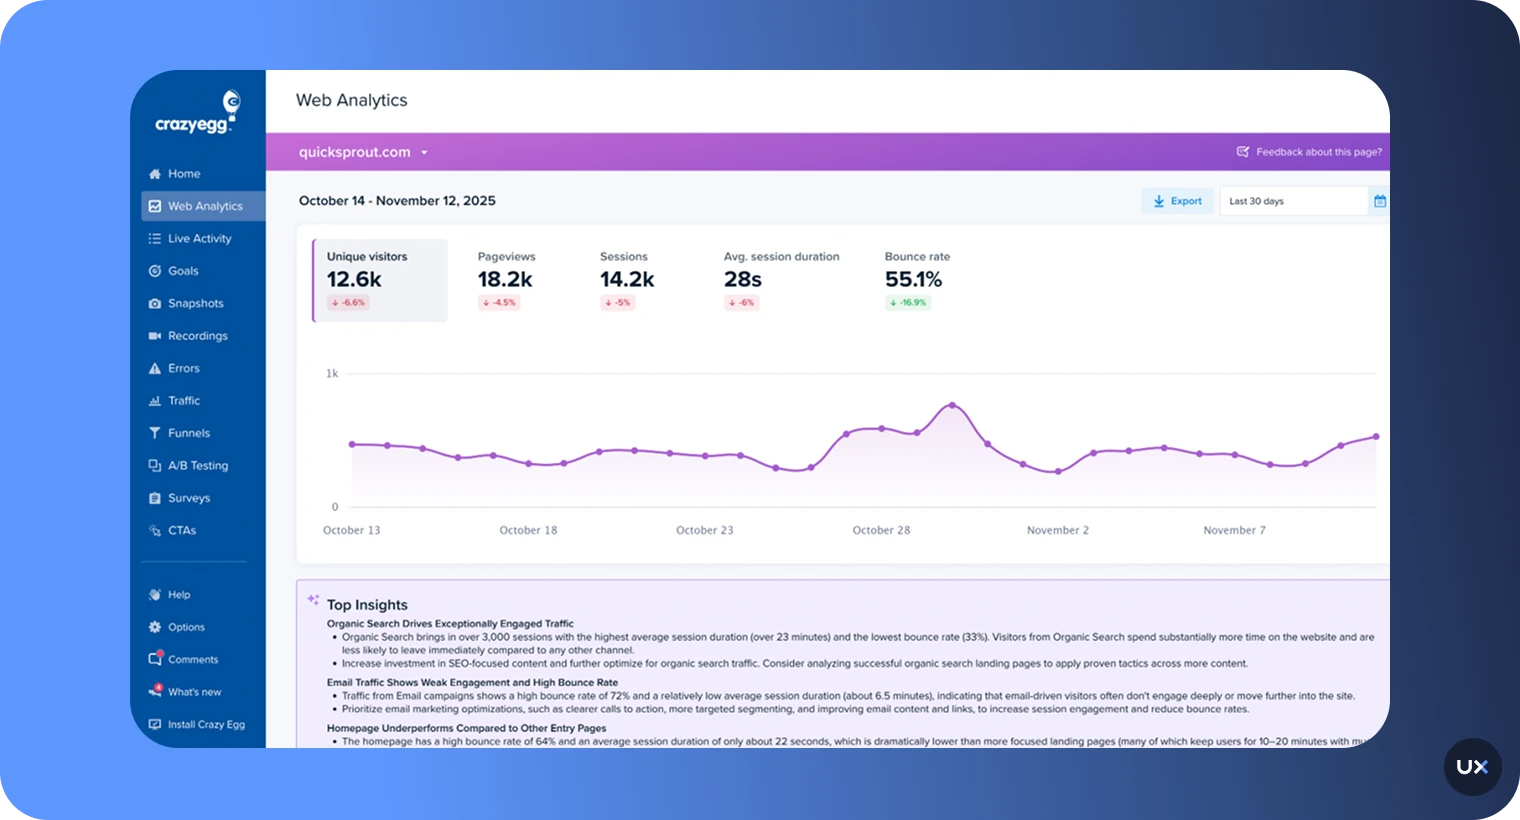
Key features
Heatmaps and scrollmaps: See where users click, scroll, and spend the most time on your site.
Confetti and overlay reports: Unique reports break down clicks by traffic source, device type, or referral channel.
A/B testing: Run on-page experiments to compare designs and improve conversions.
Session recordings: Watch individual user journeys to uncover friction points and usability issues.
Error gracking and Goals: Monitor user errors and track key actions like form submissions.
Pros
Offers unique "Confetti" heatmaps for detailed insights segmented by traffic source.
Affordable starting price suitable for small-to-midsize businesses.
Features simple setup and easy integration.
Includes built-in A/B testing capabilities.
Provides clear visual data to improve page layout and CTA placement.
Cons
Lacks support for native mobile app heatmaps and replays (web only).
The interface may feel dated compared to newer tools.
Lacks some advanced features like dedicated form analytics.
Session recordings are not in combination with heatmaps for direct visual context.
Plans are based on pageviews, which can become expensive with high traffic.
Pricing
Crazy Egg offers tiered plans starting at $29 per month for 5,000 pageviews and 5 heatmap reports.
11. Inspectlet
Inspectlet covers classic, click, and scroll heatmap data visualizations. It is a straightforward tool that focuses on combining heatmaps with session recording, A/B testing, and robust error logging. Inspectlet tracks mouse movements, which it correlates with eye movements, to see where visitors are paying attention.


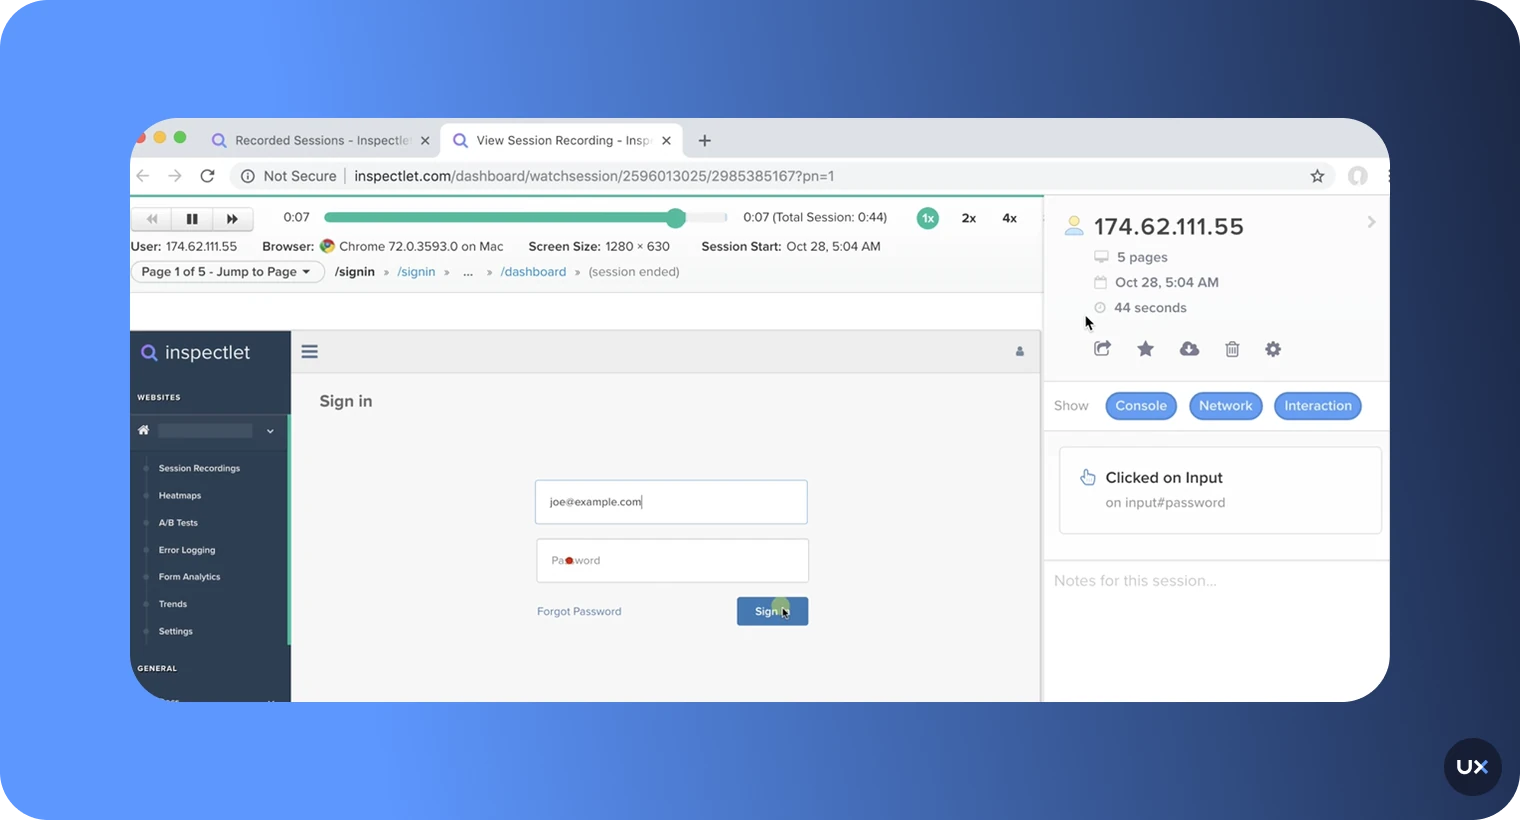
Key features
Heatmaps: Provides Eye-tracking (via mouse movement), Click, and Scroll heatmaps.
Session recording: Allows replaying individual visitor sessions.
Error logging: Monitors and analyzes JavaScript errors to maximize website performance.
A/B testing: Integrated capabilities for running on-page experiments.
Form analytics: Tracks how users interact with online forms.
Pros
Simple yet effective for foundational web behavior analysis.
Offers a free plan for low-volume usage.
Strong focus on JavaScript error tracking and logging.
Very user-friendly and easy to implement (doesn't require a lot of dev hours).
Correlates mouse movements with eye-tracking for attention insights.
Cons
Lacks mobile app heatmap and session replay support (web-only).
Reported performance issues and inconsistent behavior by some users.
The free plan is limited in usage volume.
Not suitable for large organizations that need deep, detailed enterprise reporting.
Does not offer the same level of automatic issue detection as UXCam.
Pricing
Inspectlet offers a free plan for 2,500 sessions per month. Paid plans start at $39/month.
12. Plerdy
Plerdy is a comprehensive Conversion Rate Optimization (CRO) toolkit that includes a powerful heatmap tool. It offers a unique focus on tracking selected text, which helps SEO and content teams determine what their visitors find most relevant. It provides various heatmap types, funnels, and an SEO checker.


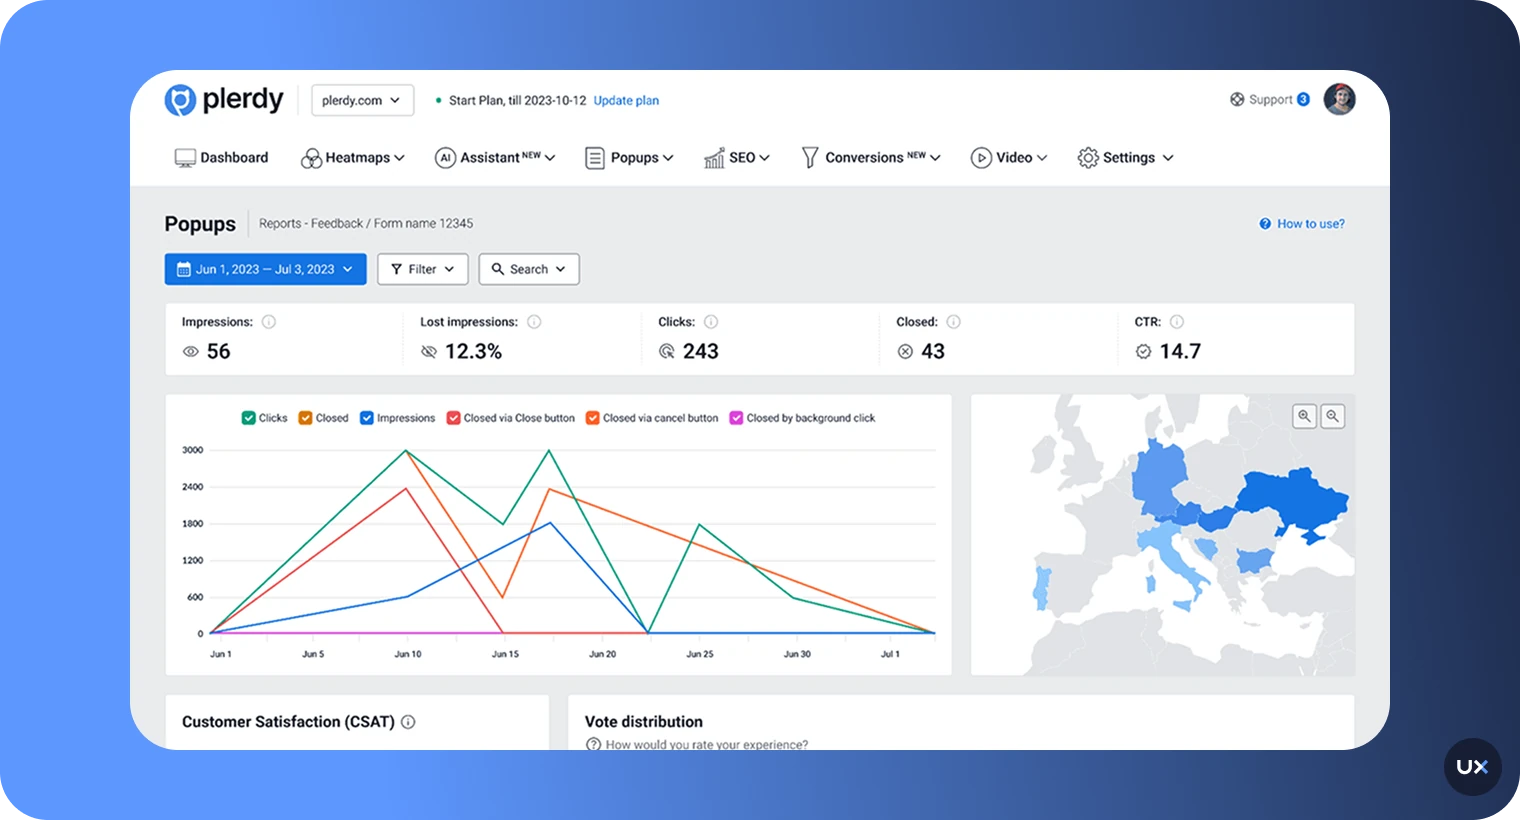
Key features
Heatmaps: Clicks, scrolls, hot segments, mouse hovers, cursor position, and click paths.
Selected text tracking: Unique feature to see which text users select while reading content.
SEO checker: Integrated tool for on-page SEO analysis.
Funnels: Tracks user journeys and drop-off points.
E-commerce and pop-up forms: Specific tools for sales performance and on-site conversion forms.
Pros
Offers a unique and powerful feature for tracking selected text.
One of the most comprehensive sets of heatmap types available.
Includes a built-in SEO checker, making it valuable for content and SEO teams.
Affordable starting price with both a free plan and free trial available.
Combines behavioral data with specific e-commerce and lead-gen tools.
Cons
Lacks native mobile app analytics (focused on web).
Limited sessions replay volume on paid plans.
Customer support response times can sometimes be inconsistent.
The feature set is heavily oriented toward marketing and CRO rather than deep UX/dev issues.
May be overly complex for users only needing basic heatmaps.
Pricing
Plerdy offers a free plan (100 heatmaps daily) and a free trial. Paid plans start at $32/month.
13. Capturly
Capturly is a straightforward heatmap tool that provides click, scroll, and segment heatmaps. Beyond heatmaps, it provides a comprehensive suite of features including session replay, conversion funnels, event analytics, and an all-in-one analytics platform designed to make sense of quantitative and qualitative data.


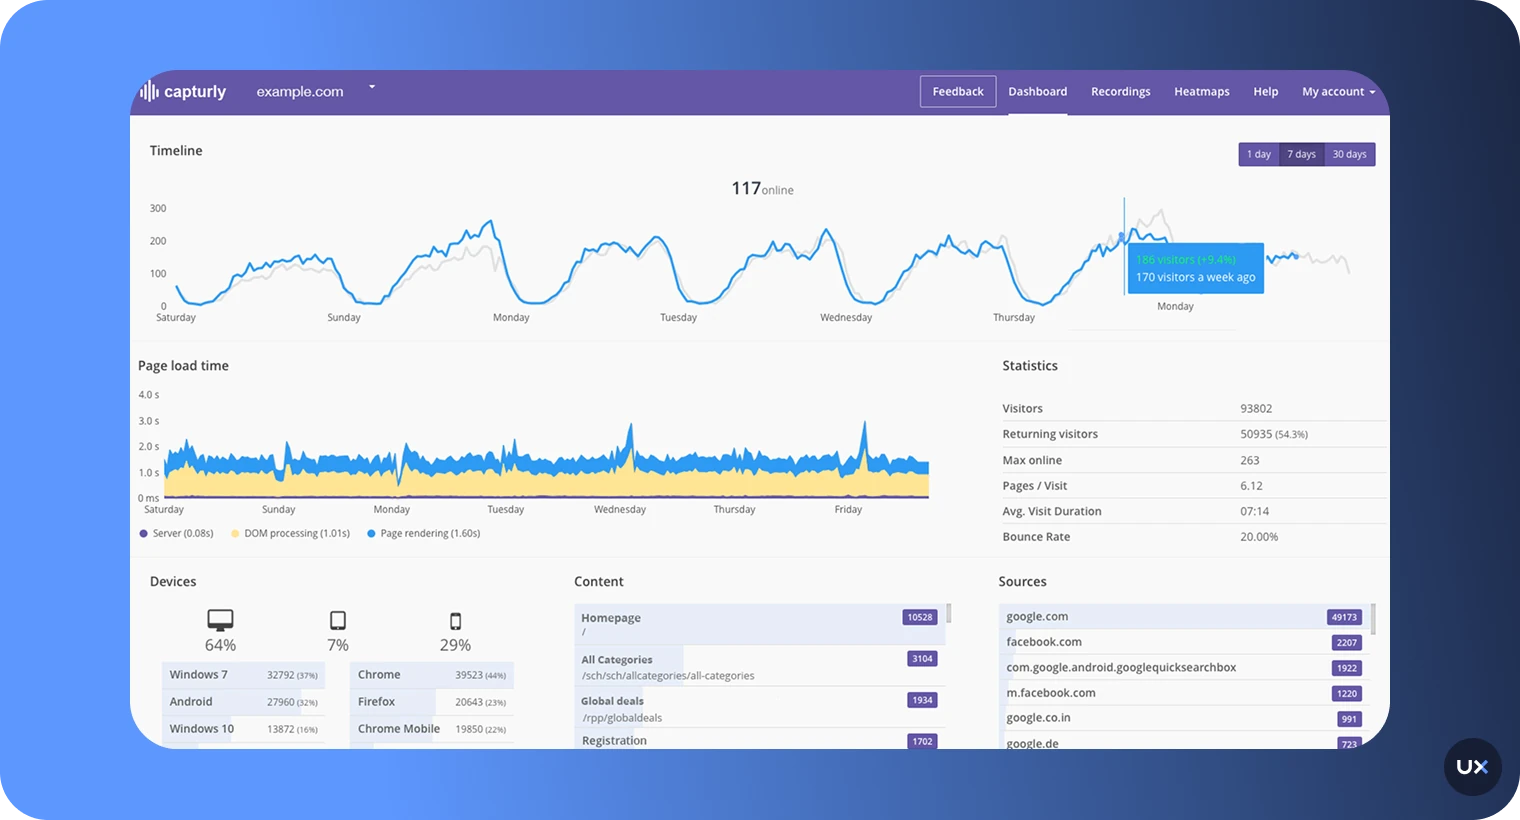
Key features
Heatmaps: Offers click, scroll, and segment heatmaps.
Session replay: Allows seeing your website through your visitors' eyes to uncover frustrations.
Conversion funnels: Helps decipher the buyer's journey and pinpoint where potential revenue is lost.
Event analytics: Tracks user engagements like clicks and video plays across all pages.
Analytics platform: Combines hard data with behavioral insights in one place.
Pros
Provides a simple, all-in-one analytics solution for websites.
Features straightforward and easy-to-understand heatmaps.
Offers both a free plan and a free trial.
Affordable starting price for paid plans.
Heatmaps are generated automatically from past visitor data after installation.
Cons
Web only.
The heatmap features are less comprehensive than specialized tools like Plerdy or Mouseflow.
The primary focus is on standard web CRO rather than deep UX analysis.
Segmentation capabilities are basic compared to enterprise tools.
Lacks advanced AI features for automated insights.
Pricing
Capturly offers a free trial with 1,000 recorded sessions monthly. Paid plans start at $29/month with 14 day trial.
14. Microsoft Clarity
Microsoft Clarity is a powerful, completely free analytics product that offers unlimited heatmaps and session recordings for websites. It is noted for its minimal performance impact, making it an excellent choice for businesses with tight budgets or low-to-midsize traffic. It lacks the advanced segmentation of paid tools but is unbeatable for its price.


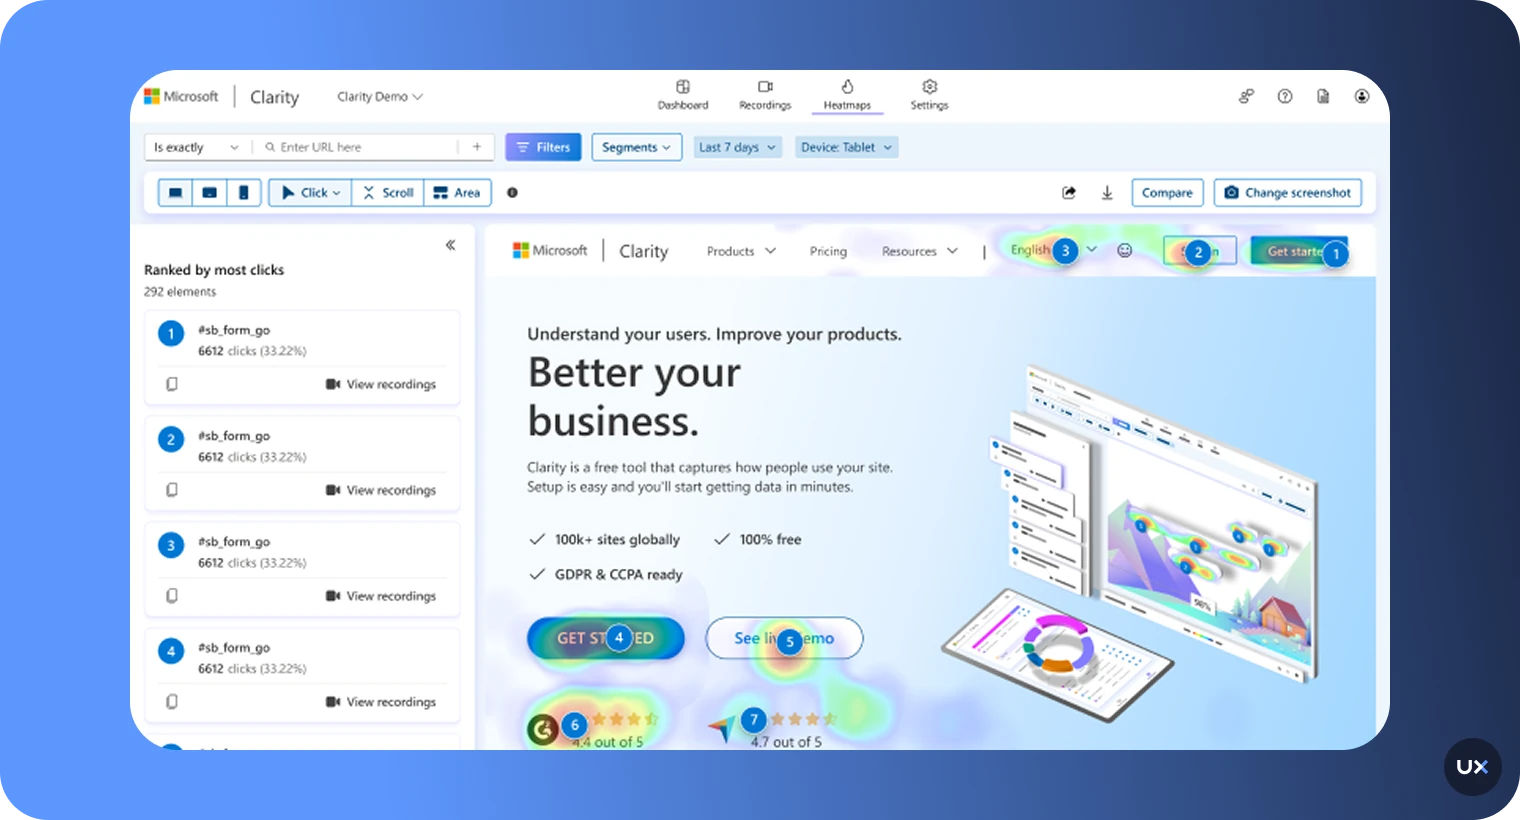
Key features
Heatmaps and ression recordings: Tracks mouse movements, clicks, scrolls on web, and taps/gestures on mobile apps, with no limits on traffic or sessions.
Mobile SDKs: Provides SDKs for native Android, iOS, Flutter, React Native, Ionic, and Cordova.
Frustration signals: Automatically highlights friction points like Rage Clicks/Dead Taps in heatmaps and recordings.
Copilot AI: Offers AI-generated summaries of session recordings and heatmap data.
Performance-safe: Designed to be lightweight and fast with a minimal overhead on app performance.
Pros
Completely free forever with no limits on traffic or sampling for both web and mobile apps.
Supports a wide range of mobile and cross-platform frameworks.
Minimal performance impact (lightweight SDKs) on both websites and apps.
Includes valuable frustration signals like rage and dead taps on mobile.
Easy to set up and use with a focus on privacy (GDPR and CCPA compliant).
Cons
Lacks the depth of funnel and retention analytics found in product-focused tools (like UXCam).
Segmentation capabilities are basic compared to enterprise-level tools.
Does not include advanced CRO features like A/B testing or form analytics.
Some advanced mobile features are still in development for certain SDKs.
The heatmap and mobile screen view data are limited to 100,000 screen views per heatmap
Pricing
Microsoft Clarity is available free of cost with unlimited usage.
15. LogRocket
LogRocket is an analytics platform that combines session replay, performance monitoring, and product analytics into one tool. It provides a full view of the user experience by linking front-end performance issues, JavaScript errors, and network failures directly to user sessions and heatmaps, making it a favorite for engineering and development teams.


Key features
Session Replay with DevTools: Replays user sessions while showing network logs, console logs, and stack traces alongside the screen.
Heatmaps: Visualizes clicks and attention on web and mobile apps.
Performance monitoring: Automatically detects slow pages, network issues, and crashes.
Error tracking: Provides full context for every JavaScript error, crash, and bug.
Alerts and metrics: Customizable alerts based on user behavior and performance thresholds.
Pros
Excellent for debugging and performance monitoring,
Deep technical context alongside behavioral data.
Combines behavioral analytics with the data developers need (network, console, code errors).
Supports both web and mobile applications.
Allows teams to proactively monitor and fix bugs that frustrate users.
Cons
The feature set is heavily technical, which may introduce a steep learning curve for pure marketing or UX teams.
Pricing can quickly escalate due to the high volume of technical data captured.
The primary focus is on the technical health of the product, not just CRO.
Custom plan pricing is required for large-scale usage.
Lacks built-in survey or direct user feedback tools.
Pricing
LogRocket offers a free plan with 1,000 monthly recorded sessions monthly. Paid plans start at $69/month
Conclusion
The power of a heatmap tool lies in its ability to quickly visualize the what and then connect it to the why of user behavior. For teams managing websites, web apps, or mobile apps, an all-in-one platform is essential for a unified and complete view of the user journey.
If your goal is deep, cross-platform product and UX analysis—combining automatic data capture, AI-driven insights, and integrated debugging for both web and mobile apps—UXCam stands out as the comprehensive choice for product and development teams.
Ultimately, the right tool should not treat heatmaps as an add-on but as a core component of a larger analytics strategy, allowing you to move beyond assumptions and start making data-backed decisions that drive conversions and reduce churn.
You might also be interested in these;
Website Heatmap - Ultimate Guide
Best Product Analytics Software [2026]
What is Product Analytics? Guide, Tools & Best Practices


Related articles


Product Management
13 Best Product Management Tools 2026 & When to Use Them
Find out the top tools that the best product managers use daily to perform better at...


Jane Leung
Product Analytics Expert


Curated List
As 14 Melhores Ferramentas de Análise Web em 2026
Descubra as melhores ferramentas de análise web. Quer melhorar a experiência do usuário no seu site? Saiba quais são os recursos indispensáveis para uma análise web...


Jonas Kurzweg
Product Analytics Expert


Curated List
12 Best Customer Analytics Tools and Platforms 2026
In this article, we've compiled a list of customer analytics tools trusted by thousands of businesses worldwide and insights to help you select one that best suits your...


Tope Longe
Product Analytics Expert