


Mobile product teams have plenty of data on user behavior. In fact, the amount of data mobile apps generate can sometimes be a problem in itself—it’s hard to recognize issues in a sea of numbers.
Heatmap analysis is one way to surface key trends from a massive set of data points.
It’s a form of product analytics that points you toward meaningful questions that can be tested and iterated into impactful product improvements. And in this UXCam guide, we’ll show you exactly how to conduct a heatmap analysis for your mobile app.
How to use heatmap analysis to get actionable app insights
Get the right heatmap tool
Choose a research question
Segment the data
Analyze your heatmaps
What is a heat map analysis?
Heatmaps are data visualizations that use color as a stand-in for numerical value. Generally, warmer colors (i.e., reds) indicate higher values, while colder colors (i.e., blues) indicate lower values (hence the name heatmap).
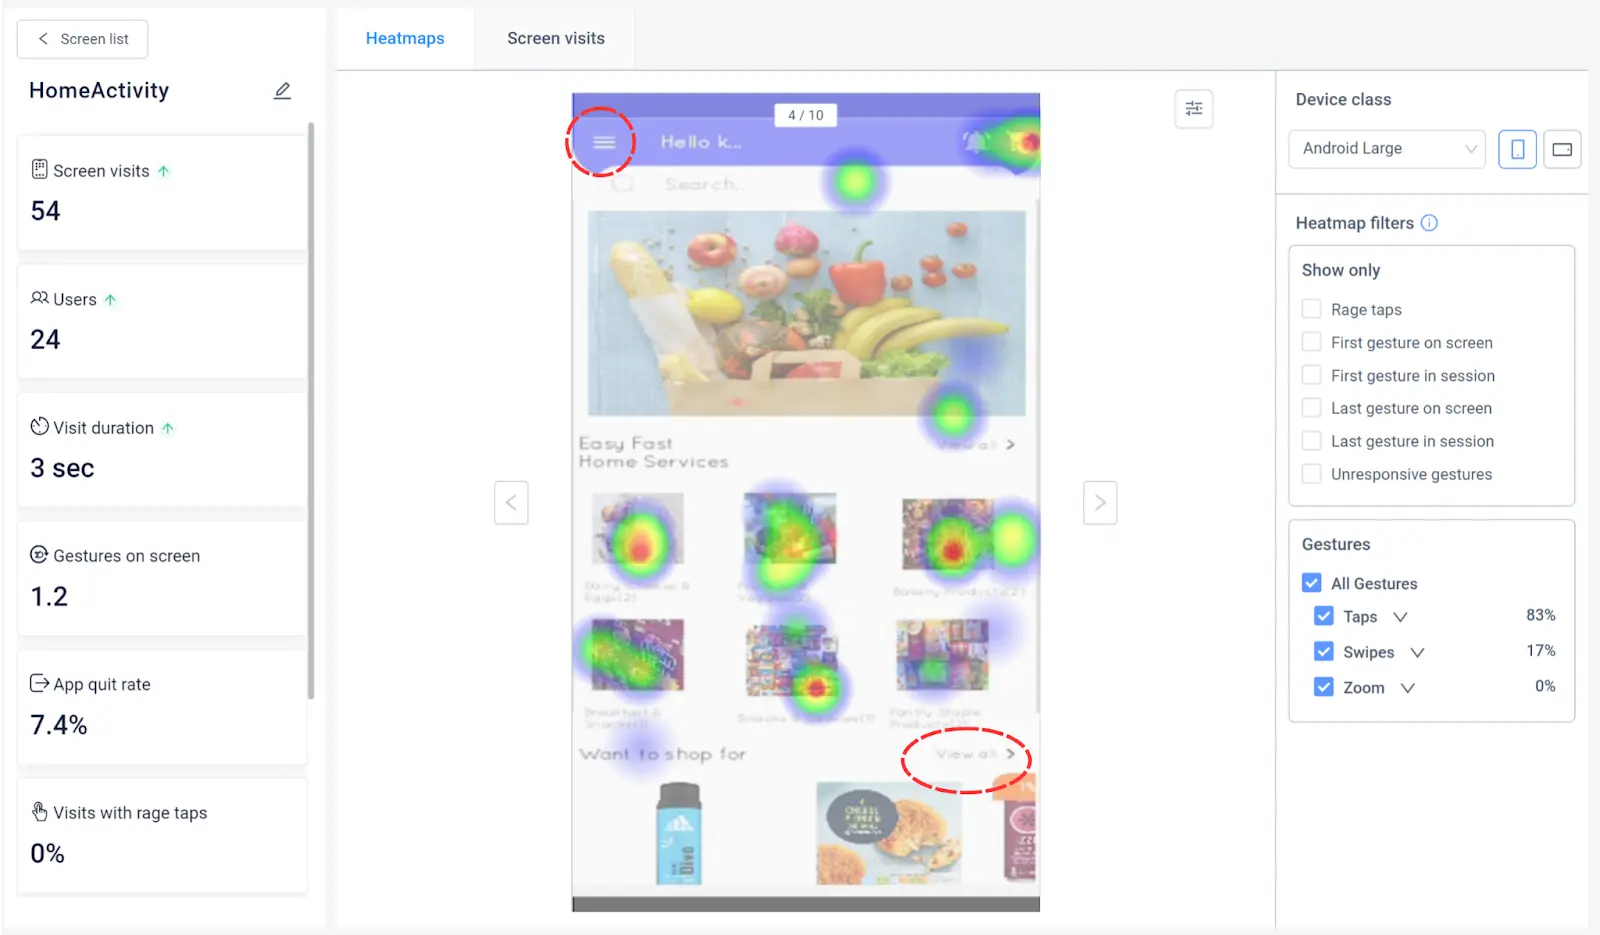
In the image below, we’re looking at a heatmap of rage taps on an app screen.


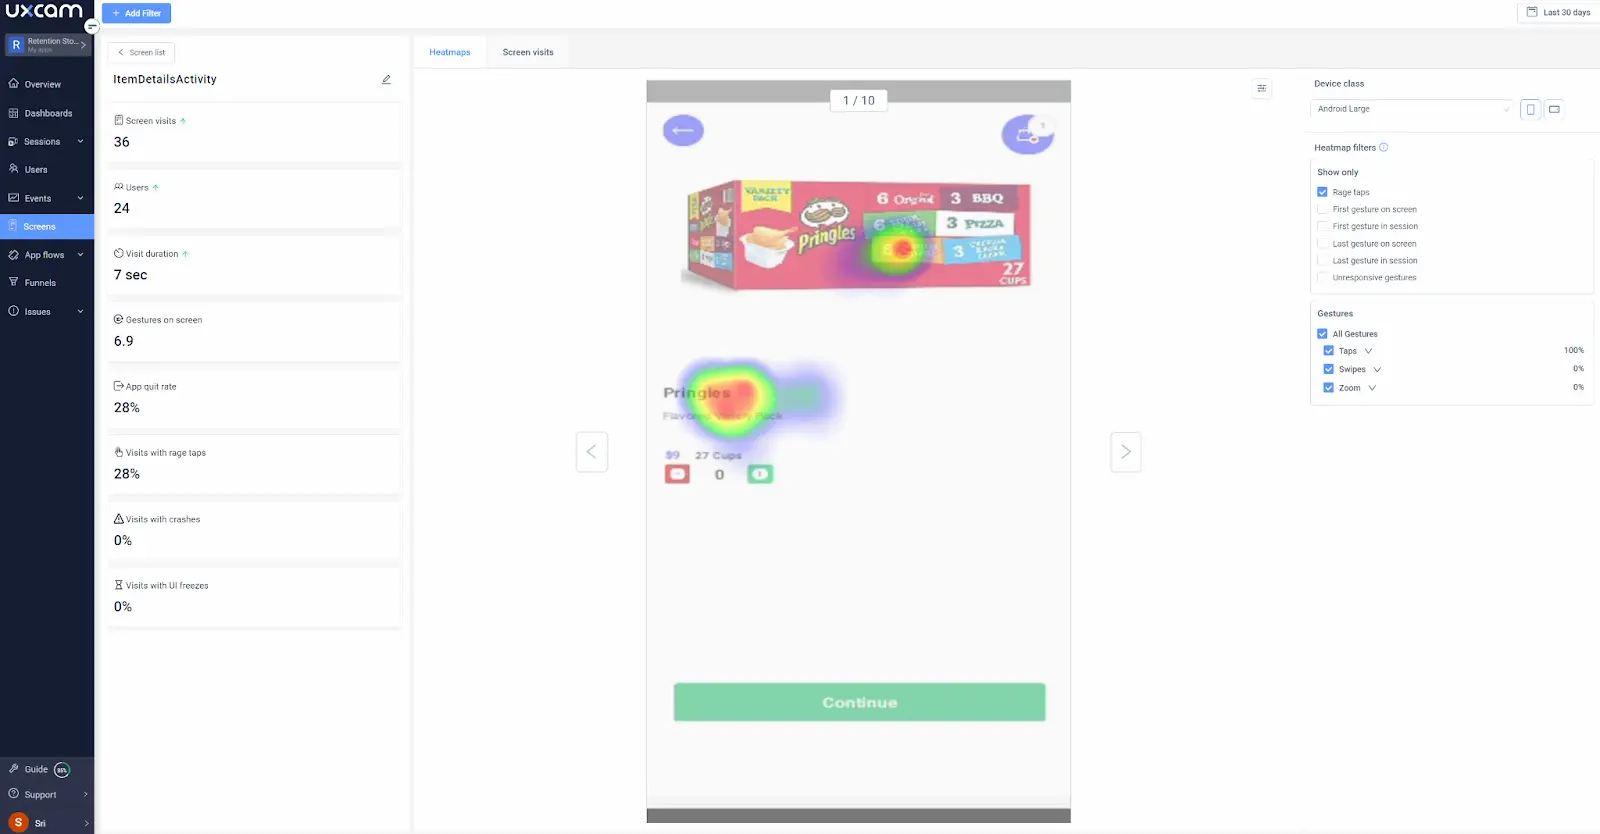
Red regions saw more rage taps, while yellow, green, and blue regions saw fewer. We generate a similar heatmap using all kinds of data points, including:
taps
scrolls
zooms
first touches
last touches
long presses
Heatmap analysis is the process of using heatmaps like the one above to uncover actionable insights into feature usage, roadblocks, user engagement, and user experience.
Don’t worry—we’ll unpack the entire process below. But as a quick example of heatmap analysis in action, consider the image above. Why might so many users be rage-tapping on product images? Are they expecting functionality that isn’t there? Are they unhappy with the image size or quality?
It’s these kinds of targeted, testable questions that make heatmap analysis so powerful.
Why is heatmap analysis important?
Optimize your app’s UI
Heatmaps give you a visual representation of how users interact with your app. This information allows you to make tweaks and optimizations that can lead to improved user experience.
Identify UX bottlenecks
UX bottlenecks are interface elements or features that make moving through an app difficult for users. They can be anything from unintuitive navigation to tiny buttons that derail a customer’s product journey. Heatmap analysis allows you to identify these bottlenecks to make improvements quickly.
Improve key conversion
Similarly, heatmaps allow you to track conversions and identify where customers are dropping off. This can help you pinpoint areas of the user experience that need improvement to drive higher conversion rates.
How to analyze mobile app heatmaps
1. Choose the right heatmap tool
To start generating heatmaps, you’ll need a tool. Not just any heatmap tool will do—you need a mobile app heatmaps tool that integrates with your platform of choice.
UXCam is an all-in-one mobile app analytics platform that offers heatmaps for apps created on a range of platforms, including:
iOS
Android
React
Cordova
Xamarin
Flutter
Nativescript


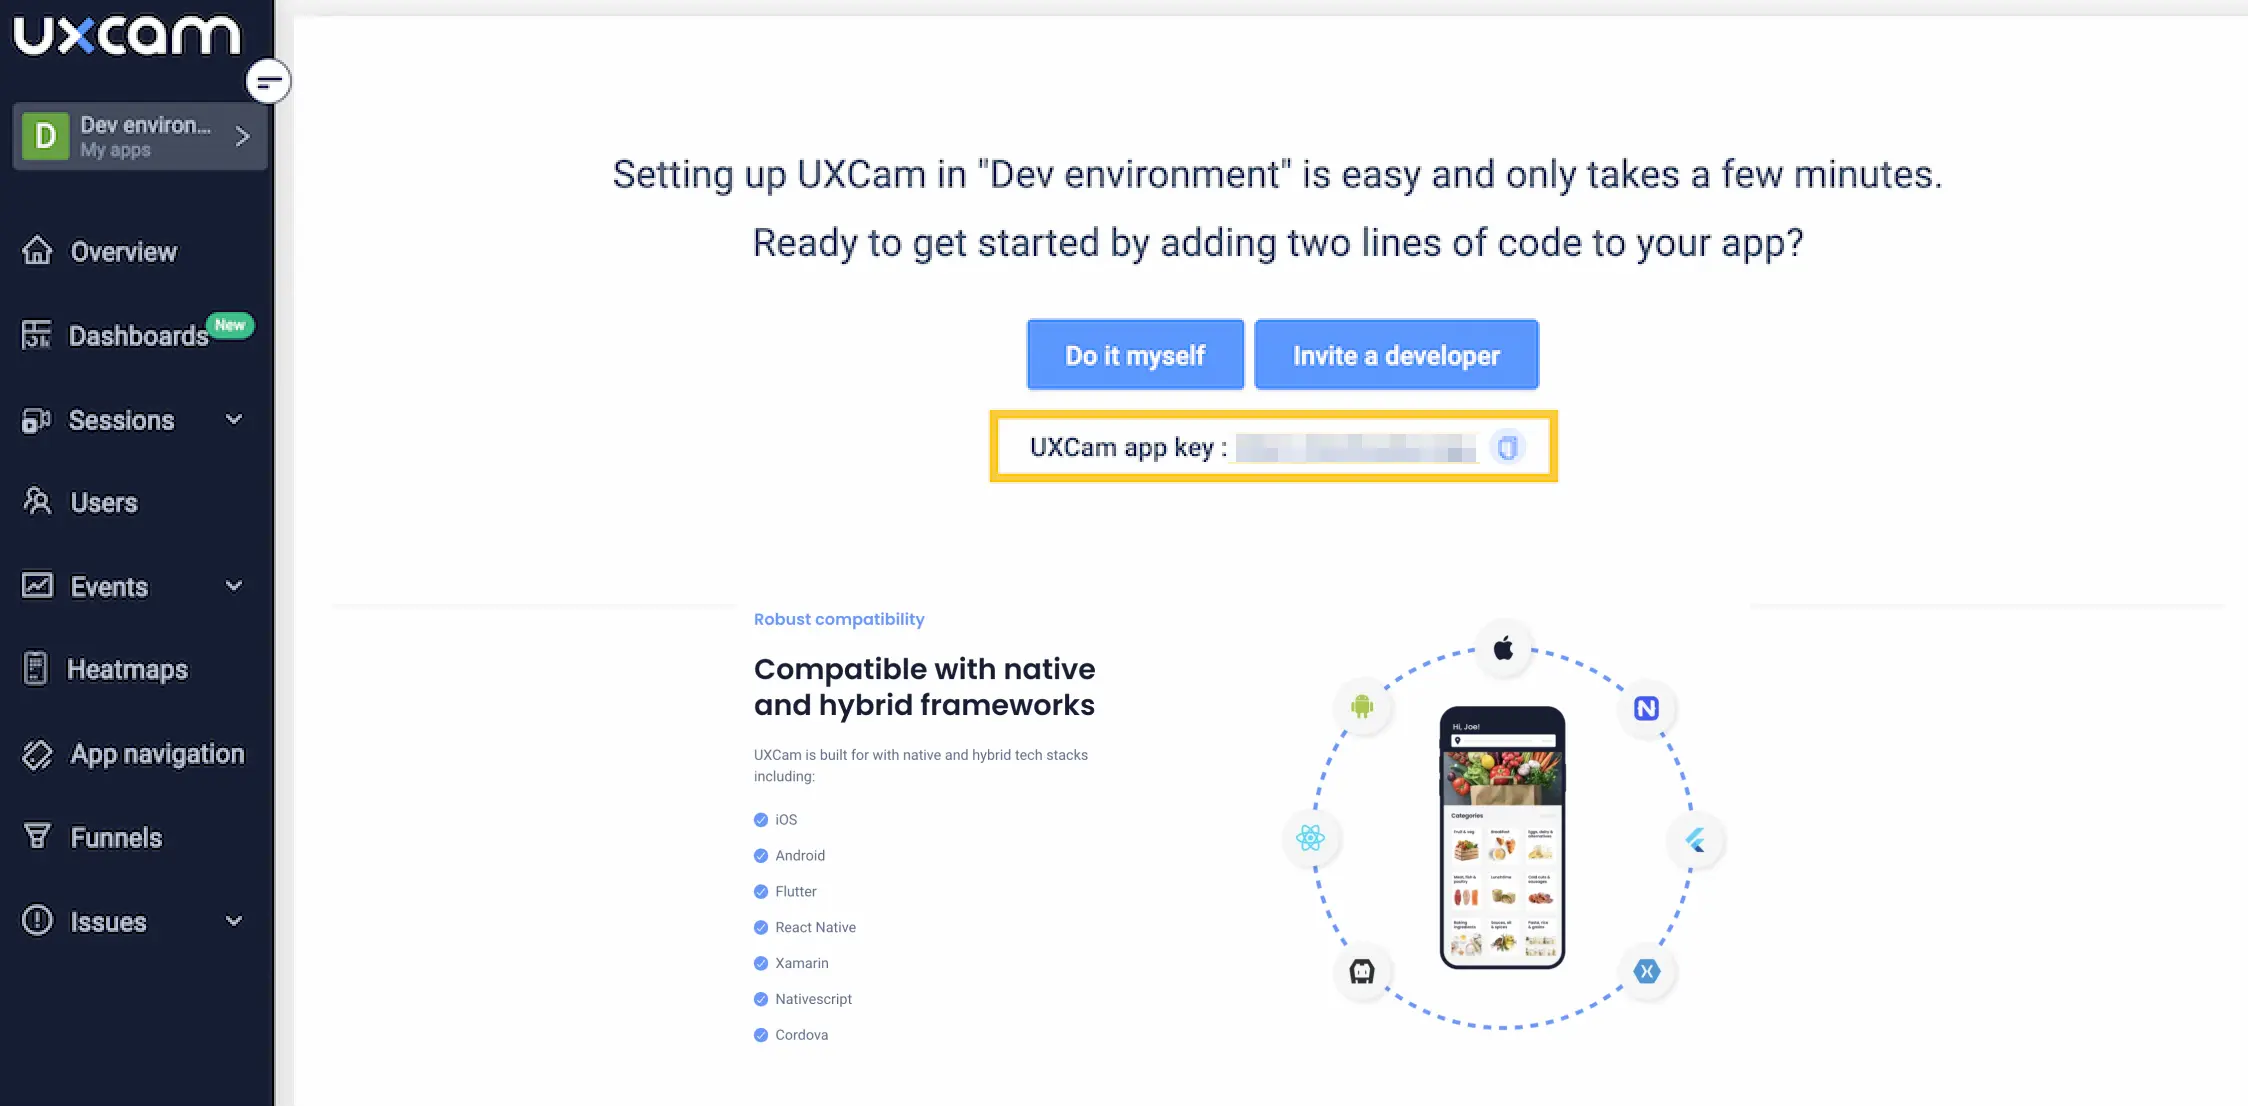
All you need to do is install a single code snippet, and your Overview dashboard will start displaying user behavior data, metrics, and KPIs.


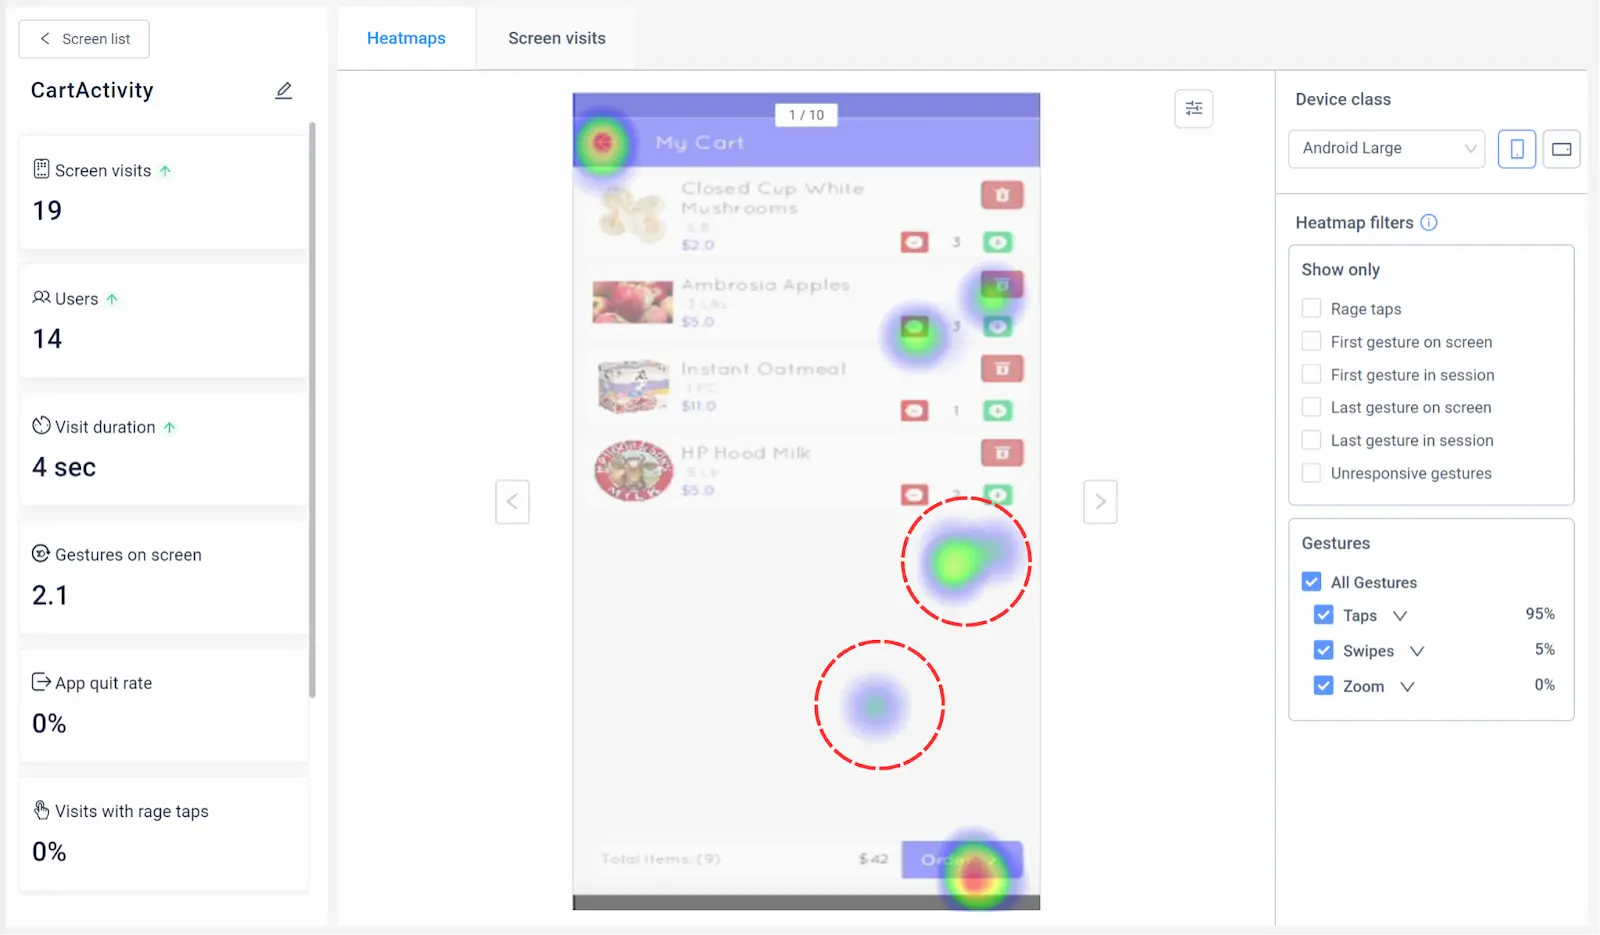
Navigating to the Screens will show you a list of app screens ordered by the number of sessions engaged with them.


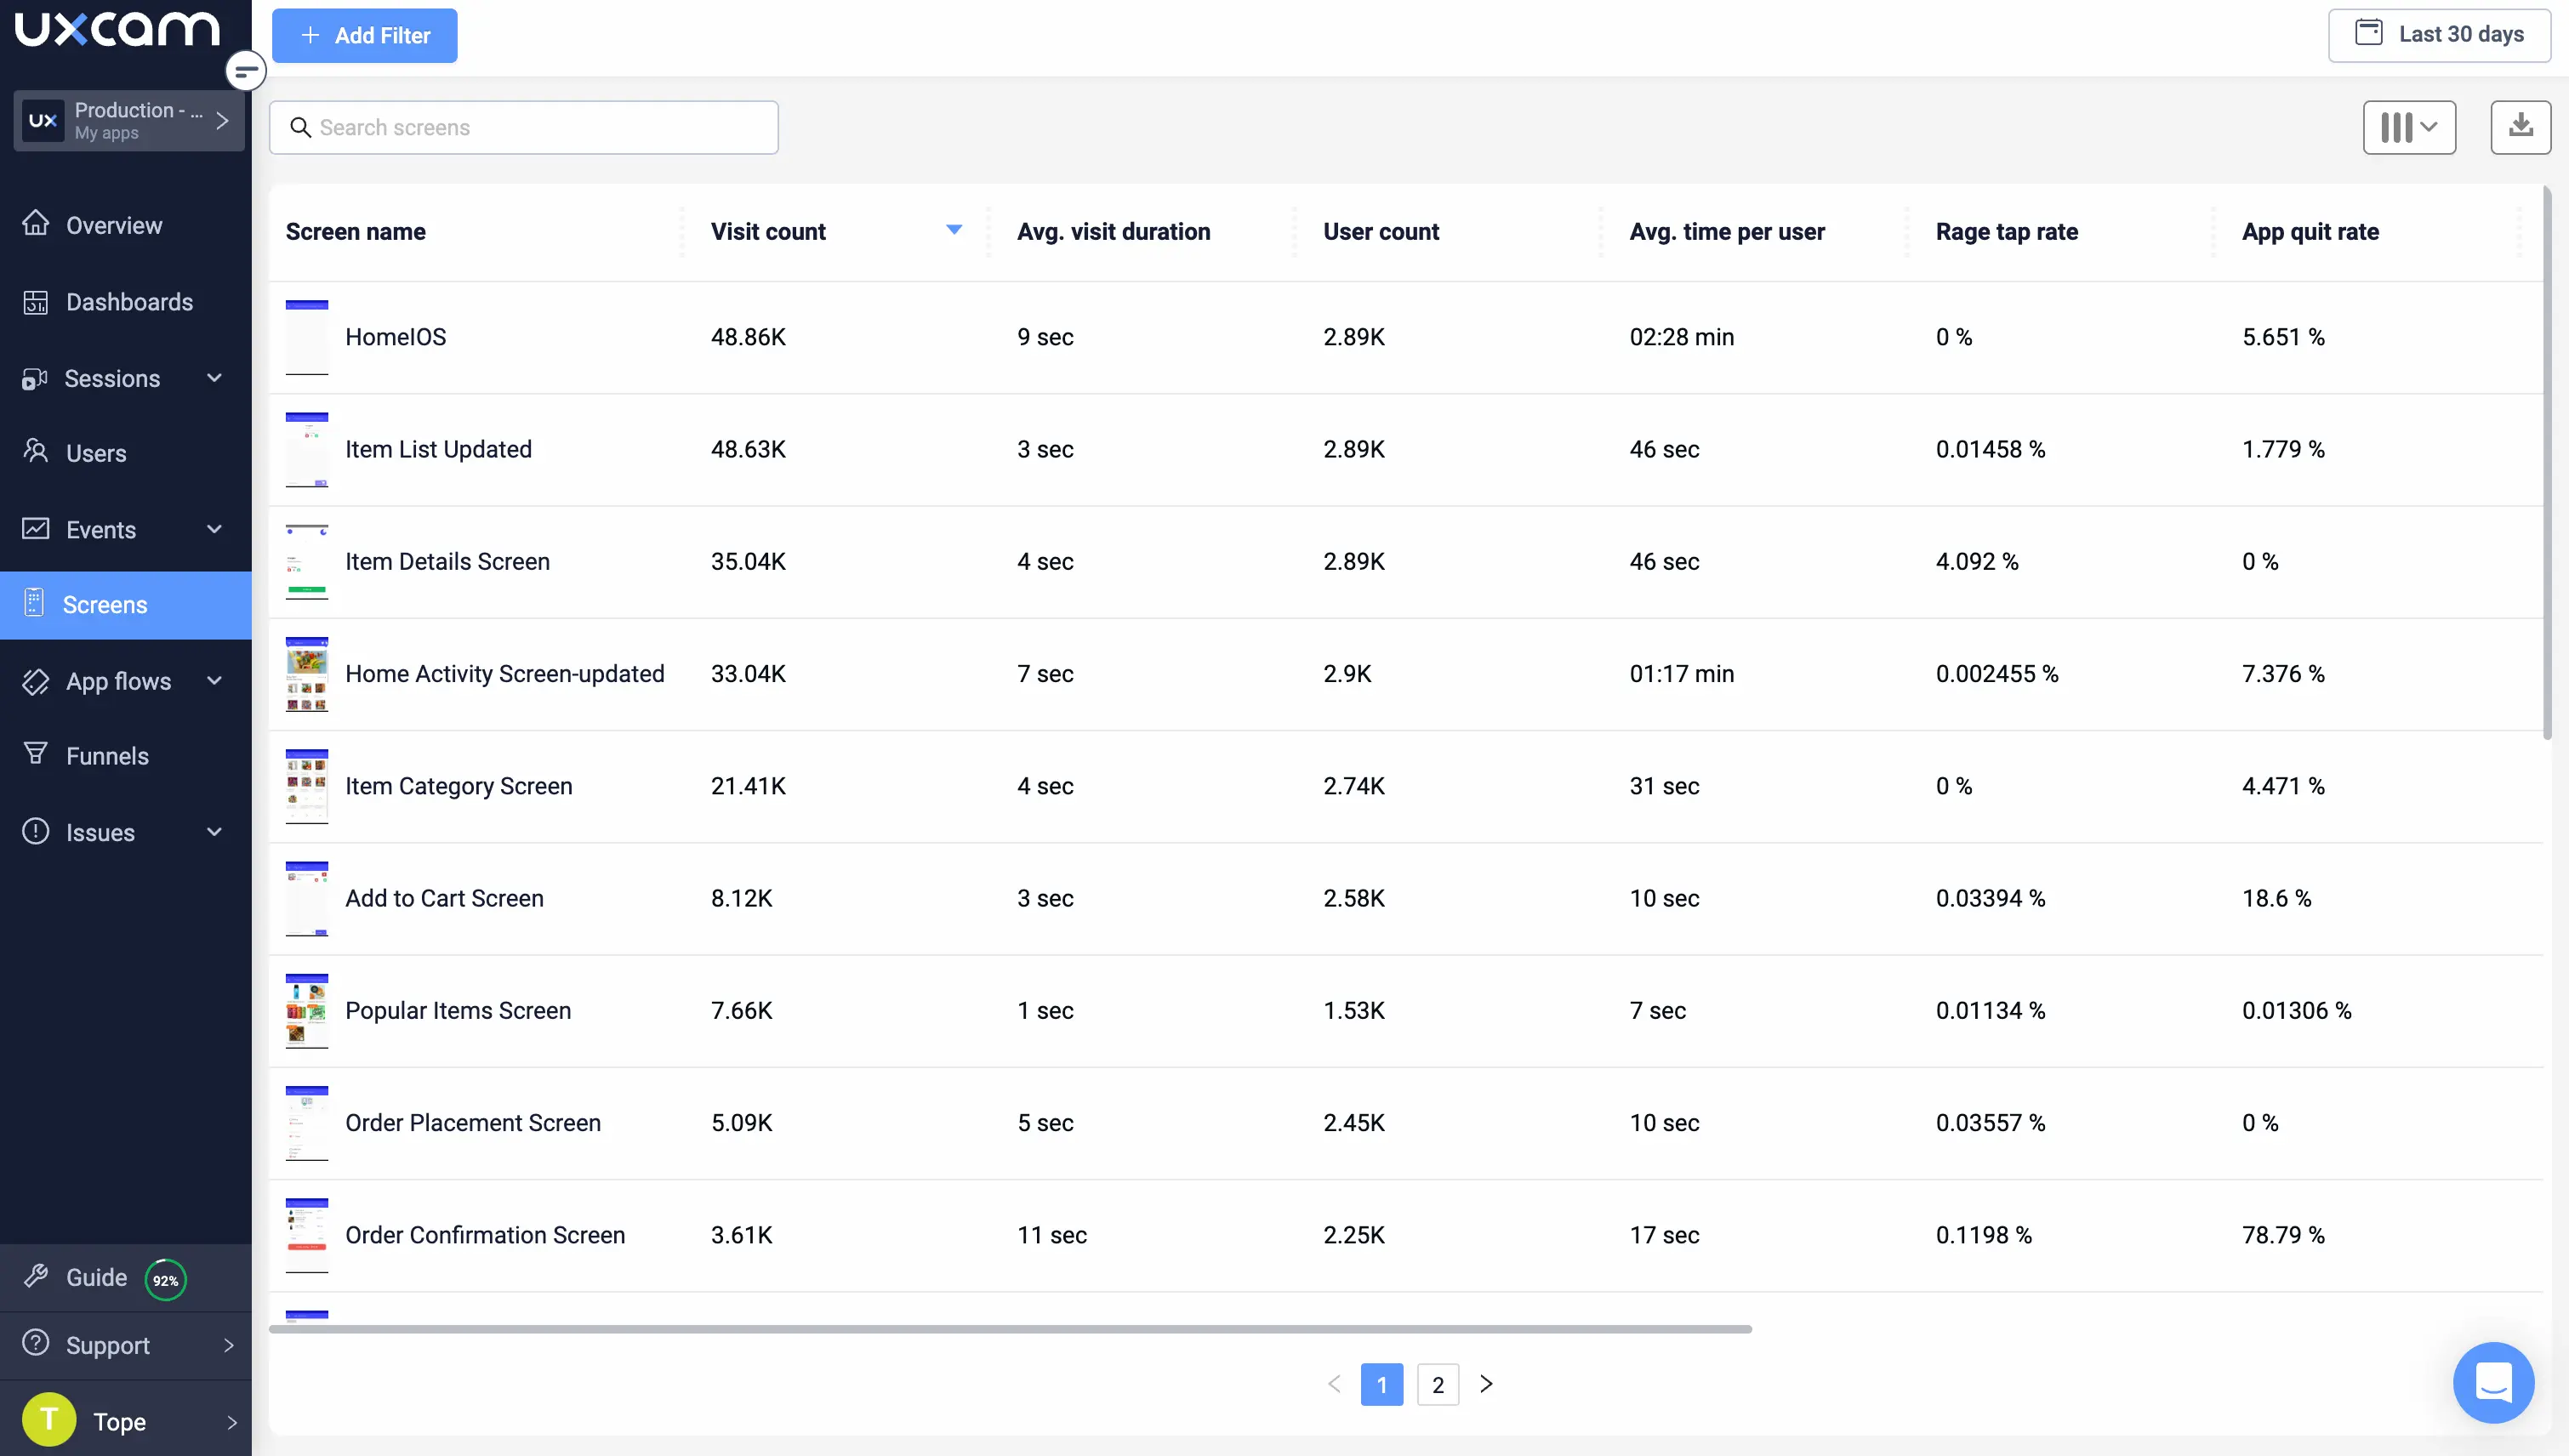
Clicking on any of these app screens will open up a heatmap you can analyze, filter, and segment (more on that later)—it’s that easy.
2. Choose a research question
You now know how to generate heat maps, though we need to do some work before we can start analyzing them.
We first need to define an area of interest—some problem we want to solve or a hypothesis we want to test. What’s the best way to do this? Review your product analytics tool to look for metrics and KPIs that need improvement.
With a tool like UXCam, you can automatically track and record a wide range of in-app KPIs like:
screen flows
conversion rates
retention rates
sessions & session length
gestures & interactions
For example, say you notice that conversions are down following an update. Well, you probably want to figure out why that’s happening so you can address it. The research question practically writes itself—what is causing conversion rates to drop by X%?
Starting with a straightforward question helps you narrow in on the data that’s really important.
3. Segment the data
As discussed above, product analytics tools like UXCam allow you to collect tons of app data.
But not all of that data is relevant to every research question—and if you don’t have the tools to find valuable data, yielding meaningful insights will be a real challenge. Segmentation is the key to unlocking valuable data from your product analytics. By segmenting users according to their behaviors, you can uncover meaningful insights from the data that would otherwise be difficult to identify.
For example, if your research question is about what UI elements lead to longer sessions, you can create segments for sessions of different lengths—short sessions (<10 minutes), moderate-length sessions (10–20 minutes), and long sessions (>20 minutes). Then, you can explore heatmaps for each segment to see what patterns emerge.
Fortunately, UXCam makes this easy. You can segment and filter your data by any user or session trait—device type, gestures, screens, events, and more. Any session you create can be saved for easy access and applied with a single click to any UXCam visualization (including heatmaps).
4. Analyze your heatmaps
Finally, it’s time to analyze.
While heatmaps rarely provide definitive answers to your research questions, they’re great for zeroing in on areas of interest and forming hypotheses. So, what are you looking for exactly?
There are a few common patterns to look out for:
Clusters of activity
These areas are getting the most attention from users. Do they align with what you see as important about a given app screen?


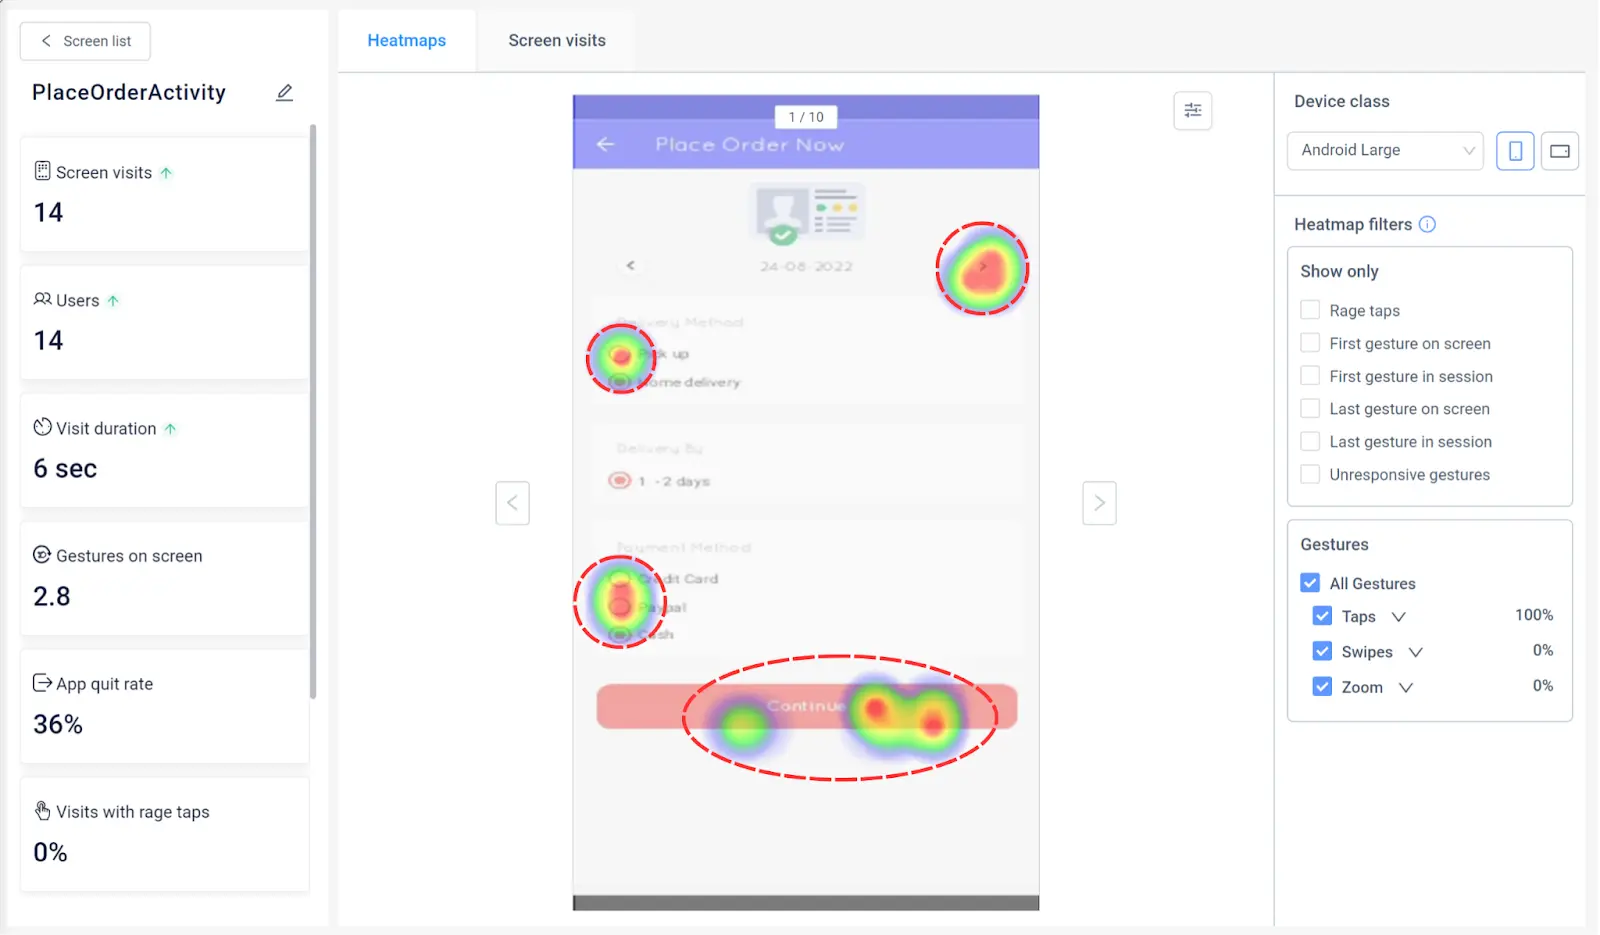
Areas with no activity
These can help you identify if users are missing out on critical information or features.


Unusual behavior
Spotting unexpected patterns or movements can be a great clue to potential usability issues.


Use heatmaps to understand your users
Heatmaps are a valuable tool for quickly identifying key user trends within your app.
Rather than focusing on individual users through tools like session replays and event analytics (both valuable in their own rights!), heatmaps give you a bird’s eye view. This perspective makes it easier to form meaningful hypotheses—the key to practical product experimentation.
If you’re looking for a mobile heatmap tool, look no further than UXCam. Our mobile heatmap solution delivers deep insights into user behavior and helps you make data-driven decisions quickly. Plus, it’s integrated with a suite of other valuable analytics and usability tools so that you can make the most out of your data!
Get started with a 14-day free trial today.
You might also be interested in these;
The Flutter mobile app heatmap tool: UXCam
Mobile app heatmaps: The ultimate guide
AUTHOR
Tope Longe
Product Analytics Expert
Ardent technophile exploring the world of mobile app product management at UXCam.


Related articles


Curated List
Best 15 Heatmap Analysis Tool for Web and Mobile Apps in 2026
Discover the best heatmap analysis tools and how these platforms help teams visualize user behavior and improve UX across mobile, web, and hybrid...


Begüm Aykut
Growth Marketing Manager


Heatmaps
Mobile App Heatmaps: Ultimate Guide 2026
Get a complete guide to mobile heatmaps, how they work, the gestures they track, and how to analyze them to improve...


Jonas Kurzweg
Product Analytics Expert


Heatmaps
Examples of Heat Maps and What the Data Means
Learn how to interpret mobile app heat maps, understand key patterns, and what the data reveals about user interactions and...
Tope Longe
Product Analytics Expert