How to do Cohort Analysis to Drive App Growth


TABLE OF CONTENTS
Wondering how to conduct cohort analysis for mobile app products?
Mobile app development is an industry that’s both dynamic and fiercely competitive, with a global user base exceeding 6.3 billion smartphone users. Meanwhile, a remarkable 88% of mobile usage is dedicated to apps, underscoring the significance of app development.
To engineer successful apps, a deep understanding of user behavior is indispensable. Cohort analysis serves as a powerful tool, providing valuable insights into user behavior patterns.
At UXCam, we understand the importance of leveraging the knowledge gained from cohort analysis to enhance user engagement and app performance. Hence, in this comprehensive guide, we will walk you through the step-by-step process of conducting cohort analysis, enriched with practical examples for mobile app developers.
Helpful summary
Overview: We explain exactly how to do cohort analysis in the context of mobile app development.
Why you can trust us: UXCam is a leading mobile analytics tool that has helped 37,000+ mobile product teams build better apps.
Why it matters: Cohort analysis is a powerful way to understand user behavior and identify areas for improvement in your app.
Action points: Choose a reliable mobile analytics tool (like UXCam) and use a range of analytics features to examine cohorts from all angles.
Further research: Check out our guide to conducting churn cohort analyses for more info.
Why listen to us?
UXCam is the go-to mobile app analytics platform for mobile product teams at Fortune 500 companies. We have tons of experience helping mobile app developers improve their app's user experience and performance through data-driven insights.
So without further ado, let's dive into the world of cohort analysis and discover how it can benefit your app development journey.
What is a cohort analysis?
Cohort analysis is an analytical tool that can help mobile app teams understand how a particular group of users behaves over time. This group (i.e., cohort) is defined by a shared characteristic or experience and a specific window of time.
For example, a cohort might be “Android users who downloaded our app in January 2024.” By analyzing this group's behavior, you can gain valuable insights into how they interact with your app, which features they use most often, and whether their engagement increases or decreases over time.
How to conduct a cohort analysis
Set up mobile app tracking
Define your cohorts
Save interesting cohorts
Analyze cohorts with other analytics tools
Interpret and analyze patterns
Step 1: Set up mobile app tracking
The first thing you need to do is set up tracking for your mobile app.
With UXCam, that’s as simple as creating a free account and installing our lightweight, Google-approved SDK. We use tagless autocapture to track every in-app interaction—no additional setup required.
That means you’re free to retroactively define and analyze cohorts to better understand your users.
Step 2: Define your cohorts
The next step is defining your cohorts. Like we mentioned earlier, you can define cohorts based on any event or action that you want to track—what makes it a cohort rather than a segment is the addition of a time component.
To define a cohort, you need to specify the event or action that will trigger the cohort, as well as the timeframe in which it needs to occur. For example, you could define a cohort of users who installed your app in January and made their first purchase within 30 days.
You can also add multiple criteria to further refine your cohorts—for example, you could create a cohort of users who installed your app in January AND are from a specific country. You can use UXCam’s retention report builder to define and track these cohorts over time.
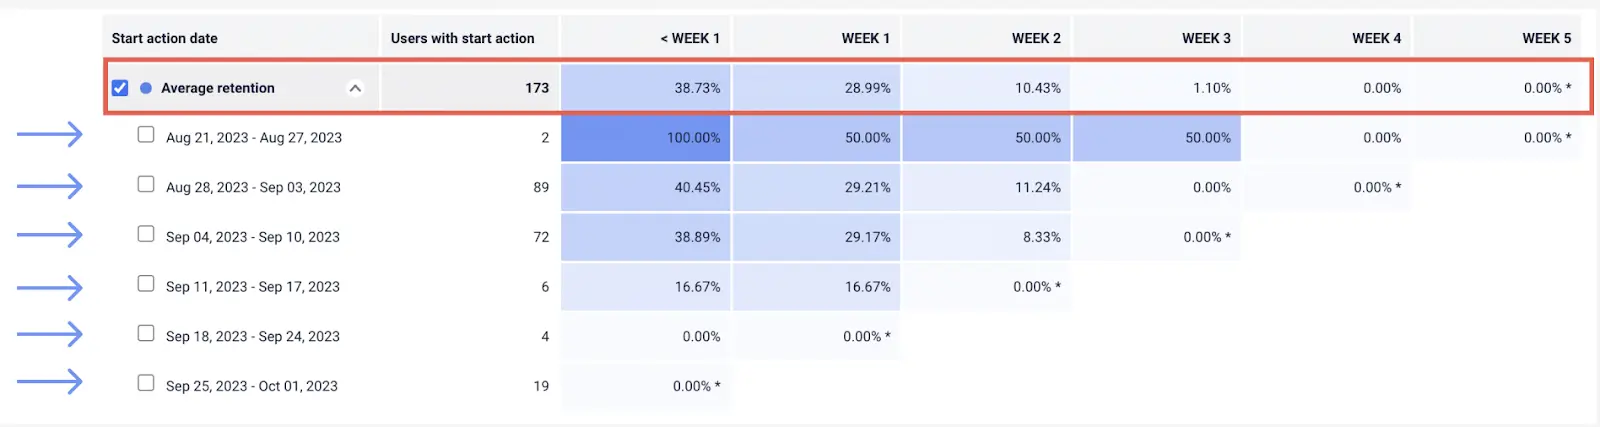
In the example below, row and cell represent a cohort.


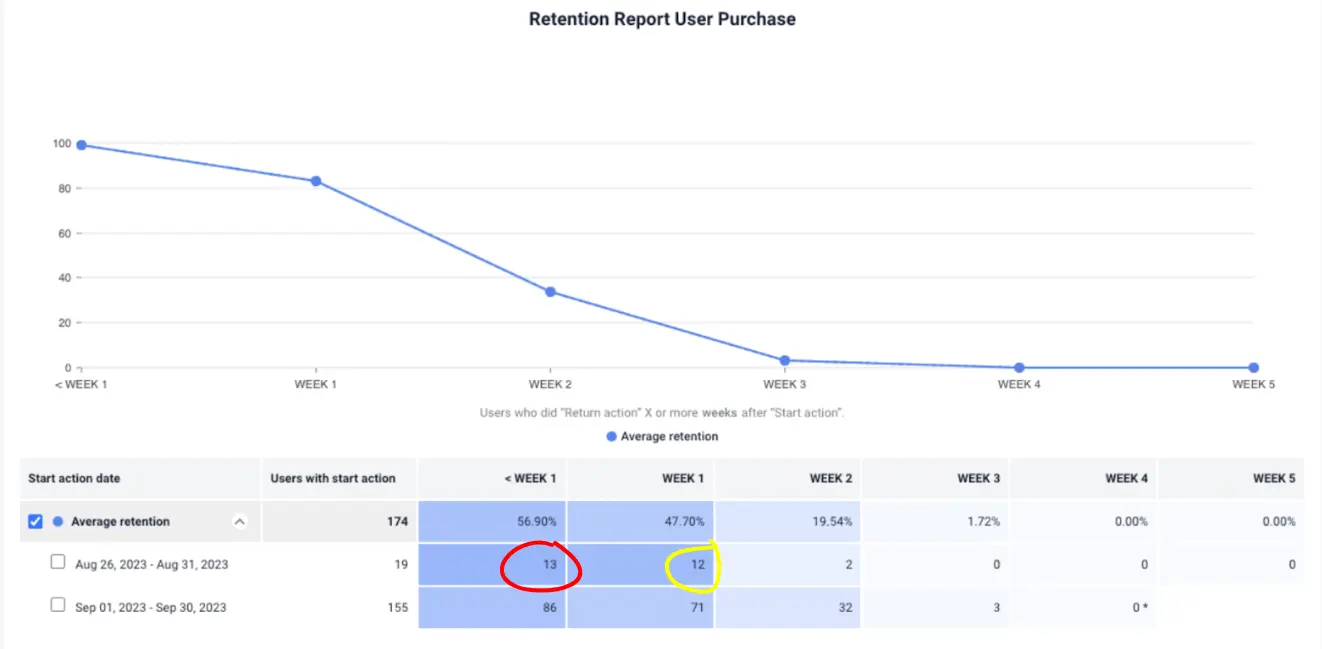
The cohort circled in red is “users that completed [start action] Aug. 26 to Aug. 31 AND completed [return action] in < 1 week”. The cohort circled in yellow is “users that completed [start action] Aug. 26 to Aug. 31 AND completed [return action] in 1 week”.
We can see that 1 user dropped out of the broader “users that completed [start action] Aug. 26 to Aug. 31” cohort between the first and second week.
Step 3: Save interesting cohorts
The next thing you’ll want to do is to save any cohorts that will help you answer the question(s) that motivated the cohort analysis.
Generally, there will be two kinds of potentially interesting cohorts:
Retained Cohorts: In our example above, the number in each cell is the number of users who completed the return action in a given period. We can save this cohort and apply it to other tools to understand why they returned.
Dropped-out Cohorts: Between two periods of time, there may be a cohort that dropped out (e.g., in our example, the users who completed the start action in Aug. 26 to Aug. 31 but did not complete the return action in 1 week). This cohort can also be saved and analyzed to understand why they dropped out.
Step 4: Analyze cohorts with other analytics tools
Now, it’s time to use your saved cohorts and dive deeper into their behavior. There are various analytics tools that can help you gain more insights into your cohorts.
With UXCam, this process is incredibly easy. Whenever you open one of our many analytics tools (more on those in a moment), you have the option to filter the data being displayed using segments, events, and yes—saved cohorts.
So, what kinds of analytics tools can you apply cohorts to? And what can you learn?
Here’s an overview along with some potential uses. But keep in mind, this is just the tip of the iceberg.
Session replays
Session replays give you a bird’s-eye view of how users interact with your website or app. With saved cohorts, you can analyze specific groups of users to understand their behavior in more detail.


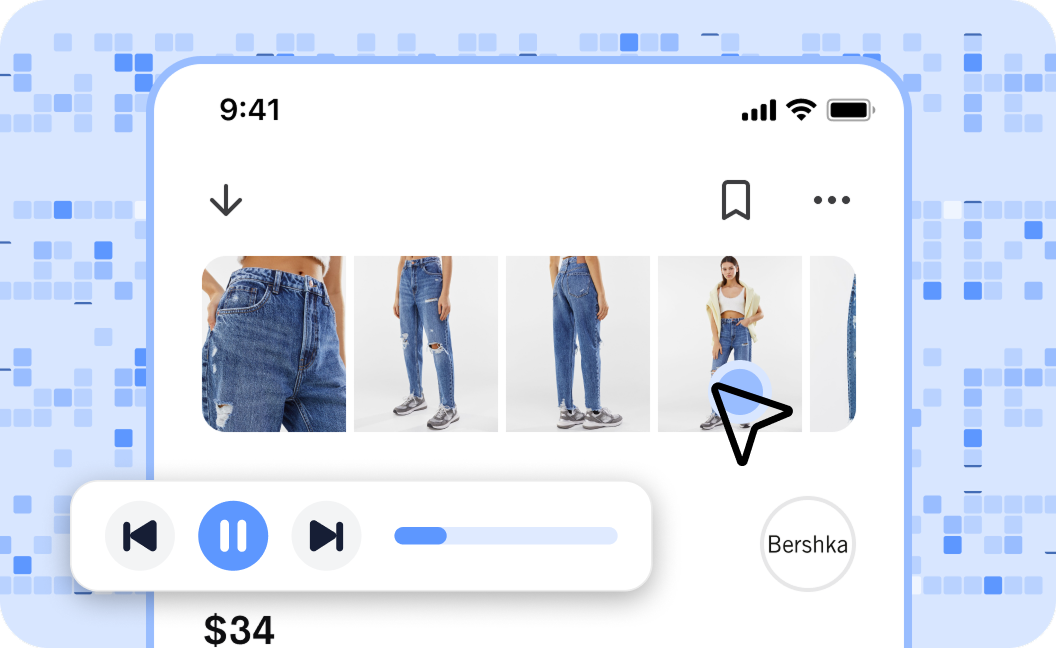
For example, if you want to see how new users are navigating through your onboarding process, you can filter for that cohort and watch their session replays. This can help identify any pain points or areas where they may be dropping off.
Heatmaps
Heatmaps are a powerful tool for visualizing patterns in behavior.


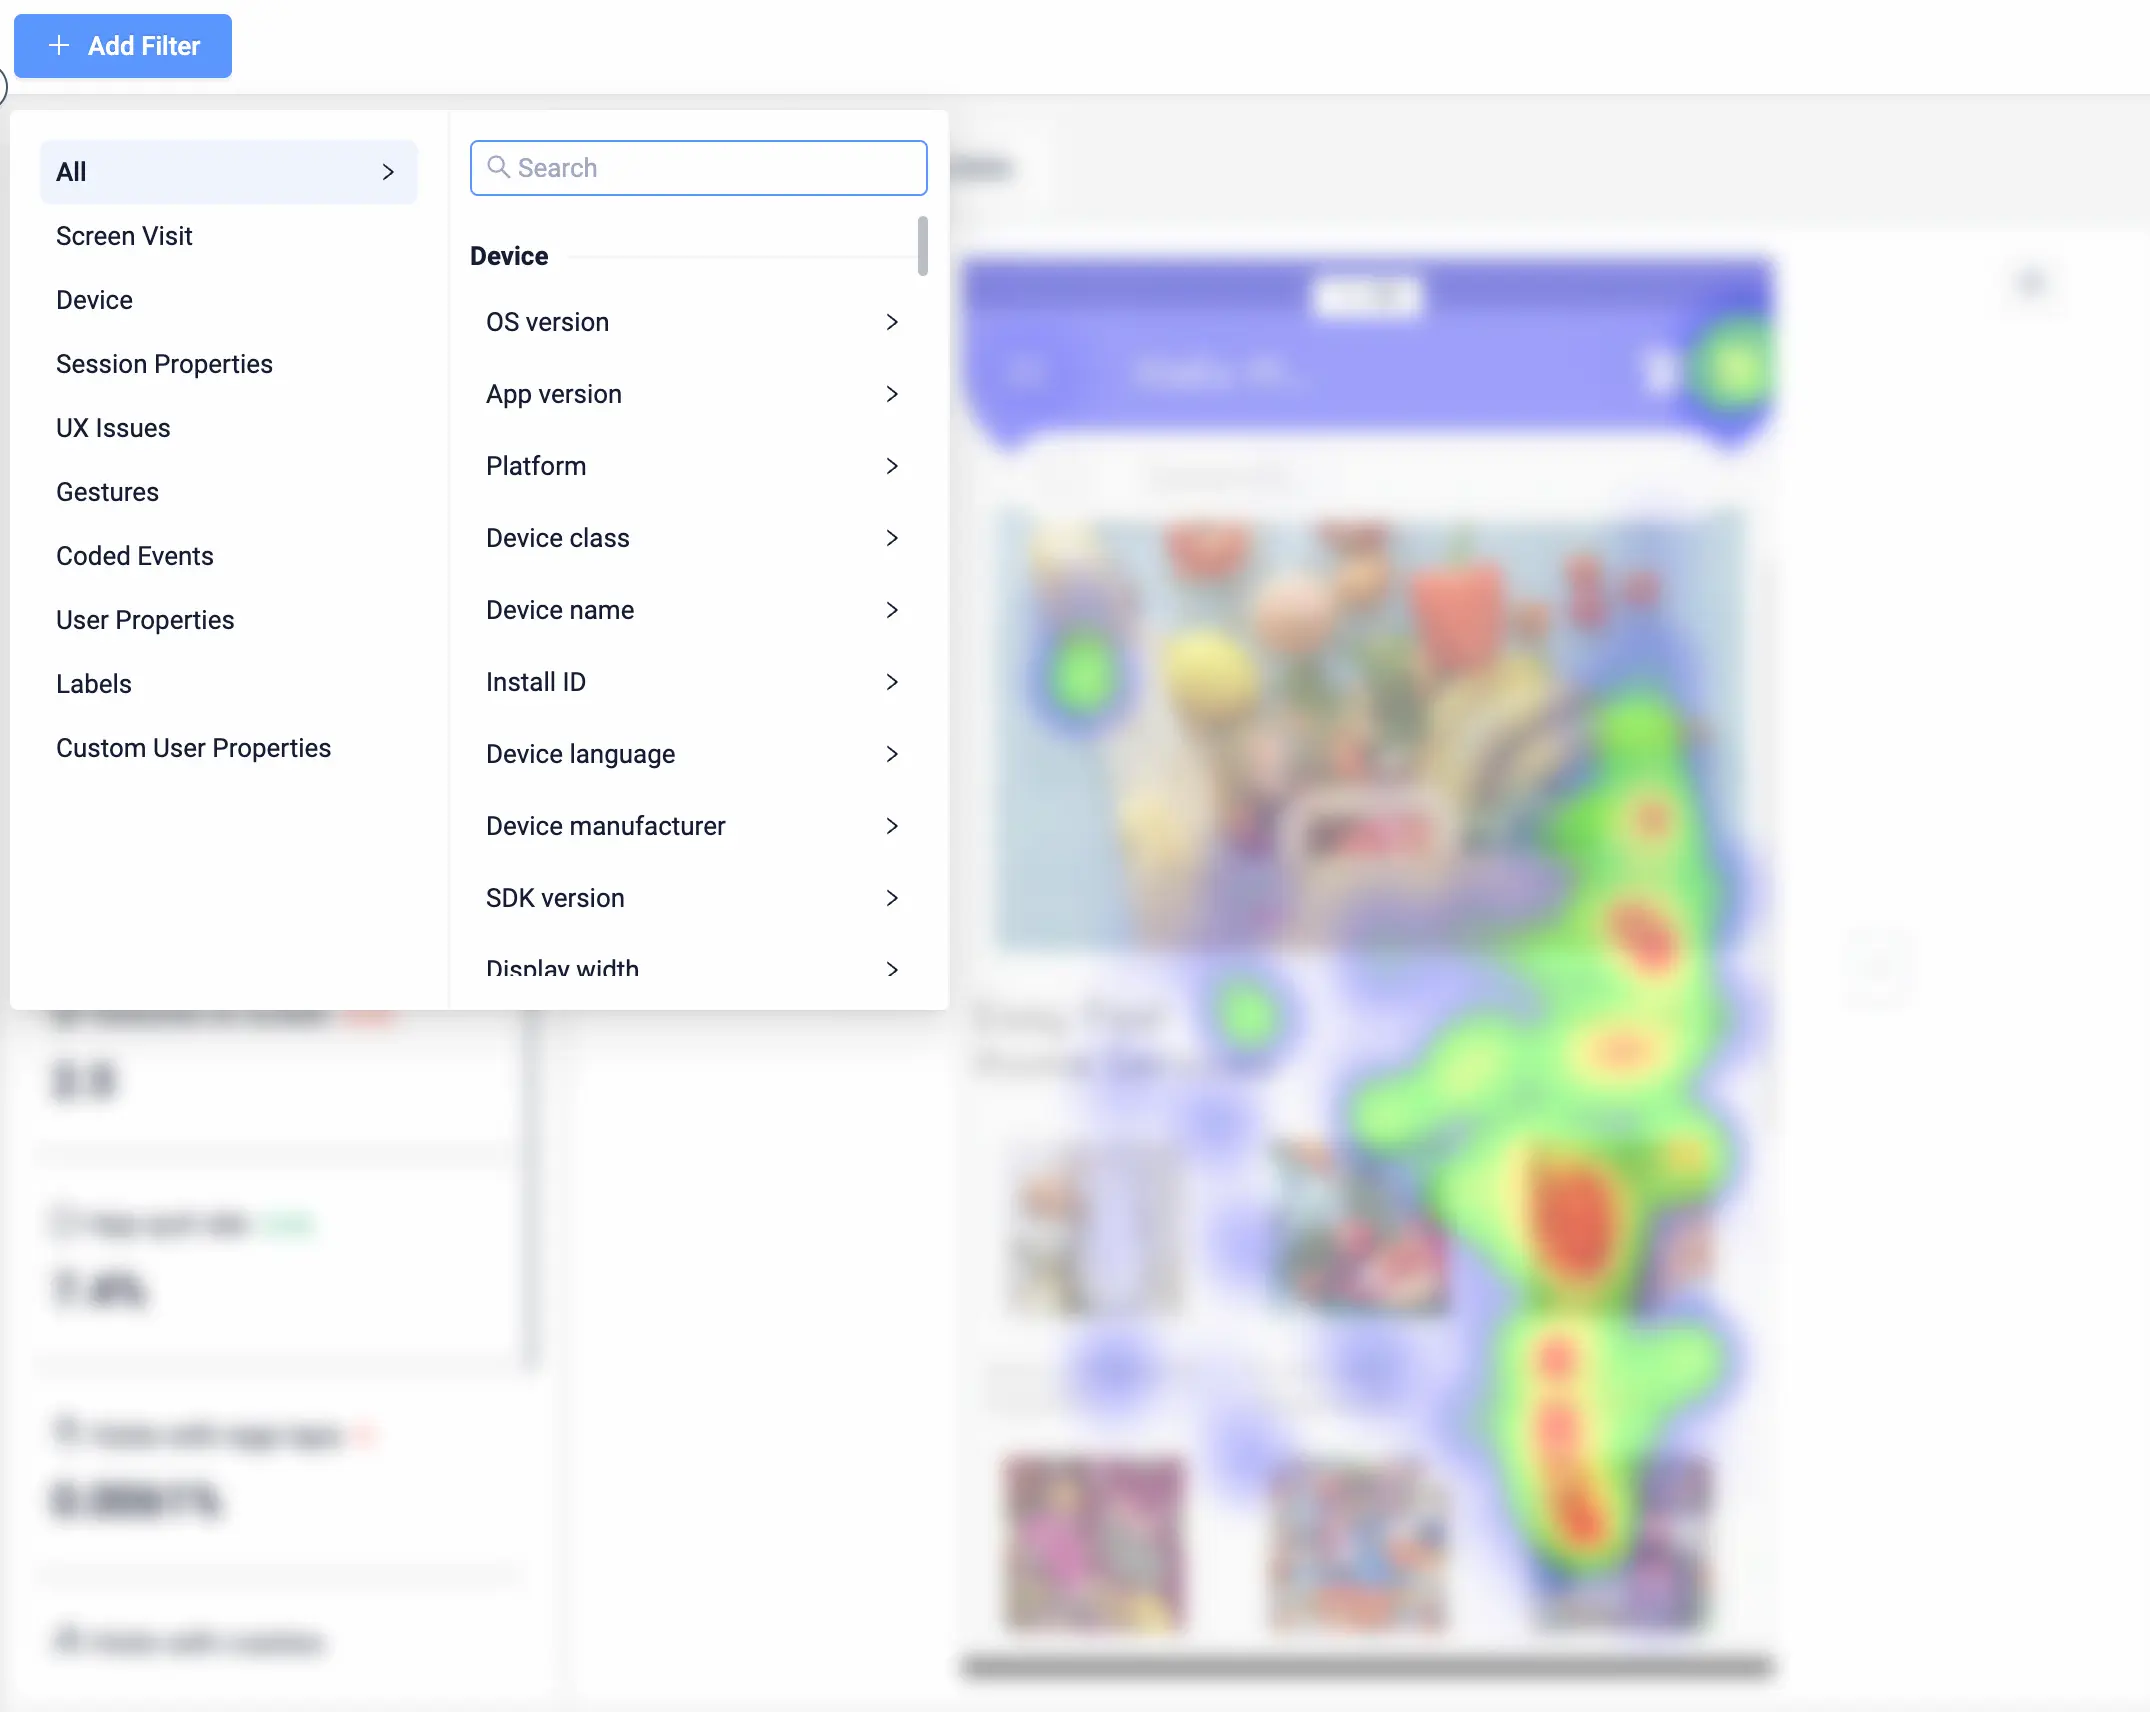
By adding a dropped-off cohort to a heatmap for a given screen, you can see whether there are any UI elements or features that they might be missing or passing over. Comparing your findings to a heatmap filtered with a retained cohort can validate those findings.
Conversion funnels
Track user drop-offs in specific processes, helping optimize those processes for better user engagement.
Below is an example of onboarding conversion analysis using UXCam’s cohort filters in the funnels.


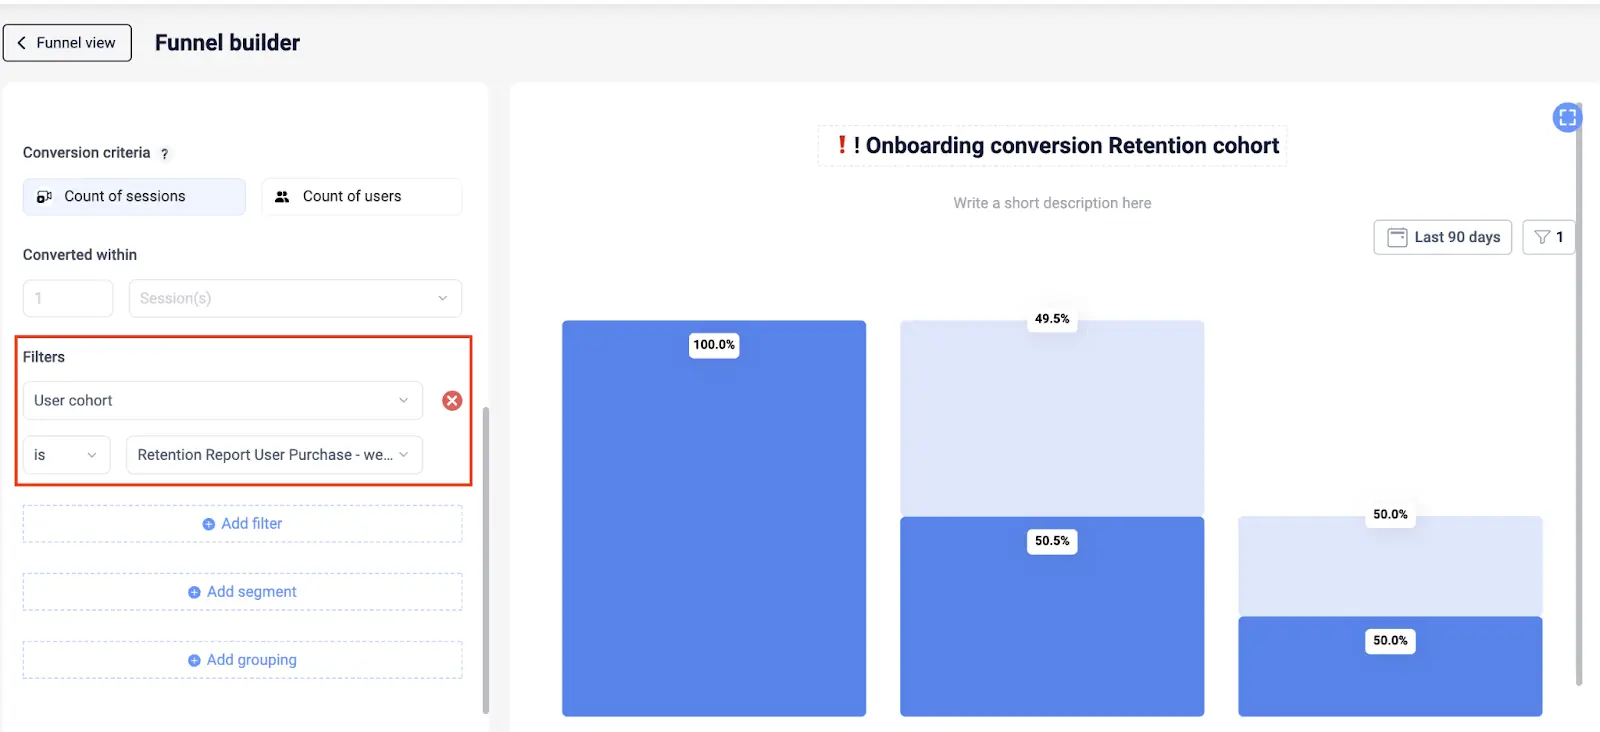
The user wants to compare the onboarding conversion of users who dropped out within the first week with those who were retained. They want to create separate funnels for dropped-out users and retained users to observe differences in behavior. Additionally, they want to evaluate whether completing the onboarding flow correlates with higher retention.
Step 5: Interpret and analyze patterns
Dig deeper into your cohort data to identify patterns and trends. Look for correlations between user behavior and specific events or changes in the app. This step requires a combination of statistical analysis and a keen understanding of your app's context.


When you notice patterns, think about what they might mean for your app and how you can use them to improve the user experience.
Conclusion
Cohort analysis is a game-changer for mobile app developers seeking to understand user behavior and drive app improvements. By following the step-by-step guide outlined above and integrating UXCam into your workflow, you can unlock a deeper understanding of user interactions.
Sign up now for free to get started.
You might also be interested in these;
Best cohort analysis tools for mobile app products
How to run an effective churn cohort analysis with UXCam
Behavioral cohort analysis - How to use them to improve UX
Top 9 mobile app retention strategies to enhance stickiness
AUTHOR
Tope Longe
Product Analytics Expert
Ardent technophile exploring the world of mobile app product management at UXCam.


TABLE OF CONTENTS


Related articles


Mobile app analytics
12 Mobile App Analytics Metrics That Actually Matter in 2026
Mobile app analytics metrics are the quantitative signals product teams use to measure performance, engagement, and...


Silvanus Alt, PhD
Founder & CEO | UXCam


Mobile app analytics
Mobile App Retention Benchmarks by Industry (2026)
Mobile app retention benchmarks for 2026, broken down by industry. Day-1, day-7, day-30 retention rates for fintech, ecommerce, social, gaming, and more,...
Silvanus Alt, PhD
Founder & CEO | UXCam


Mobile app analytics
Sentry vs Datadog: Features, Pricing, and Which One Fits Your Production Stack
Sentry vs Datadog compared head-to-head on features, pricing, and the production stacks each one...
Silvanus Alt, PhD
Founder & CEO | UXCam