What Is App Optimization? Meaning, Techniques, and How to Optimize Your App


TABLE OF CONTENTS
- Key takeaways
- What is app optimization?
- 4 App Optimization Techniques
- 13 Optimization Patterns and Pitfalls
- Why app optimization matters
- Industry-specific considerations
- App optimization tools by category
- 10 common app optimization mistakes
- A maturity model for app optimization
- How we evaluated the techniques in this guide
- Bringing it together
App optimization is the ongoing process of improving a mobile app's performance, user experience, and store visibility using behavioral data, so more users discover the app, complete key actions, and keep coming back. That's the short definition. The longer one, which I'll unpack below, is what separates teams that actually move retention numbers from teams that ship features and hope.
I've spent the better part of a decade reviewing session recordings inside UXCam, a product intelligence and product analytics platform installed in more than 37,000 products worldwide. The pattern I see most often is that teams confuse "app optimization" with "App Store Optimization." ASO is one slice of it, and it matters, but the bigger and more neglected slice is what happens after someone installs: whether your onboarding converts, whether your checkout funnel leaks, whether users are rage-tapping a button that looks interactive but isn't.
This article defines app optimization properly, walks through the four techniques that actually change numbers, and shows how teams like Recora, Inspire Fitness, and Costa Coffee used them to ship measurable wins.
Key takeaways
App optimization is a continuous loop of measuring real user behavior, identifying friction, shipping fixes, and measuring again, across performance, UX, onboarding, and store listing. The four techniques that actually move the needle are analyzing user behavior, monitoring app performance, optimizing onboarding, and running regular functional and usability testing. Qualitative data from session replay, heatmaps, and issue analytics tells you why users drop off; quantitative tools only tell you that they did.
Poor performance remains the single largest cause of abandonment. Per Google research, 53% of mobile users abandon a site that takes longer than 3 seconds to load, and the pattern carries straight into apps. The wins look concrete when teams actually run the loop: Recora cut support tickets by 142% after spotting press-and-hold confusion, Inspire Fitness boosted time-in-app by 460%, Costa Coffee raised registrations by 15%, and Housing.com grew feature adoption from 20% to 40%.
What is app optimization?
App optimization is the systematic, data-driven process of improving every surface a user touches, from the store listing that convinces them to install, to the onboarding that decides whether they stick, to the feature flows that drive revenue. In practice it covers four overlapping disciplines that most teams separate artificially.
App Store Optimization (ASO) handles keywords, screenshots, ratings, and conversion rate on the listing page. Performance optimization is about crash rate, load times, ANRs, memory usage, and battery drain. UX optimization covers onboarding, navigation, information architecture, and friction in core journeys. Behavioral optimization uses user behavior analytics and A/B testing to move specific conversion and retention metrics. Pull any one of these out of the stack and the others get less leverage.
The definition that matters in practice is simpler: if you're not closing the loop between what users actually do in your app and what you change next, you're not optimizing. You're guessing.
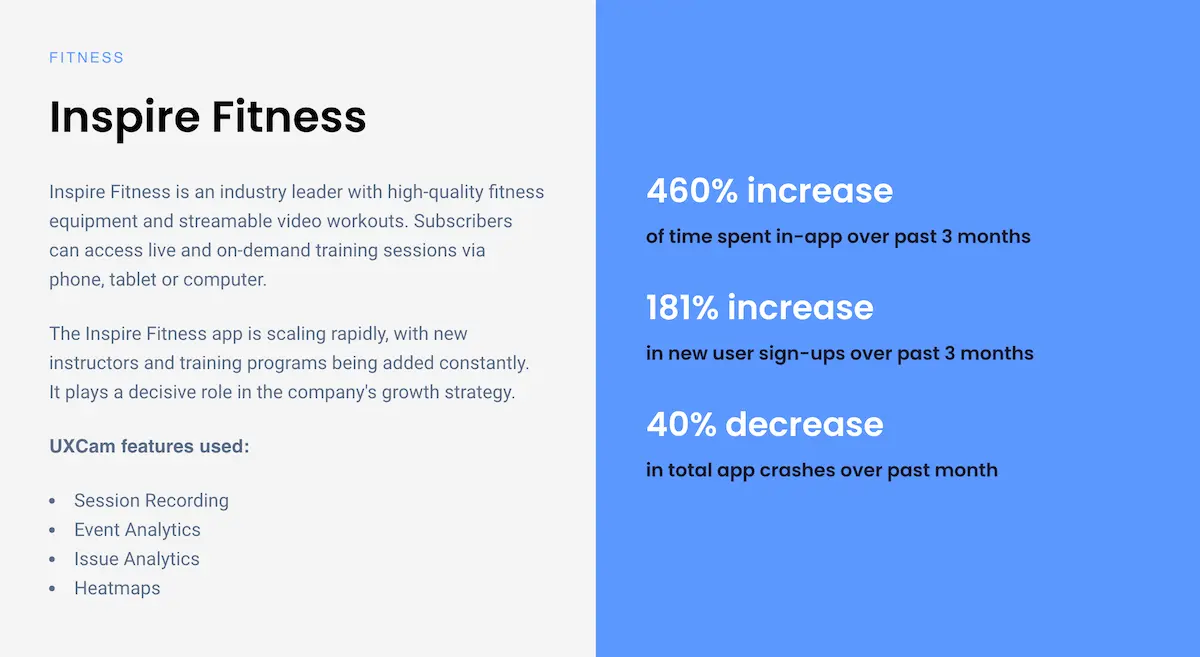
A working example: Inspire Fitness
Inspire Fitness had a stack of quantitative tools, Mixpanel and Instabug among them, but no way to see why users dropped off the fitness content inside their connected-equipment app. They added UXCam for session recording, event analytics, issue analytics, and heatmaps, and the qualitative layer filled the gap. After shipping fixes informed by those sessions, Inspire Fitness saw a 460% increase in user activity and a 40% reduction in app crashes. That's what the optimization loop looks like when it's actually running.


4 App Optimization Techniques
1. Analyze real user behavior
Every tap, swipe, scroll, and drop-off is a signal. The mistake I see teams make is treating aggregate dashboards as the endpoint when they're really the starting point. You need to be able to pull up the individual sessions behind a broken funnel and watch what actually happened.
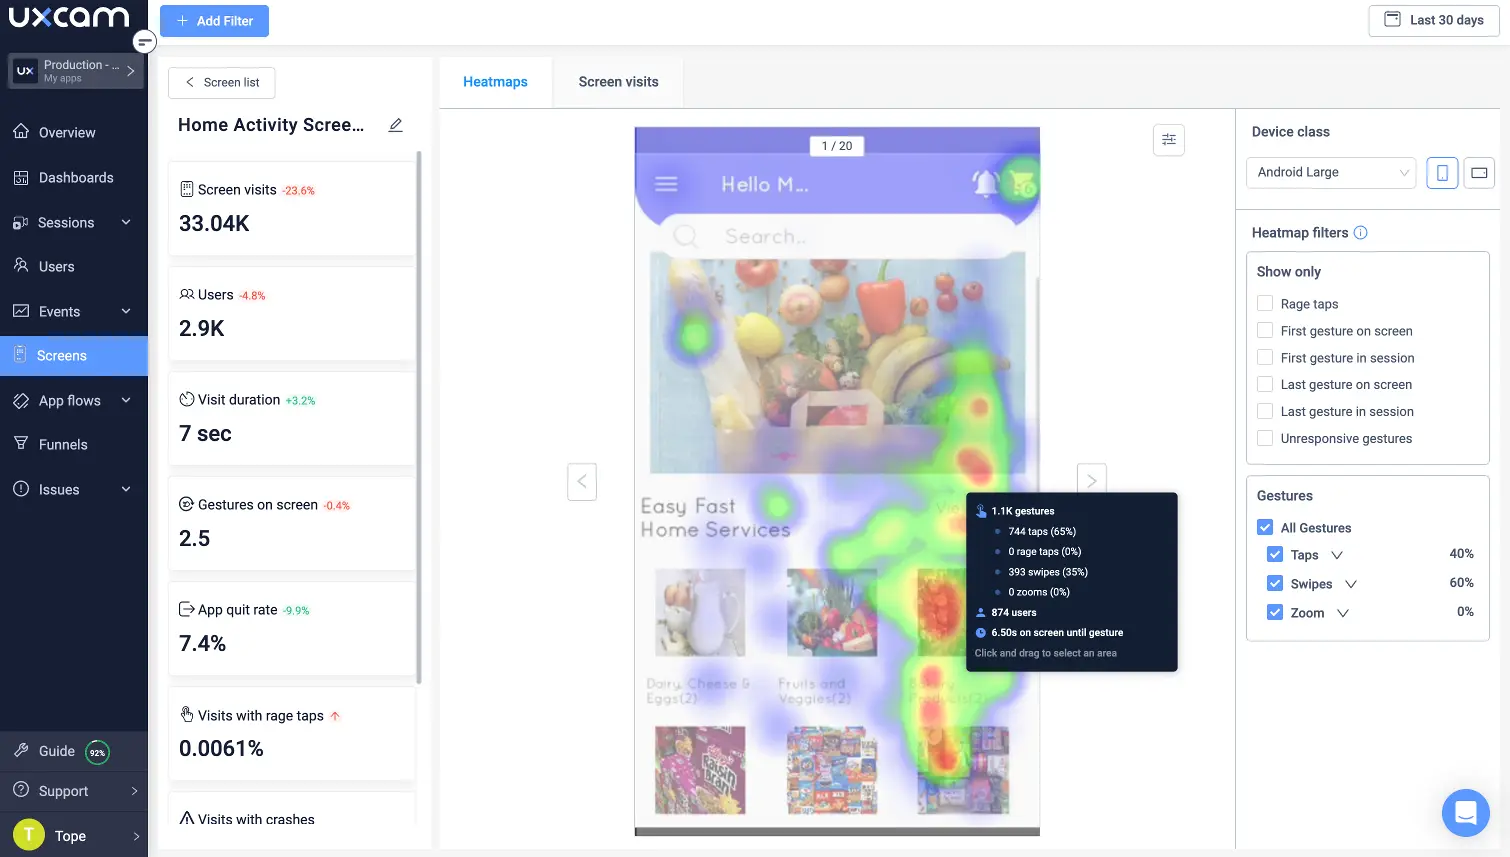
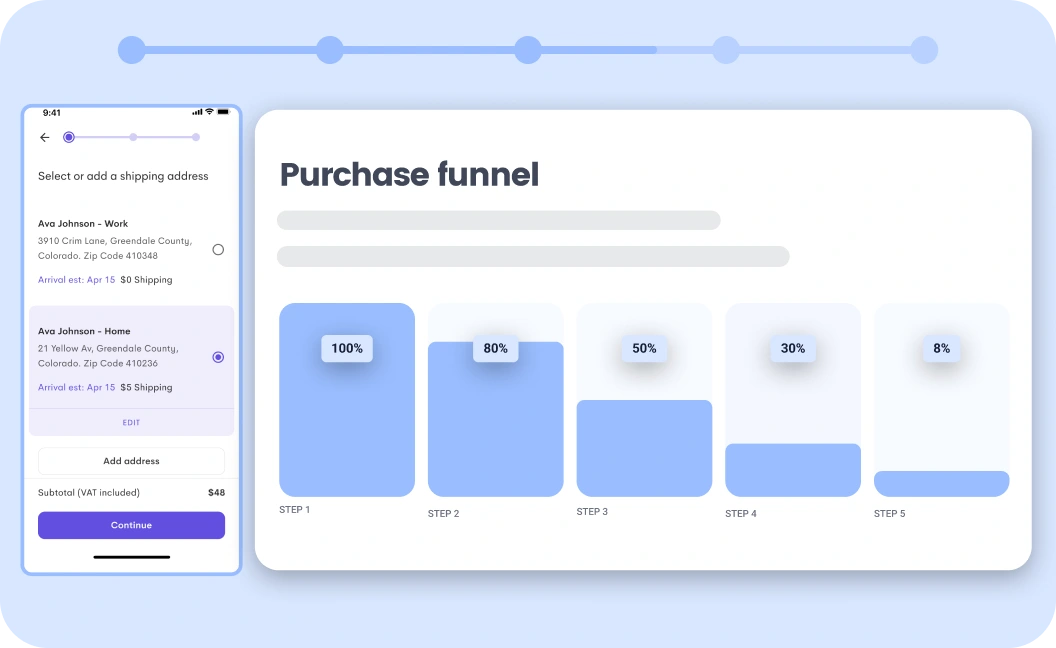
The four instruments I rely on work as a set. Heatmaps show where attention and frustration concentrate at scale, and session replay lets you watch an anonymized recording of the user's journey tap by tap. Funnels quantify where users drop off between any two events, and event analytics track the specific interactions, button taps, screen views, and gestures that define success. None of them alone tells you the whole story; together they give you both the "what" and the "why."
PlaceMakers used this exact combination to diagnose a sales drop after they added a "constrained" tag to low-stock items. Heatmaps showed users scrolling past tagged products even when those products matched the search. Session replays confirmed the tag, rendered in bold red, was reading as a warning rather than helpful context. They softened the visual treatment, and sales doubled.


If you want to go deeper on this specific loop, the piece on how to improve mobile app performance covers the diagnostic workflow in more detail.
2. Monitor app performance relentlessly
Performance is the part of optimization where the damage is invisible until you instrument it. Users don't file bug reports. They uninstall. Unity's mobile performance benchmarks and the Google Play vitals guidelines both show that ANR rates above 0.47% or crash rates above 1.09% get apps quietly demoted in store rankings, which compounds the acquisition damage on top of the retention damage.
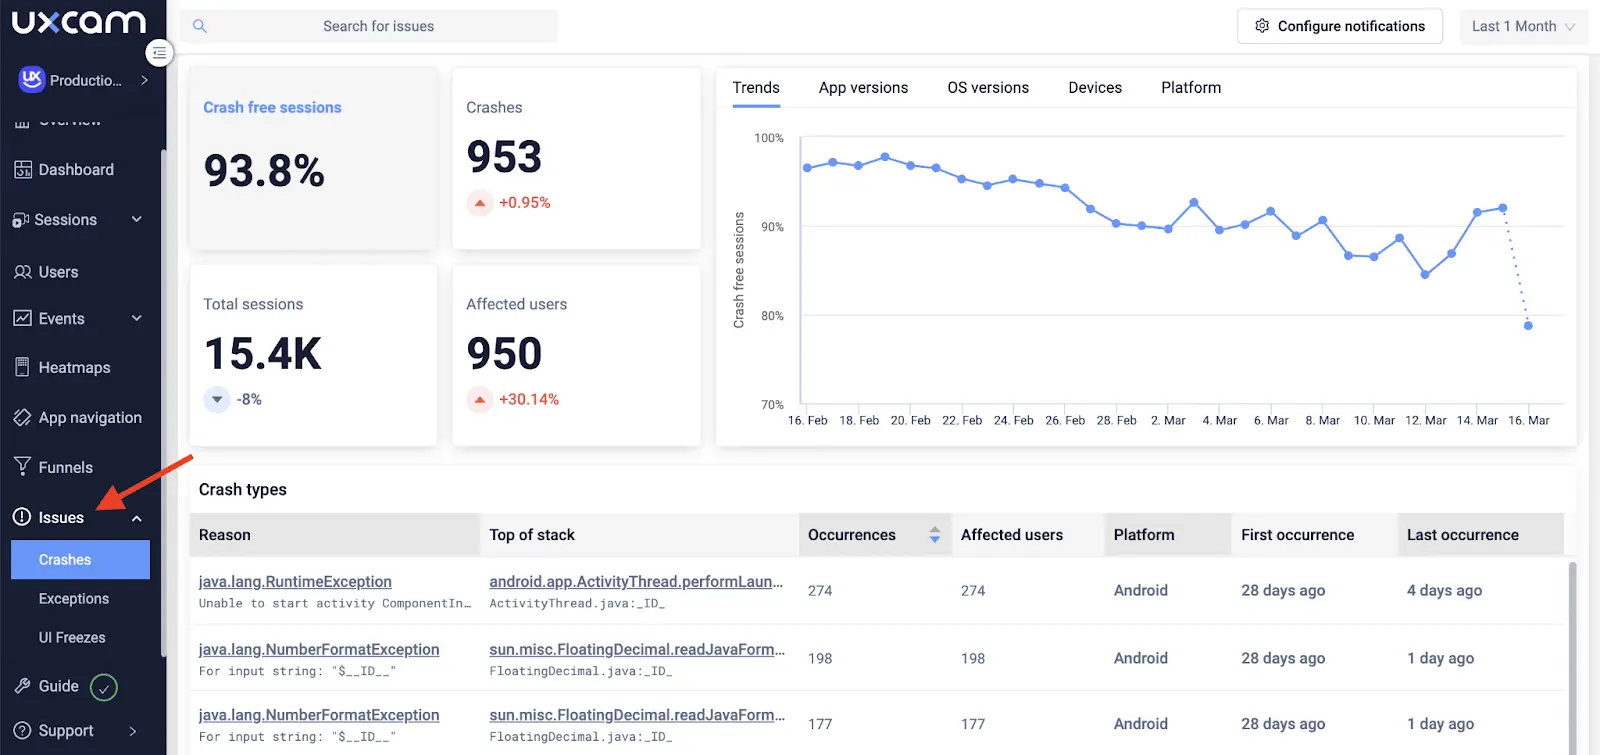
There are two classes of issue worth watching, and they require different instruments. Frustration signals, rage taps, dead taps, excessive scrolling, are behavioral tells that something's broken from the user's perspective even when the logs say the app is fine. Technical issues like UI freezes, ANRs, and crashes are what a backend dashboard will tell you about. UXCam's issue analytics surfaces both with the session replay attached, so you can see the exact tap sequence that produced the freeze rather than guessing from a stack trace.


Pair behavioral monitoring with a dedicated APM tool like Dynatrace or New Relic for infrastructure-layer metrics such as network latency, cold-start time, and API errors. The two layers answer different questions, and together they cover the full picture. I broke down the tooling landscape in this mobile app monitoring tools comparison.
This is also where Tara AI, UXCam's built-in AI analyst, earns its place. Tara processes sessions continuously, surfaces the friction clusters you'd miss scanning replays manually, and recommends the next action. It turns a data problem into a priority list. See how it works on the UXCam AI page.
3. Optimize onboarding
Onboarding is the highest-leverage surface in your app. Users who hit a wall in the first ninety seconds don't come back, and the research on activation consistently shows the first session is where most of the retention curve is decided.
Costa Coffee ran into this when they launched their loyalty-program app. A big share of users was dropping off during registration, and nobody on the team could point to why. Their Global Digital Analytics Manager set up custom events, built a funnel over the registration flow inside UXCam, and spotted a 15% drop-off caused by invalid-password errors. Simplifying the password reset flow lifted successful registrations by the same margin, in the first release cycle.


The checklist I use when auditing an onboarding flow starts with stripping the signup form down to the fields you genuinely need today, not the ones marketing might want eventually. From there, prefer tooltips and contextual prompts over front-loaded tutorials, and aim to get the user to a first "win" within the first session. Visualize the registration funnel, measure every step, and test on the device tiers your actual audience uses rather than just flagships. For a fuller treatment, the customer journey optimization guide walks through how onboarding connects to downstream retention.
4. Test regularly, in both dimensions
Testing is the habit most teams cut corners on, and the cost compounds. Two types of testing matter for optimization, and they answer different questions: functional testing asks whether the feature does what it's supposed to do across devices and OS versions, while usability testing asks whether users can figure out what to do without being coached.
Recora learned the hard way that these are different problems. Users kept reporting bugs that QA couldn't reproduce. The app worked perfectly in testing, but on real devices in real sessions something else was happening. Using UXCam session replays, the Recora product team watched what users were actually doing: they were tapping a control that had been programmed to respond to a press-and-hold gesture. From QA's perspective, no bug. From the user's perspective, the app was broken. Recora enabled press-and-hold as an alternate interaction, and support tickets dropped by 142%.


Functional QA catches the bugs you thought to test for. Session replay catches the ones you didn't.
13 Optimization Patterns and Pitfalls
After years of staring at replays, the same issues surface across industries and app categories. These are the ones worth codifying.
1. The invisible empty state
Empty states get treated as an afterthought and then become the highest-drop-off screen in the app. If a new user lands on an empty dashboard with no guidance, most of them leave. NN/g's work on empty states shows that converting them into micro-onboarding moments, with a clear next action, can recover a meaningful slice of first-session churn.
2. Gesture ambiguity
Recora's press-and-hold issue is the canonical case, but I see it constantly. If a control looks tappable, users will tap it. Any gesture more complex than a tap needs a visual affordance or a fallback. Apple's Human Interface Guidelines on gestures are clear on this and are routinely ignored.
3. Cold-start regressions after SDK bloat
Every third-party SDK you add costs milliseconds on cold start. Teams add analytics, attribution, crash, push, in-app messaging, and A/B testing SDKs without measuring the cumulative cost. Benchmark cold start before and after each integration using Android Macrobenchmark or Xcode's MetricKit.
4. Form fields you don't need
Every field on a signup form costs a percentage of conversion. The Baymard Institute's checkout research found the average checkout has 70% more form fields than necessary. Audit yours. If marketing wants the data, ask whether it can be collected after activation instead.
5. Deep-link dead ends
Push notifications and email links that drop users onto the wrong screen, or onto a generic home screen with no context, are a massive silent leak. Instrument deep-link landing pages specifically and watch the first-session funnel from each source.
6. Rage-tap clusters on non-interactive elements
Users tap headers, icons, product images, and static labels expecting them to do something. If a heatmap shows a rage-tap cluster on a non-interactive element, you've found a design debt. Make it tappable or make it clearly non-interactive.
7. Permissions asked too early
Asking for push, location, contacts, or camera permissions in the first thirty seconds tanks opt-in rates. Mixpanel's permission priming research shows that priming the ask with context, and delaying it until the user has seen value, can double opt-in rates.
8. Over-personalized homescreens that break discoverability
Personalization becomes a trap when the algorithm hides features users wanted to find. Core navigation should stay predictable, and personalization should serve the long tail rather than override it.
9. Dark patterns that show up in reviews
Any flow that dark-patterns users into subscriptions or data sharing will show up in App Store reviews, and Apple's App Review Guidelines section 3.1.2 has gotten more aggressive about rejecting them. Design the cancel flow as carefully as the signup flow.
10. Not testing on mid-tier devices
The team ships on Pixel 8 and iPhone 15 Pro. A third of the user base is on a three-year-old mid-range Android. Firebase Test Lab and BrowserStack App Live let you replicate real device conditions cheaply.
11. Analytics events that don't map to decisions
If an event fires but nobody has defined what action you'd take if the number changed, it's noise. Every tracked event should answer a specific product question. The Amplitude taxonomy guide is a good starting point for cleaning this up.
12. Ignoring the web surface of a mobile product
Most mobile apps have a companion web experience, marketing site, password reset, referral flow, or web dashboard, that directly affects mobile activation. Treating them as separate optimization programs means missing cross-surface drop-offs. UXCam covers both mobile apps and the web with the same feature set, which closes that gap.
13. One-shot A/B tests without downstream measurement
A test wins on click-through, ships, and then retention drops a month later because the variant attracted the wrong users. Tie every experiment to a downstream retention or revenue metric, not just the immediate conversion. Statsig's guidance on holdout groups is worth adopting.
Why app optimization matters
It's the difference between engagement and abandonment
Around 29% of smartphone users will abandon an app that feels sluggish or cumbersome, and the Localytics data on app uninstalls has shown for years that most users who churn do so in the first week. Optimization is how you keep that cohort from leaving before they understand what the product can do for them.
It compounds into retention
Apps that feel fast and intuitive get more sessions per user, longer sessions, and more word-of-mouth installs. Housing.com is the cleanest example I've seen: by using UXCam to diagnose and fix friction in a core feature, they grew adoption from 20% to 40%. That's not a marketing lift. That's the product doing the work.
It drives ASO indirectly
The App Store and Play Store both factor engagement and ratings into ranking. A better-optimized app gets better reviews, better retention, and therefore better rankings, which drive more installs, which, if the app is optimized, retain. The flywheel only spins if the product holds up under the weight of the traffic.
Industry-specific considerations
Generic advice gets you part of the way. The specific friction points that matter vary by vertical, and pattern-matching from other teams in your space usually beats a generic playbook.
Fintech and banking
Onboarding is where regulatory overhead collides with user patience. KYC verification, document upload, and selfie liveness checks are the top drop-off surfaces. Teams that win here measure time-to-funded-account as their north star and instrument each KYC step with session replay so they can see where document uploads fail silently. Compliance constraints mean you need masking and PII redaction baked in from day one, not added after a data review.
E-commerce and retail
The funnel from product detail page to checkout confirmation is where the money is, and every extra tap costs conversion. PlaceMakers' "constrained" tag story is typical of the category: small visual choices drive big behavioral shifts. Measure add-to-cart abandonment, checkout form abandonment, and payment-method-selection drop-off as separate funnels, not one composite, because the fixes are different for each.
Health and fitness
Engagement patterns are bimodal, daily active users versus weekly lapsers, and the optimization focus is habit formation. Inspire Fitness's 460% time-in-app lift came from removing friction in content discovery, not from adding features. The Hooked model from Nir Eyal maps cleanly onto this category: trigger, action, variable reward, investment.
QSR, food, and loyalty
Costa Coffee's registration lift generalizes: loyalty apps live or die on the first-reward moment. Measure time from install to first scanned transaction as your activation metric. Passwords, email verification, and card entry are the three universal drop-off points, and each deserves its own funnel.
Media and streaming
The core metric is minutes watched per session and return rate within seven days. Session replay is valuable specifically for diagnosing content-discovery failures: users who search, don't find, and leave. Heatmaps on the home screen tell you whether your editorial priorities match user intent.
B2B and productivity
Activation is more complex because value often requires multi-user workflows. Instrument the moment a second user joins a workspace, because single-user B2B accounts churn at dramatically higher rates. The OpenView expansion SaaS benchmarks consistently show this pattern across categories.
App optimization tools by category
The tool stack I see at mature product teams breaks down roughly into six layers. No single tool covers all of it, and the glue between them is usually a shared user ID and a clean event taxonomy.
For product and behavioral analytics, UXCam handles session replay, heatmaps, funnels, issue analytics, and Tara AI across mobile apps and the web. Amplitude and Mixpanel are the common picks for event-centric quantitative analytics, and Heap leans into autocapture-first web analytics.
On performance and crash monitoring, Firebase Crashlytics gives you a free baseline, while Dynatrace, New Relic, and Sentry go deeper on APM and error tracking. For A/B testing and feature flags, Statsig, Optimizely, LaunchDarkly, and Firebase Remote Config are the options I see most often.
ASO and store intelligence is covered by AppTweak, Sensor Tower, and data.ai for keyword research, competitor benchmarking, and install attribution. Attribution and MMPs (mobile measurement partners) like Adjust, AppsFlyer, and Branch handle install attribution and deep linking once you're spending on paid acquisition. For user research, Maze, UserTesting, and Lookback add moderated and unmoderated usability testing that complements session replay.
The integration pattern that works in practice: behavioral analytics tells you why a test result happened, quantitative analytics tells you that it happened, and APM tells you whether infrastructure is a factor. If you're only running one, it's usually the quantitative tool, and you're missing the diagnostic layer.
10 common app optimization mistakes
The failure modes I see most often are predictable. Shipping redesigns instead of targeted fixes is the biggest: big-bang redesigns mask which change caused which outcome, so ship one variable at a time when you can. A close second is treating the dashboard as the insight, when aggregate numbers only tell you a problem exists and session replay tells you what it actually is.
Optimizing for installs before retention is a classic growth-team trap. Scaling paid acquisition on a leaky app just burns money faster, so fix activation first. In the same spirit, ignoring the web surface means missing cross-surface drop-offs, because referral pages, password resets, and marketing flows all shape mobile conversion and are invisible without unified analytics. Skipping event taxonomy governance compounds slowly: event names multiply, definitions drift, and by month six nobody trusts the data. Document and review quarterly.
Not segmenting by device tier is another silent killer. Average crash rate hides a catastrophic crash rate on low-memory devices, so always segment. Running experiments without statistical rigor creates fake wins: underpowered tests that "win" are often noise, and a calculator like Evan Miller's takes thirty seconds to use before you start. Using NPS as your primary UX metric is a related mistake; NPS correlates weakly with retention in most mobile contexts, and behavioral metrics beat survey metrics for product decisions.
Finally, two cultural mistakes. Assuming QA caught the bug: QA tests the flows you thought of, and session replay catches the ones you didn't, which is where real users actually live. And treating optimization as a project with an end date: it's an operating rhythm, not a quarter-long initiative, and the teams that compound wins do this every sprint.
A maturity model for app optimization
Most teams I talk to don't know where they sit on the spectrum. This is the model I use when helping them figure out what to do next.
Level 1: Reactive
The team ships features, watches the App Store rating, and reacts to crashes when users complain. Analytics is installed but underused. There's no shared view of the funnel. Optimization is whatever the loudest stakeholder asks for this week. Most early-stage apps live here, and it's fine for a while. The next step is to instrument your top two user journeys with funnels and session replay, run the loop once, and ship one fix.
Level 2: Instrumented
Core flows are tracked, crash rates are monitored, and someone, usually a PM or growth lead, pulls insights weekly. Session replay exists but isn't systematically reviewed. A/B testing happens occasionally on marketing pages, not in the app. The next step is to establish a weekly insight review and a single prioritized friction backlog, and to connect a behavioral analytics tool to your experimentation stack.
Level 3: Operational
Every sprint starts with a review of drop-off, rage-tap, and issue-analytics data. Experiments are tied to retention and revenue metrics, not just click-through. Performance budgets are enforced in CI. Cross-functional rituals across product, design, engineering, and data all review the same dashboards. The next step is investing in predictive analytics and AI-assisted insight surfacing, which is where Tara AI starts paying back by turning passive session data into prioritized actions.
Level 4: Compounding
The optimization loop is the default operating rhythm. Every release is a hypothesis with an instrumented outcome. Qualitative and quantitative data flow into the same backlog. The product measurably improves quarter over quarter, and you can attribute retention lifts to specific decisions. Housing.com's 20% to 40% adoption jump looks like this in practice.
The jump from Level 2 to Level 3 is the hardest. It requires discipline more than tooling, and it's where most teams stall.
How we evaluated the techniques in this guide
To keep this article honest, I ranked the four techniques above on three criteria, weighted by what I've seen actually change retention curves in the UXCam customer base. Measurable impact on retention or conversion carries 50% of the weight: can we point to a case study where this technique moved a real KPI? Time-to-insight carries 30%: how fast can a small team go from "we should look at this" to a shipped change? Instrumentation cost carries the remaining 20%: how much engineering effort is required to start?
Behavioral analysis and onboarding optimization rank highest on impact. Performance monitoring ranks highest on time-to-insight once autocapture is running. Testing ranks highest on instrumentation cost, in the sense that most teams already have some QA process to extend.
Bringing it together
App optimization isn't a project. It's an operating rhythm. The teams that win treat every release as a hypothesis, instrument the behavior that follows, and let the data decide what ships next. UXCam exists to close that loop for mobile and web teams, with autocapture analytics, session replay, heatmaps, funnels, retention analytics, issue analytics, and Tara AI turning raw sessions into prioritized actions.
If you want to see what that looks like on your own app, start a free UXCam trial. No credit card, thirty days, full platform.
Frequently asked questions
What is the meaning of app optimization?
App optimization means continuously improving a mobile app's performance, user experience, and store visibility using real behavioral data. It covers four overlapping areas: App Store Optimization (ASO), performance optimization (crash rate, load time, stability), UX optimization (onboarding, navigation, friction reduction), and behavioral optimization (A/B testing and funnel analysis). The core idea is a loop: measure what users actually do, identify where they struggle, ship a fix, and measure the impact. Teams that skip the measurement step aren't optimizing, they're guessing, and the results show up in their retention curves.
How do you optimize a mobile app?
Start by instrumenting the app so you can see real user behavior: session replay, heatmaps, event analytics, and funnels over your key flows. Then pick one high-leverage surface, usually onboarding or checkout, diagnose where users drop off, and ship one targeted fix at a time so you can attribute the change. Monitor performance metrics (crash rate, ANRs, UI freezes) in parallel, because poor performance silently kills retention before UX changes can help. Then repeat the cycle weekly or per sprint. Teams like Inspire Fitness and Recora shipped measurable wins (460% more time-in-app, 142% fewer support tickets) by running this loop consistently rather than doing big-bang redesigns.
What is the difference between app optimization and App Store Optimization (ASO)?
App Store Optimization is one component of app optimization, specifically the work of improving how your listing ranks and converts in the App Store and Google Play: keywords, title, subtitle, screenshots, preview video, ratings, and reviews. App optimization is the broader discipline that also covers what happens inside the app after install: performance, onboarding, UX, and feature adoption. ASO drives installs. The rest of app optimization decides whether those installs turn into retained, engaged users. Doing one without the other is a leaky bucket: either you have a great app nobody finds, or you spend on acquisition and watch users uninstall in week one.
What tools do teams use to optimize apps?
Most mature product teams run a stack rather than a single tool. For behavioral and experience analytics, UXCam handles session replay, heatmaps, funnels, issue analytics, and Tara AI for automated insights across mobile and web. For performance monitoring, Dynatrace, New Relic, or Firebase Crashlytics cover crash and infrastructure metrics. For A/B testing, options include Firebase Remote Config, Optimizely, and Statsig, and for ASO, AppTweak and Sensor Tower are the common picks. The key is integration. Your behavioral tool should tell you why a test result happened, not just that it did. That's the gap qualitative tools like UXCam close.
How long does it take to see results from app optimization?
Performance fixes can show up in crash-free-session rates within days of release. UX and onboarding changes typically show early signal in 2-4 weeks once you have statistically meaningful funnel data, and compound into retention curves over 60-90 days. The Costa Coffee registration fix lifted conversions by 15% in the first release cycle. The Housing.com adoption increase from 20% to 40% took longer because it required multiple iterations on a core feature. The honest answer: quick wins are available fast if you have the right instrumentation, and sustained lifts in retention require running the loop every sprint for a quarter or more.
What metrics should I track to measure app optimization?
Track metrics across four layers. Acquisition is install conversion rate from the store listing. Activation is the percentage of users completing onboarding and reaching the first value moment. Engagement covers sessions per user, session length, and feature adoption rate. Retention covers Day 1, Day 7, and Day 30 retention cohorts plus churn rate. Technical health sits alongside all of these: crash-free sessions, ANR rate, UI freeze rate, rage-tap count, and average screen load time. The mistake is to watch only the top-level numbers. The insight lives in the diagnostic metrics, rage taps on a specific screen or drop-off between two specific funnel steps, because those tell you what to fix next.
How often should we run the optimization loop?
At a minimum, every sprint. Mature teams do it weekly: Monday review of last week's experiments and friction data, Wednesday prioritization, Friday ship. The cadence matters more than the ceremony. If you wait until quarterly planning to look at behavioral data, you've already burned most of the retention you could have saved.
Does app optimization apply to the web, or only to mobile apps?
Both. UXCam covers mobile apps and the web with the same feature set: autocapture, session replay, heatmaps, funnels, and Tara AI. The techniques in this article apply equally. The main differences are in what you instrument (scroll depth and form abandonment matter more on web, gesture and permission flows matter more on mobile) and how you measure performance (Core Web Vitals on web, cold start and ANRs on mobile).
Who should own app optimization inside a product team?
The product manager owns the backlog, but the loop only works if design, engineering, data, and user research share the rituals. The teams I see struggle are the ones where "optimization" is assigned to a single growth lead with no authority over the roadmap. The teams that compound wins treat optimization as a shared operating rhythm, with a weekly cross-functional review.
How do we prioritize which friction to fix first?
Multiply the severity of the friction (how many users hit it, how badly it blocks them) by the reachability of the fix (how much engineering effort, how much risk). Tara AI does a version of this automatically by clustering friction signals and ranking them by estimated impact. Manually, I use a 2x2 of impact versus effort and ship the high-impact, low-effort items first for compounding wins.
What's the role of AI in app optimization?
AI's useful role is as an analyst layer on top of behavioral data. Tara AI, inside UXCam, watches session data continuously, clusters friction patterns, and surfaces the top things to fix next. Manually reviewing thousands of sessions doesn't scale; AI-assisted surfacing does. The bad use of AI is generating optimization "insights" with no grounding in your actual user data, which is worse than guessing because it feels authoritative.
How do we optimize without breaking existing users' workflows?
Roll changes out behind feature flags to a small cohort first, measure behavioral impact and error rates, and expand gradually. Keep the old experience available for power users where possible. Instrument the cohort running the new variant separately in your funnel so you can see whether the change helped, hurt, or was neutral. LaunchDarkly and Statsig both make this straightforward.
What's the single highest-leverage thing a small team can do this week?
Install session replay on your most important flow (usually onboarding or checkout), watch twenty real sessions end to end, and write down every moment of confusion you see. You will find a fix worth shipping. I have never seen a team do this exercise and come away empty-handed. The loop starts there.
AUTHOR
Silvanus Alt, PhD
Founder & CEO | UXCam
Silvanus Alt, PhD, is the Co-Founder & CEO of UXCam and a expert in AI-powered product intelligence. Trained at the Max Planck Institute for the Physics of Complex Systems, he built Tara, the AI Product Analyst that not only analyzes user behavior but recommends clear next steps for better products.


TABLE OF CONTENTS
- Key takeaways
- What is app optimization?
- 4 App Optimization Techniques
- 13 Optimization Patterns and Pitfalls
- Why app optimization matters
- Industry-specific considerations
- App optimization tools by category
- 10 common app optimization mistakes
- A maturity model for app optimization
- How we evaluated the techniques in this guide
- Bringing it together


Related articles


Product best practices
12 Apps with Great User Onboarding (2026 Examples)
The 12 mobile app onboarding flows I'd study if I were designing one today, with specific callouts for what each does well, common mistakes, and the...
Silvanus Alt, PhD
Founder & CEO | UXCam


Product best practices
Why creating a data-driven culture has less to do with data than you think
Kishan Gupta, CEO, shares 5 tips and techniques for fostering a data-driven culture based on his own experiences building and leading...


Kishan Gupta
Co-Founder of UXCam


Product best practices
Finance apps have a customer support problem, here's how to fix it
Learn about the customer support problem in finance apps and practical solutions to fix it in our latest blog post, and improve user satisfaction and...


Jane Leung
Product Analytics Expert