Top 5 Crazy Egg Alternatives for UX Insights


UX can be tough to get a handle on.
There are a ton of moving pieces that all need to fit together to create a successful user experience. And when it comes to analyzing the data generated from UX testing, it can be tricky to figure out what’s going on.
Thankfully, there are plenty of tools available to help make the process easier. One such tool is Crazy Egg—an analytics platform that helps you visualize your website's user behavior. While Crazy Egg can be incredibly helpful, it’s not the only option.
Here's our list of the best Crazy Egg alternatives for UX insights.
Top 5 best Crazy Egg alternatives
UXCam: Best for Mobile UX Insights
Kissmetrics: Best for Marketing Attribution
Hotjar: Best for Qualitative Data
Optimizely: Best for Web Experimentation
Mouseflow: Best for Web-Based Friction Analytics
Let's get more in-depth.
UXCam
Best for Mobile Product Teams


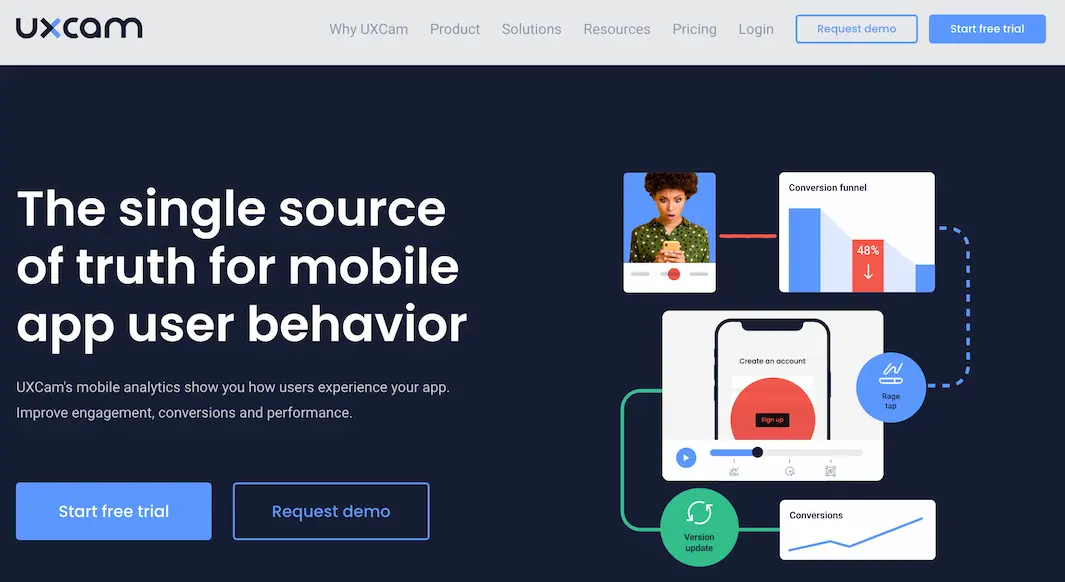
UXCam is a product analytics solution for mobile apps that helps product teams uncover the “whys” behind user behavior.
Whether you're looking for pain points and frustrations signals, running product experiments, or simply trying to understand how users are engaging with your app, UXCam has you covered with a suite of powerful tools.
Key features
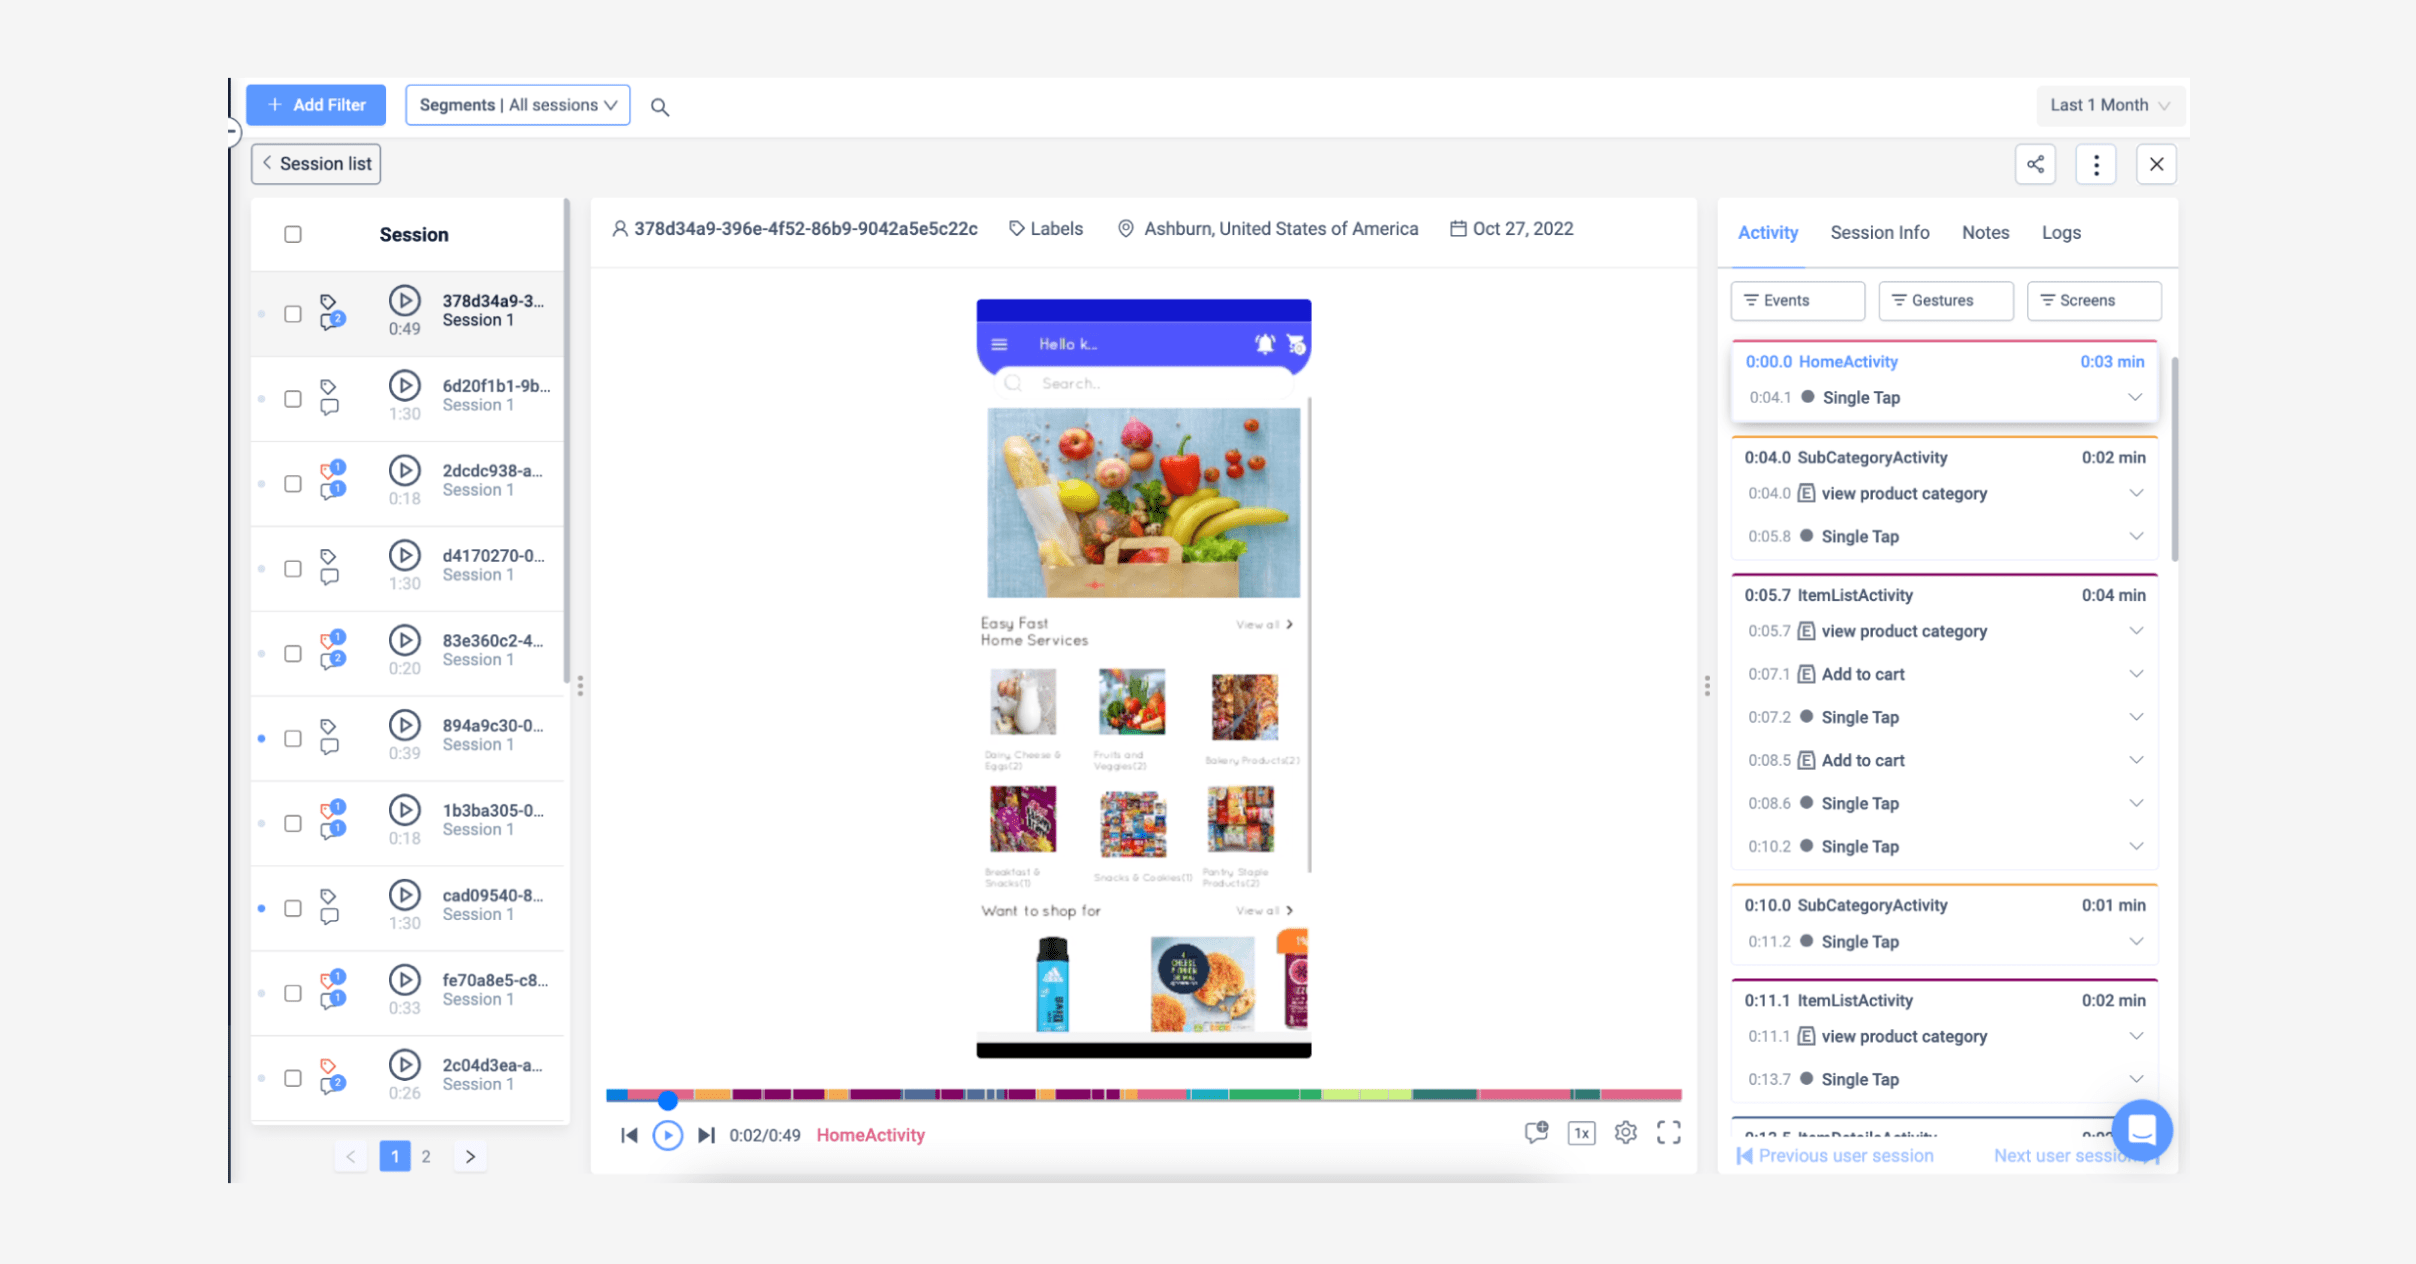
Session Replays: View recordings of user sessions to quickly identify usability issues.


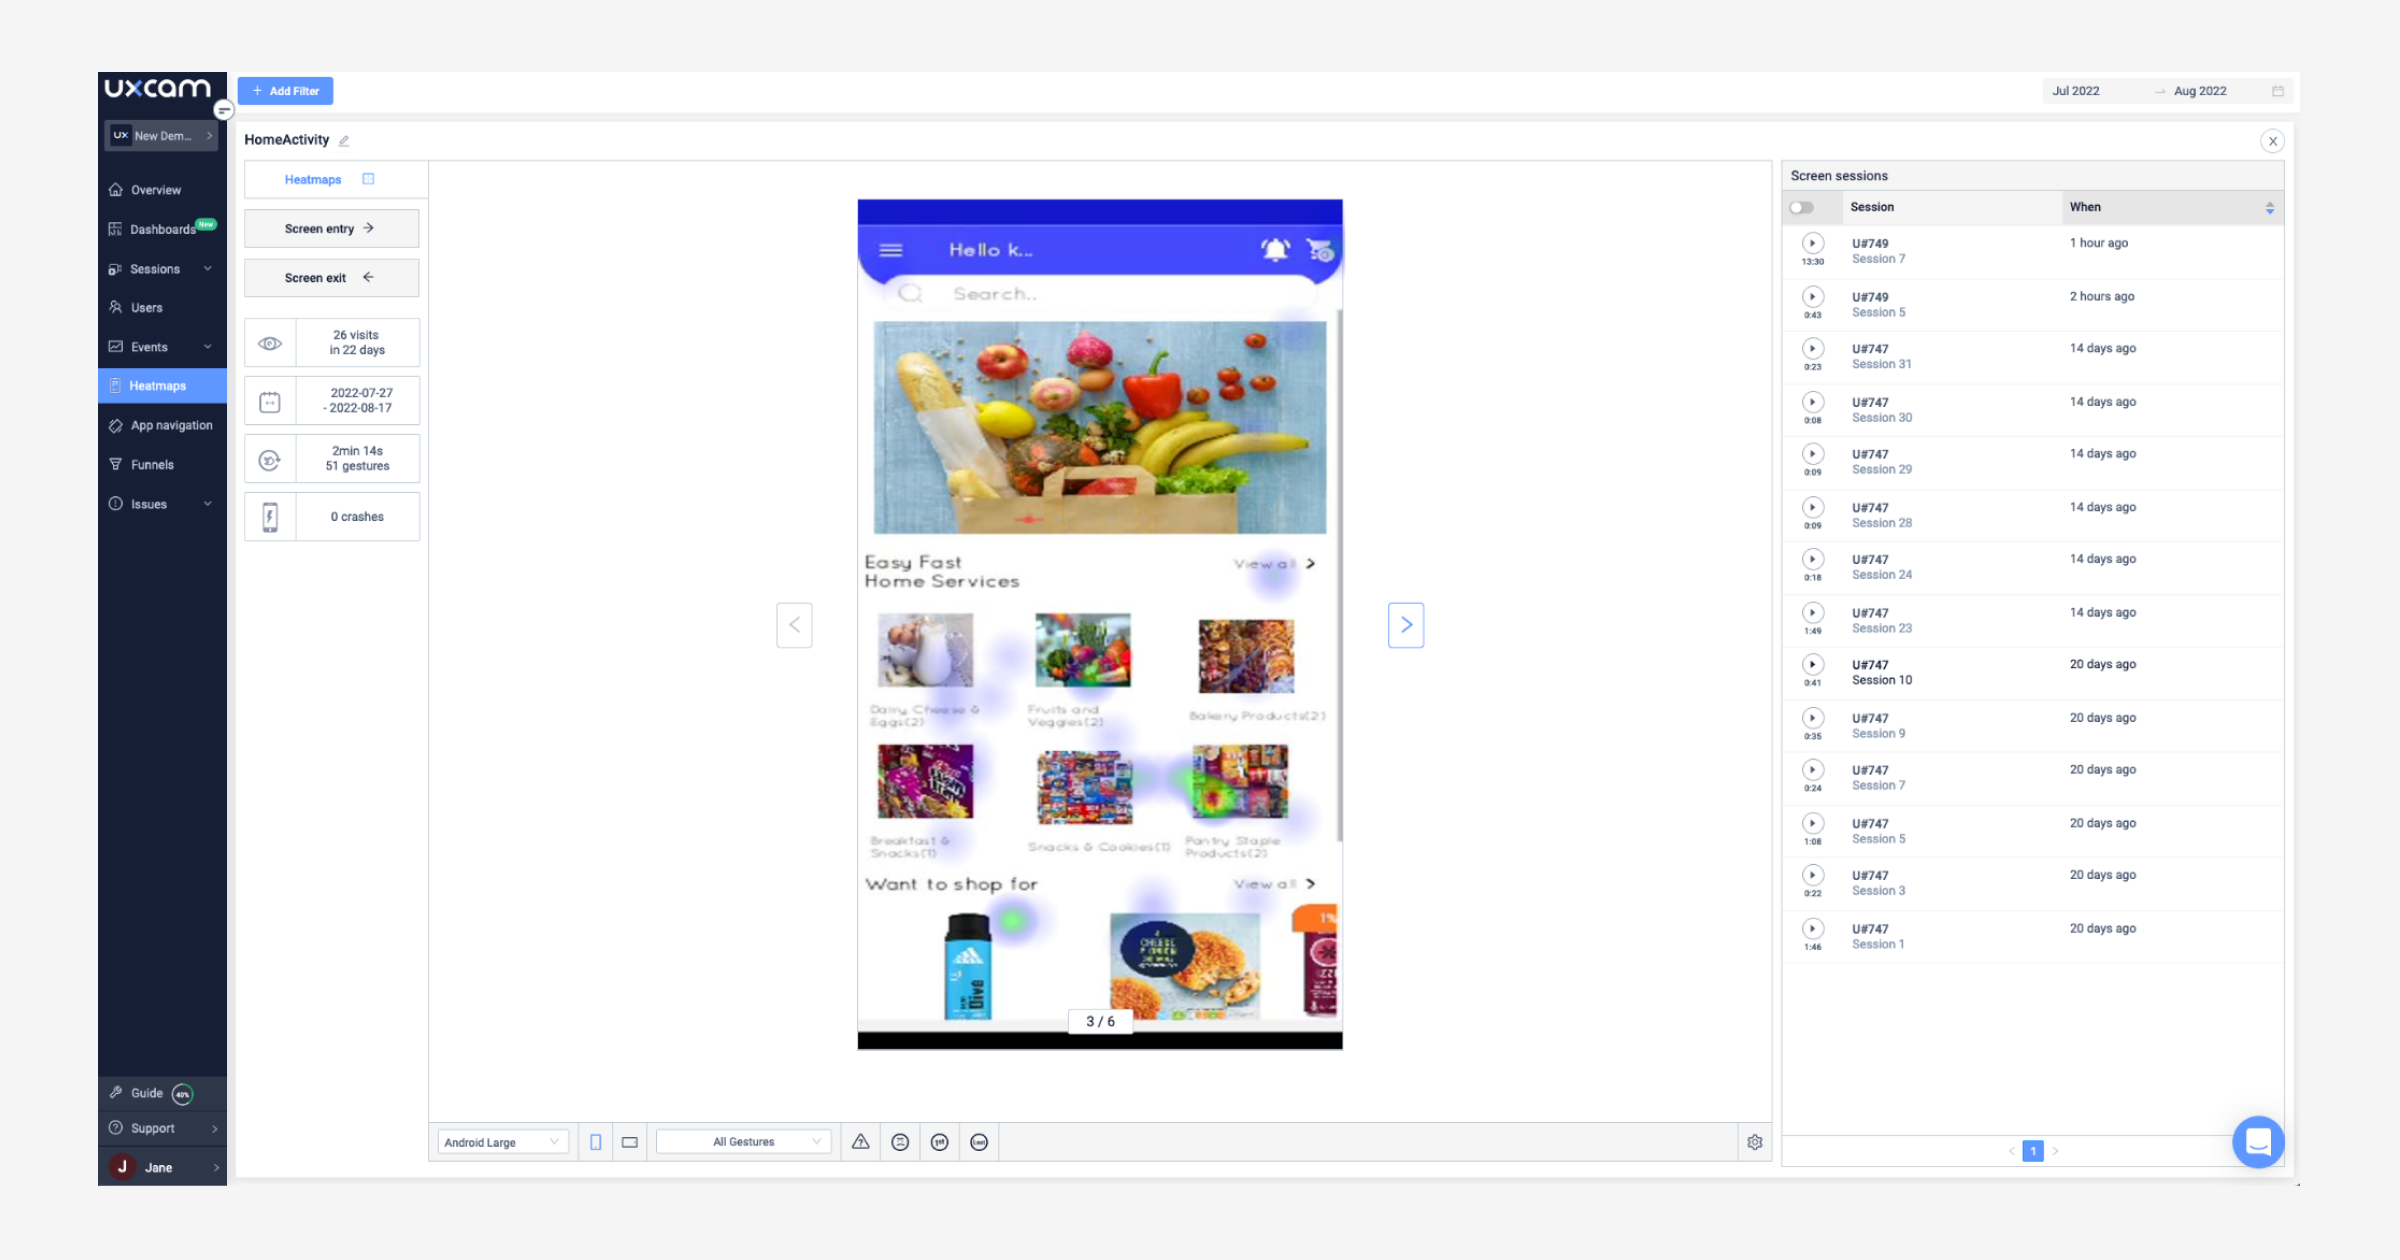
Heatmaps: Get a visual representation of how users interact with your app, and uncover opportunities to improve the user experience.


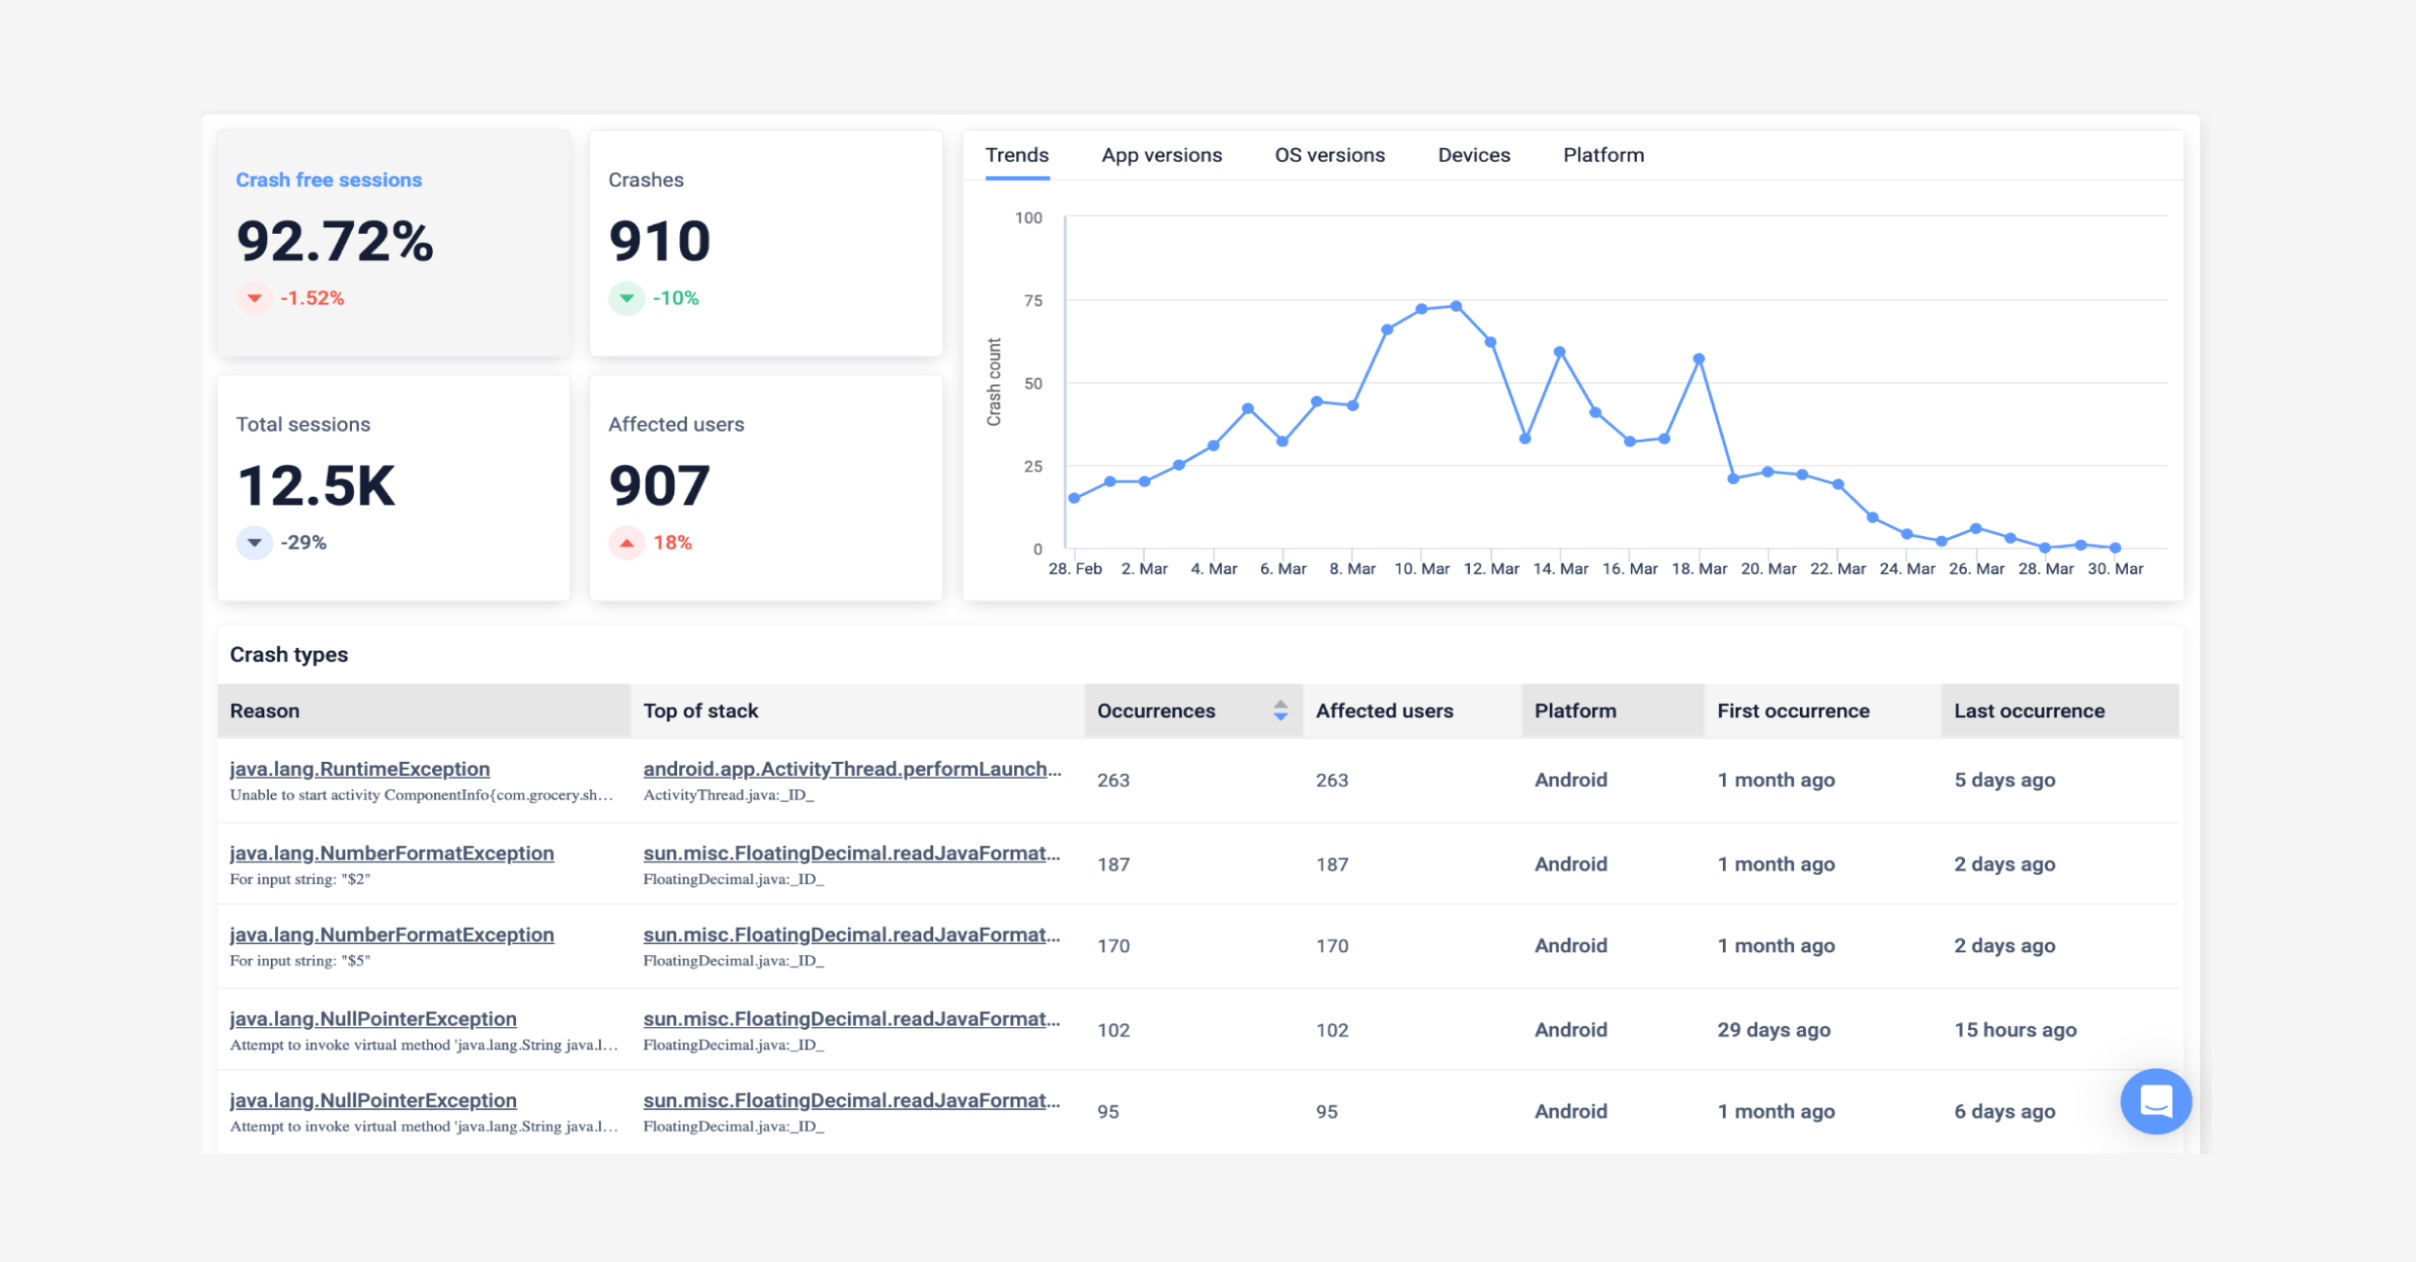
Crash Reports: See a big-picture view of where your app is crashing and freezing—and how it’s affecting users.


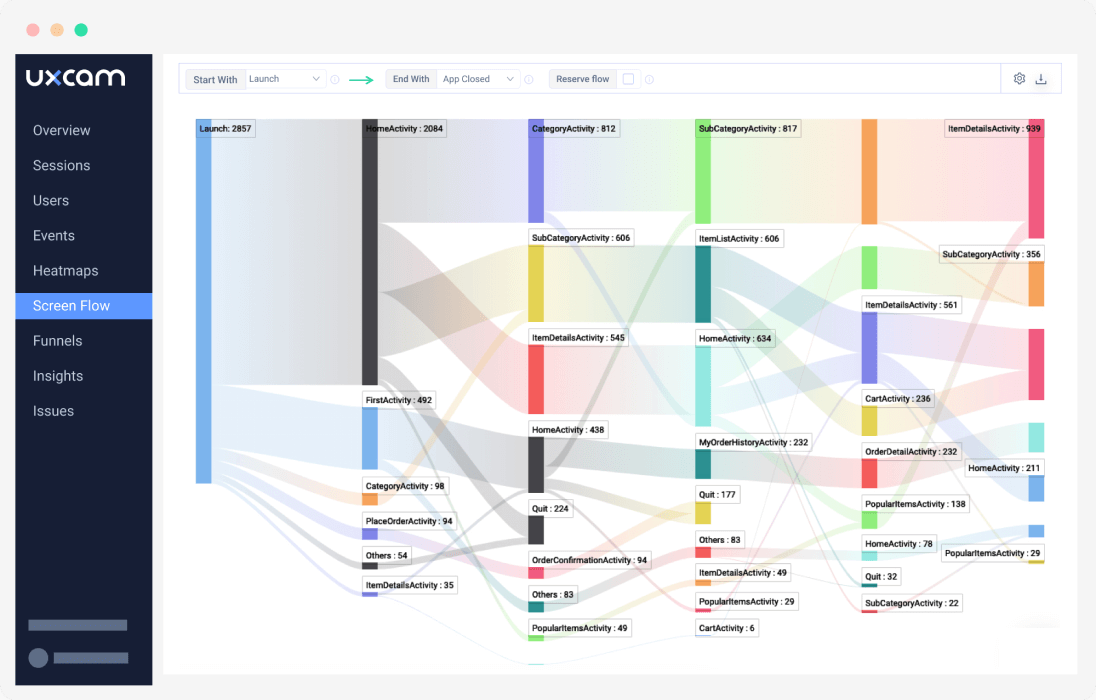
User Journeys: Get visualizations of user journeys across various screens and events.


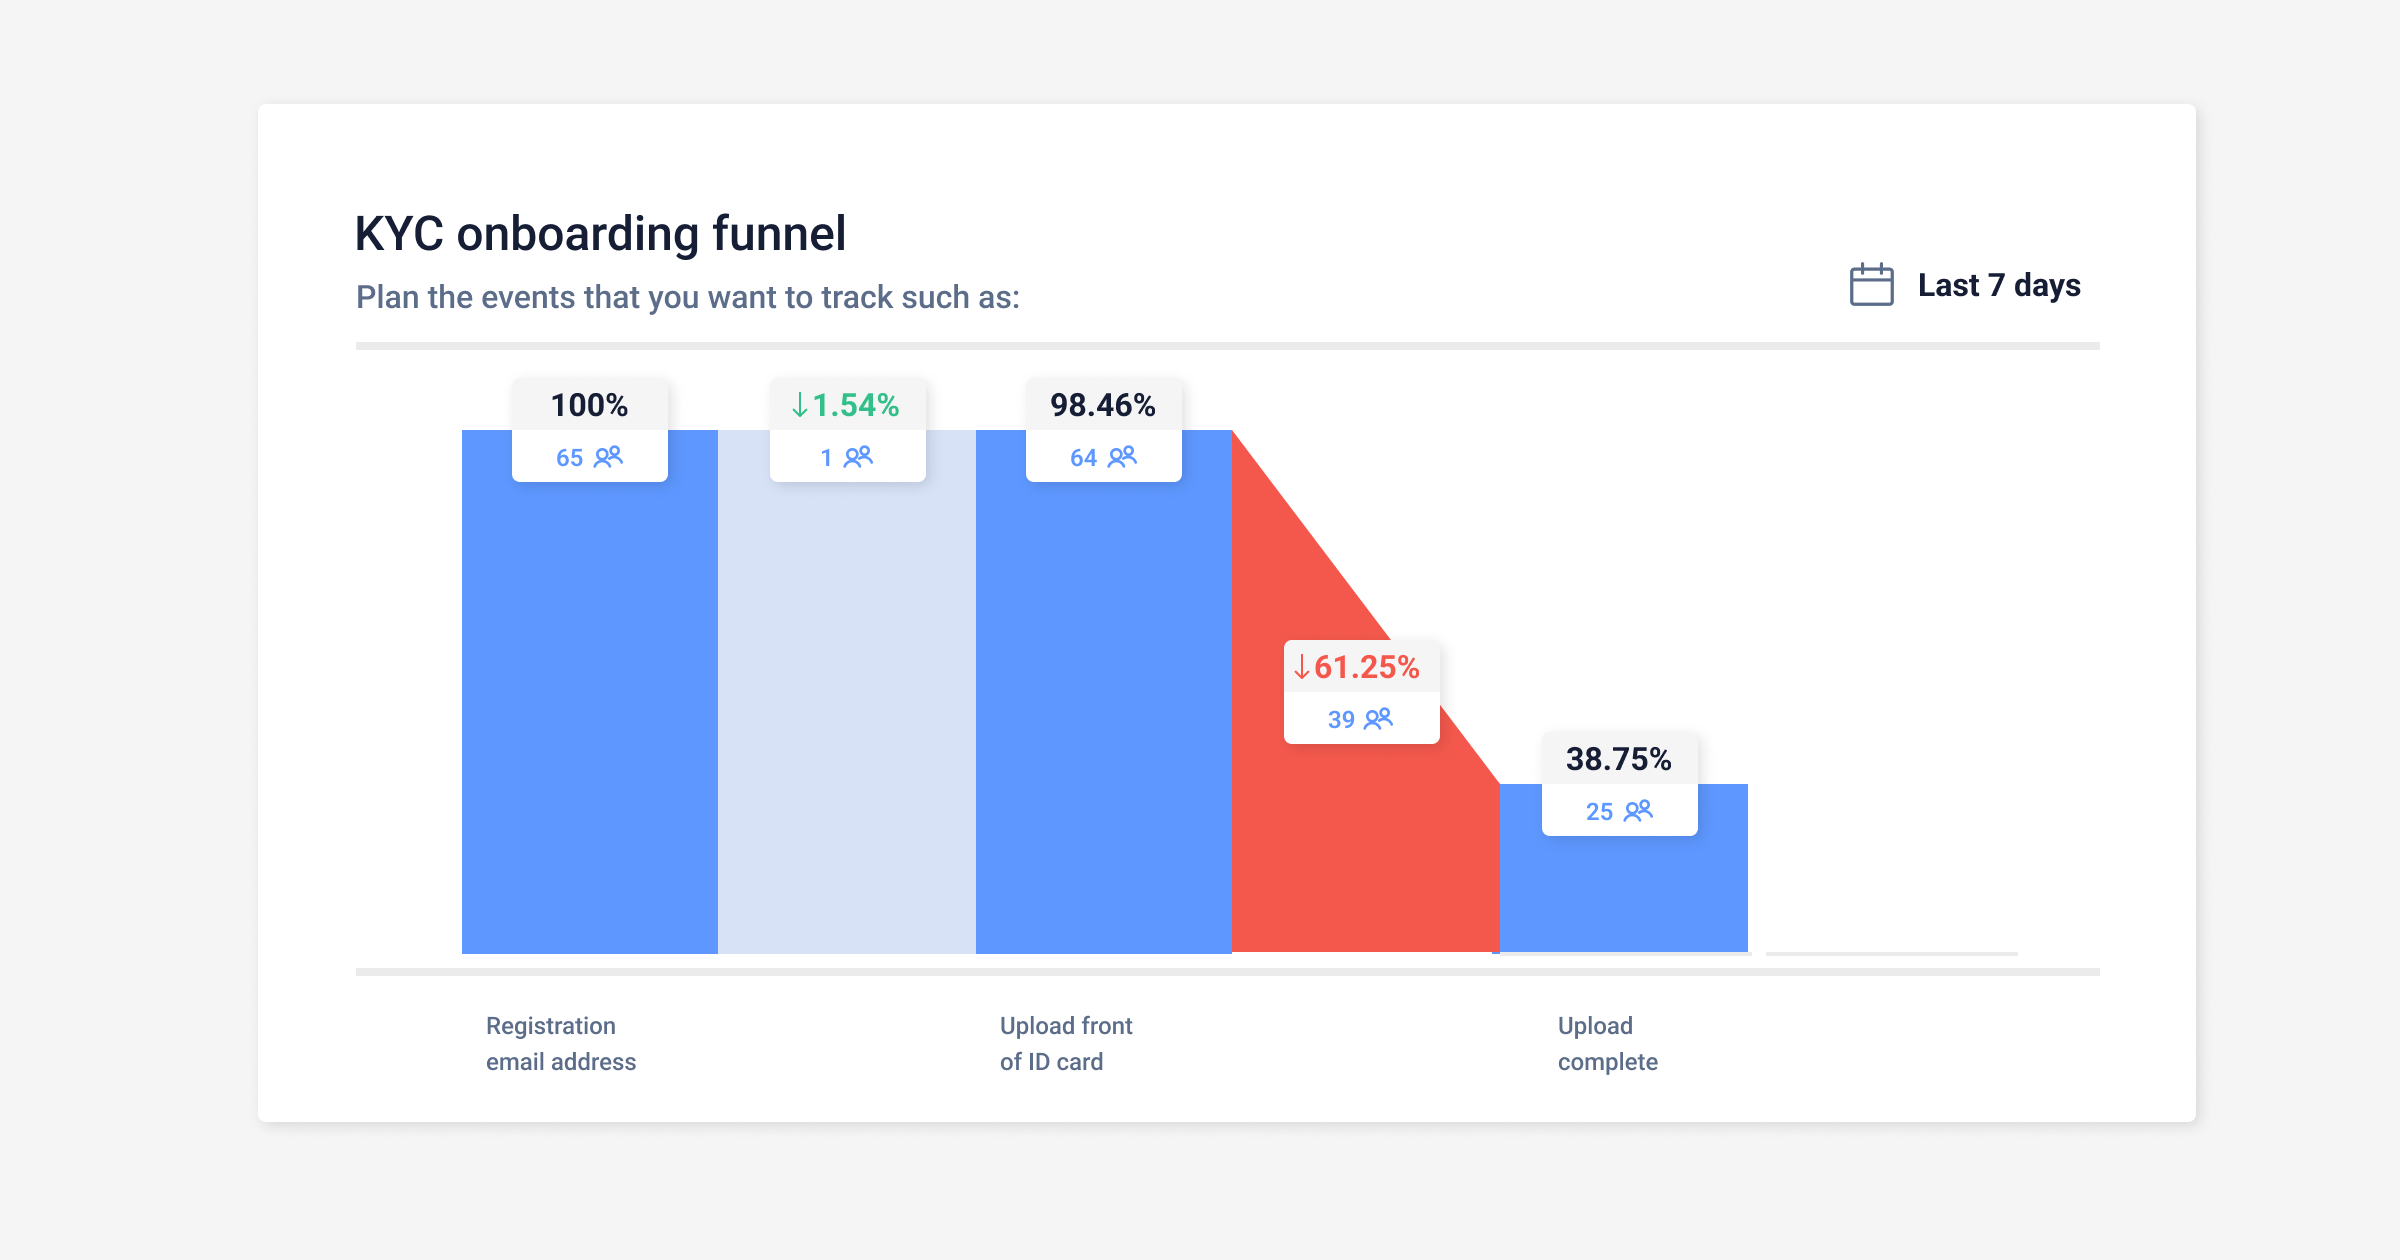
Funnels: Find out which steps in your onboarding process are causing the most friction.


Pricing
UXCam has a free plan that allows unlimited users to track up to 3,000 sessions and one funnel monthly.


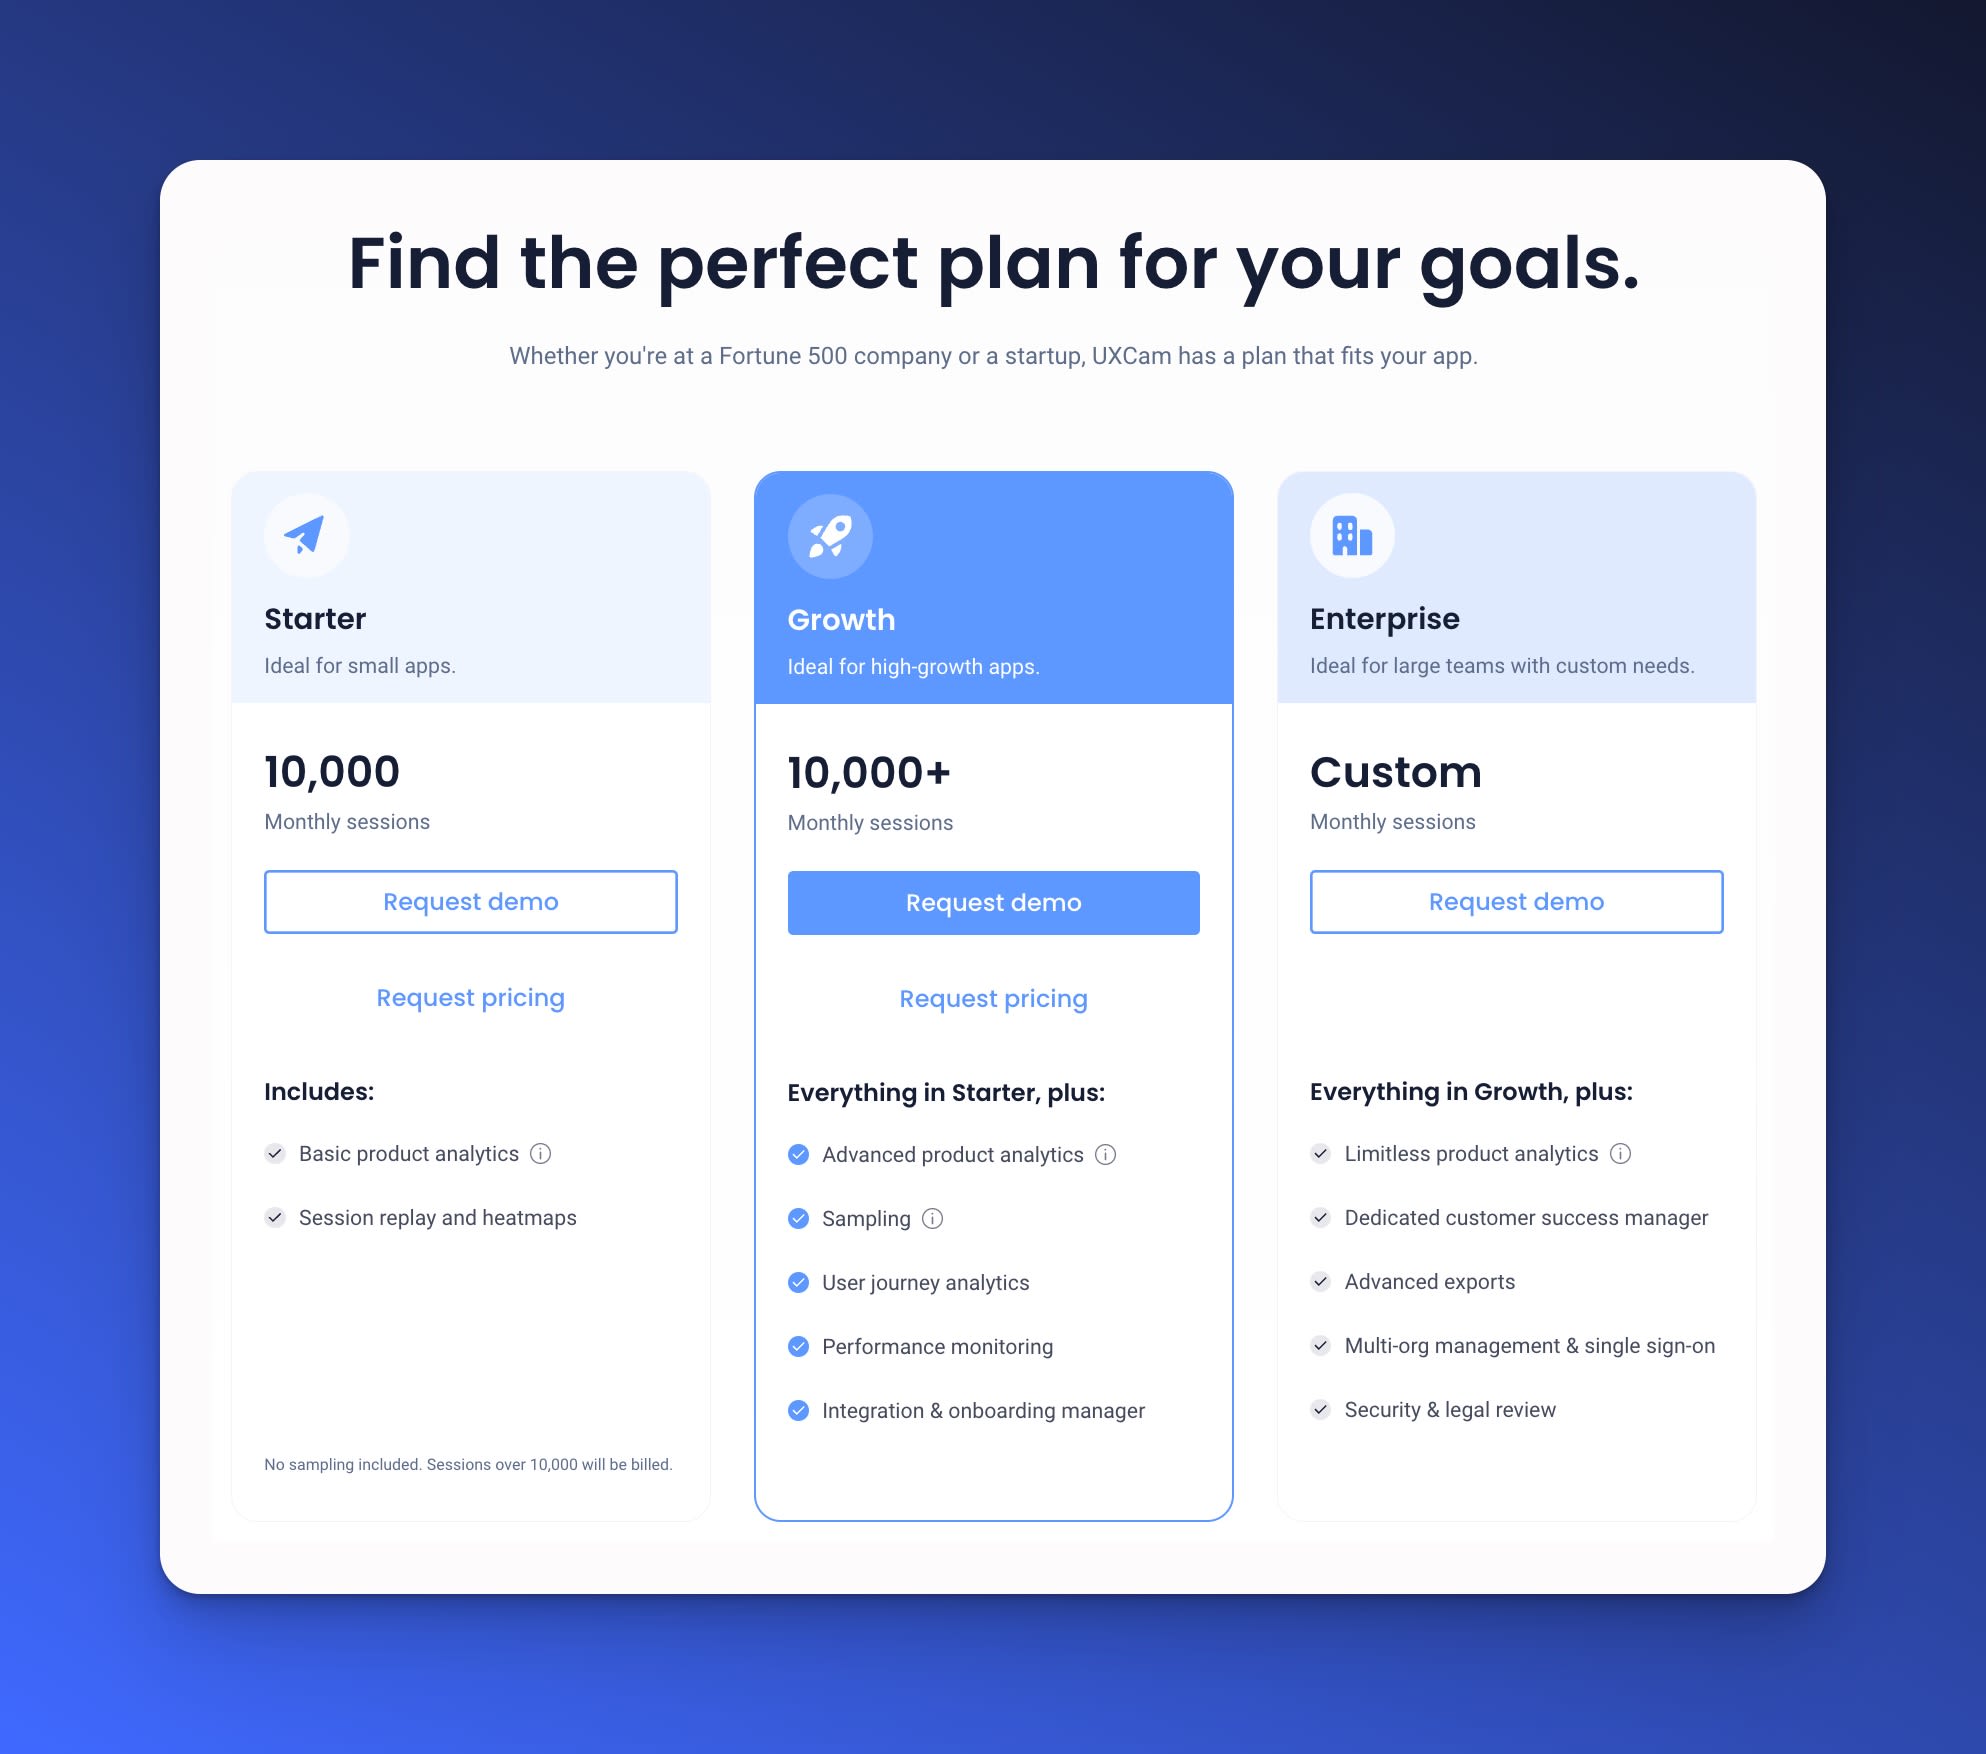
We also offer two fully customizable paid plans (Growth and Enterprise) with higher tracked session limits, more funnels, and access to advanced features like custom data retention and event analytics.
Still on the fence? You can take UXCam for a test drive with our 14-day free trial.
Pros & Cons
Pros
Comprehensive analytics tools.
Intuitive at-a-glance dashboards.
Real-time insights.
Free-forever plan.
Generous free trial.
Cons
Free plan is limited.


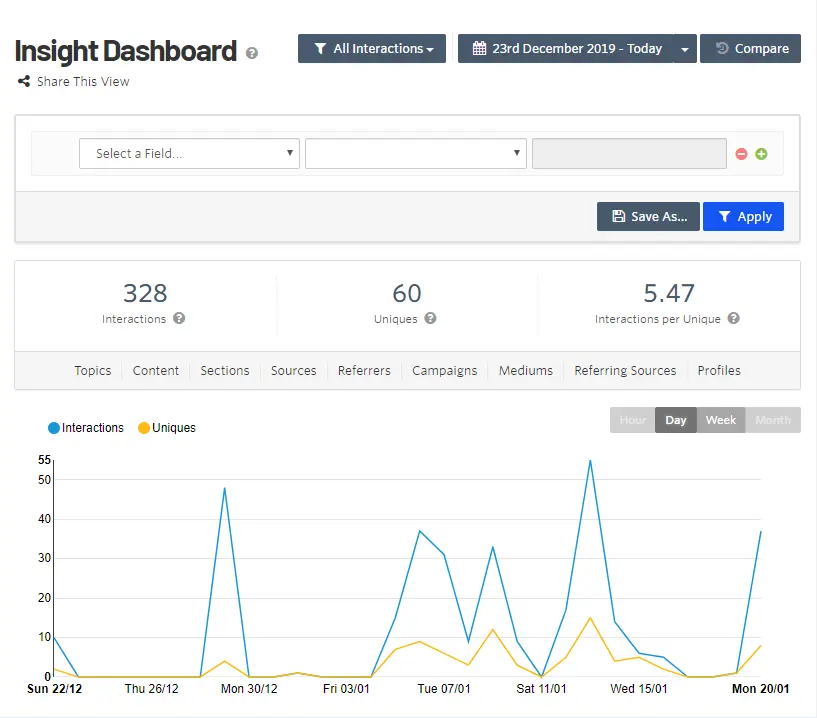
Kissmetrics
Best for Marketing Attribution


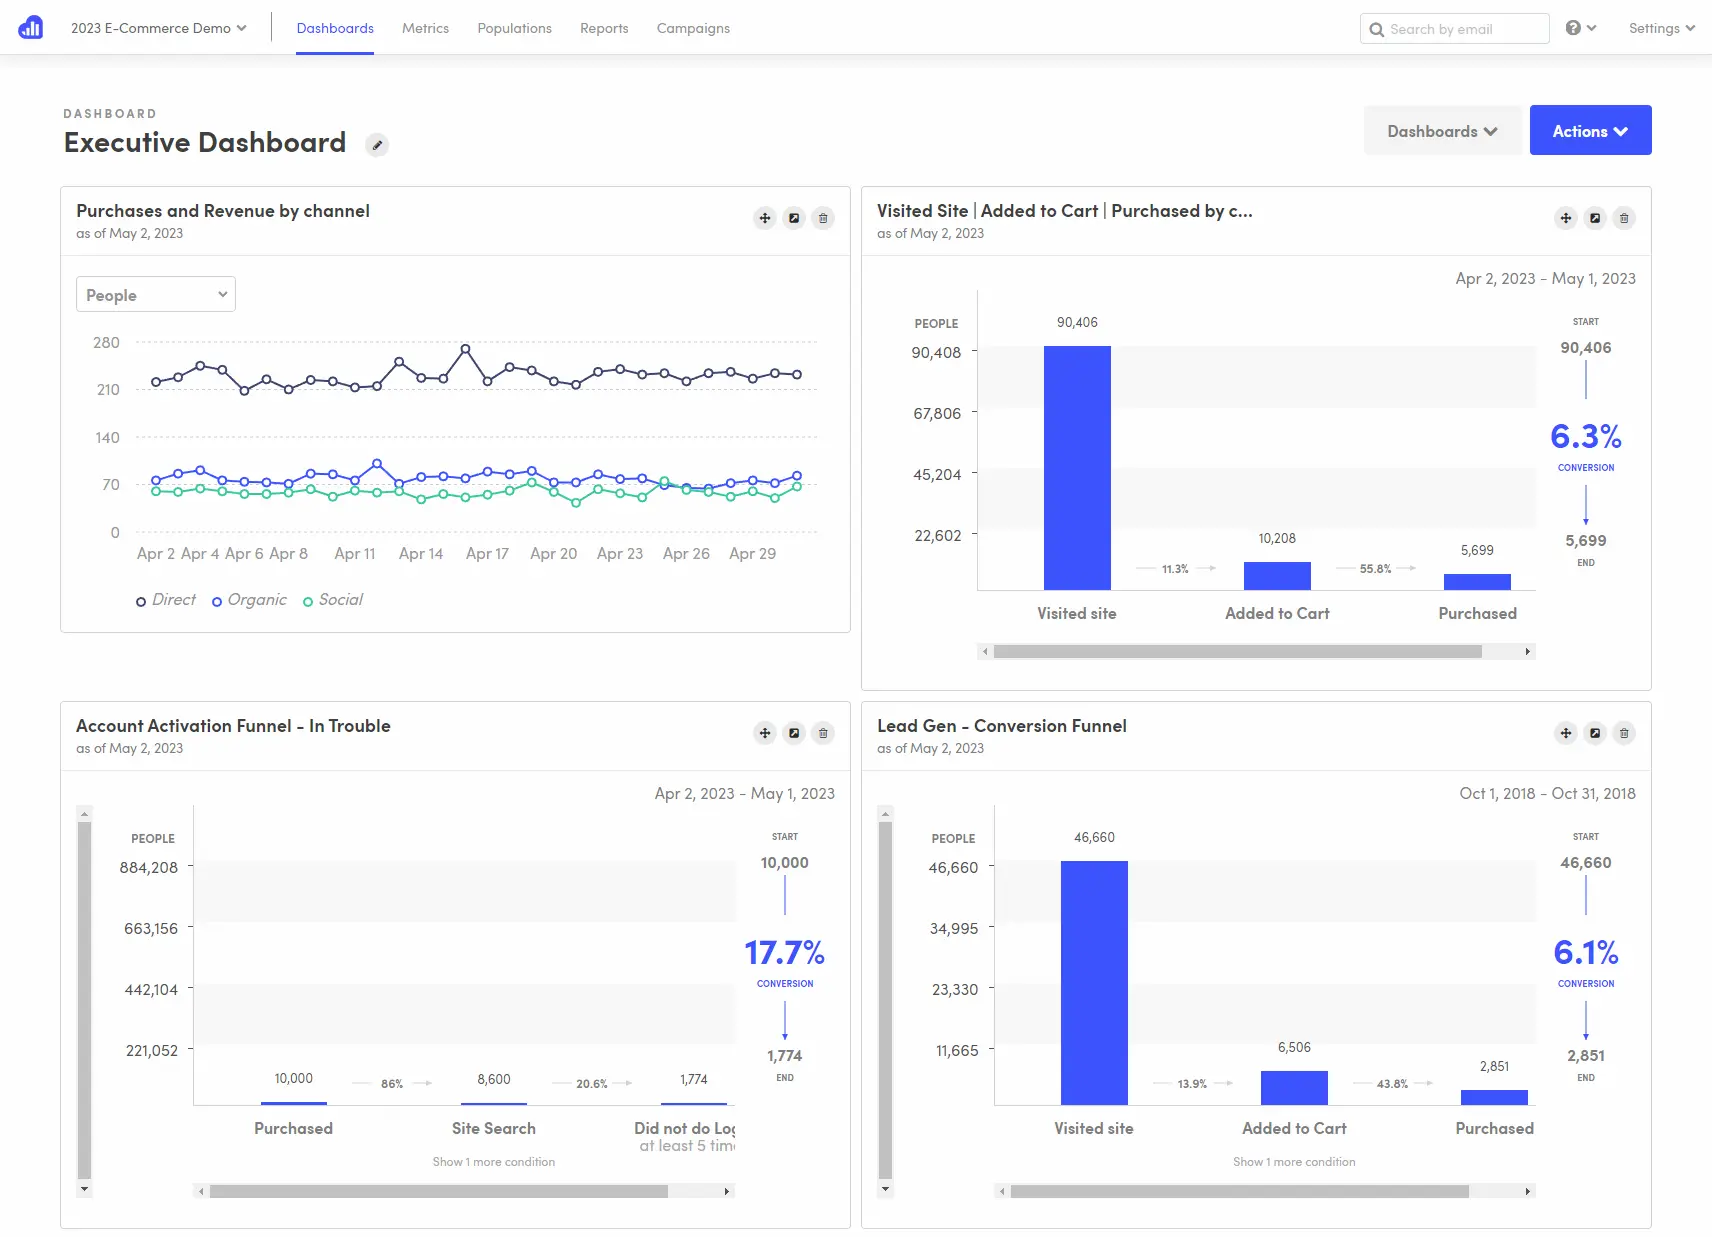
Kissmetrics is a popular analytics platform for web (and to a lesser extent, mobile) applications.
It comes with a range of tools for digging into customer behavior, including cohorts and funnel analysis, along with some reporting features. That said, the tool really shines as a marketing attribution tool, allowing you to track source and campaign performance.
Key features
Multitouch Attribution: View the entire customer journey from the first touch to conversion.
Event Tracking: Track events that matter most to your business.
Real-time Reporting: Monitor key metrics in real time.
Pricing
Kissmetrics’ Silver ($299/month) allows for 10k tracked users, 3 user seats, 10 populations (i.e., segments), and one domain.
Want to track more domains, users, and populations? You can upgrade to either Gold ($499/month) or Enterprise (custom).
Pros & Cons
Pros
Easy to set up
Clear visualization of data
Robust integrations
Cons
High cost for small businesses.
No free plan.
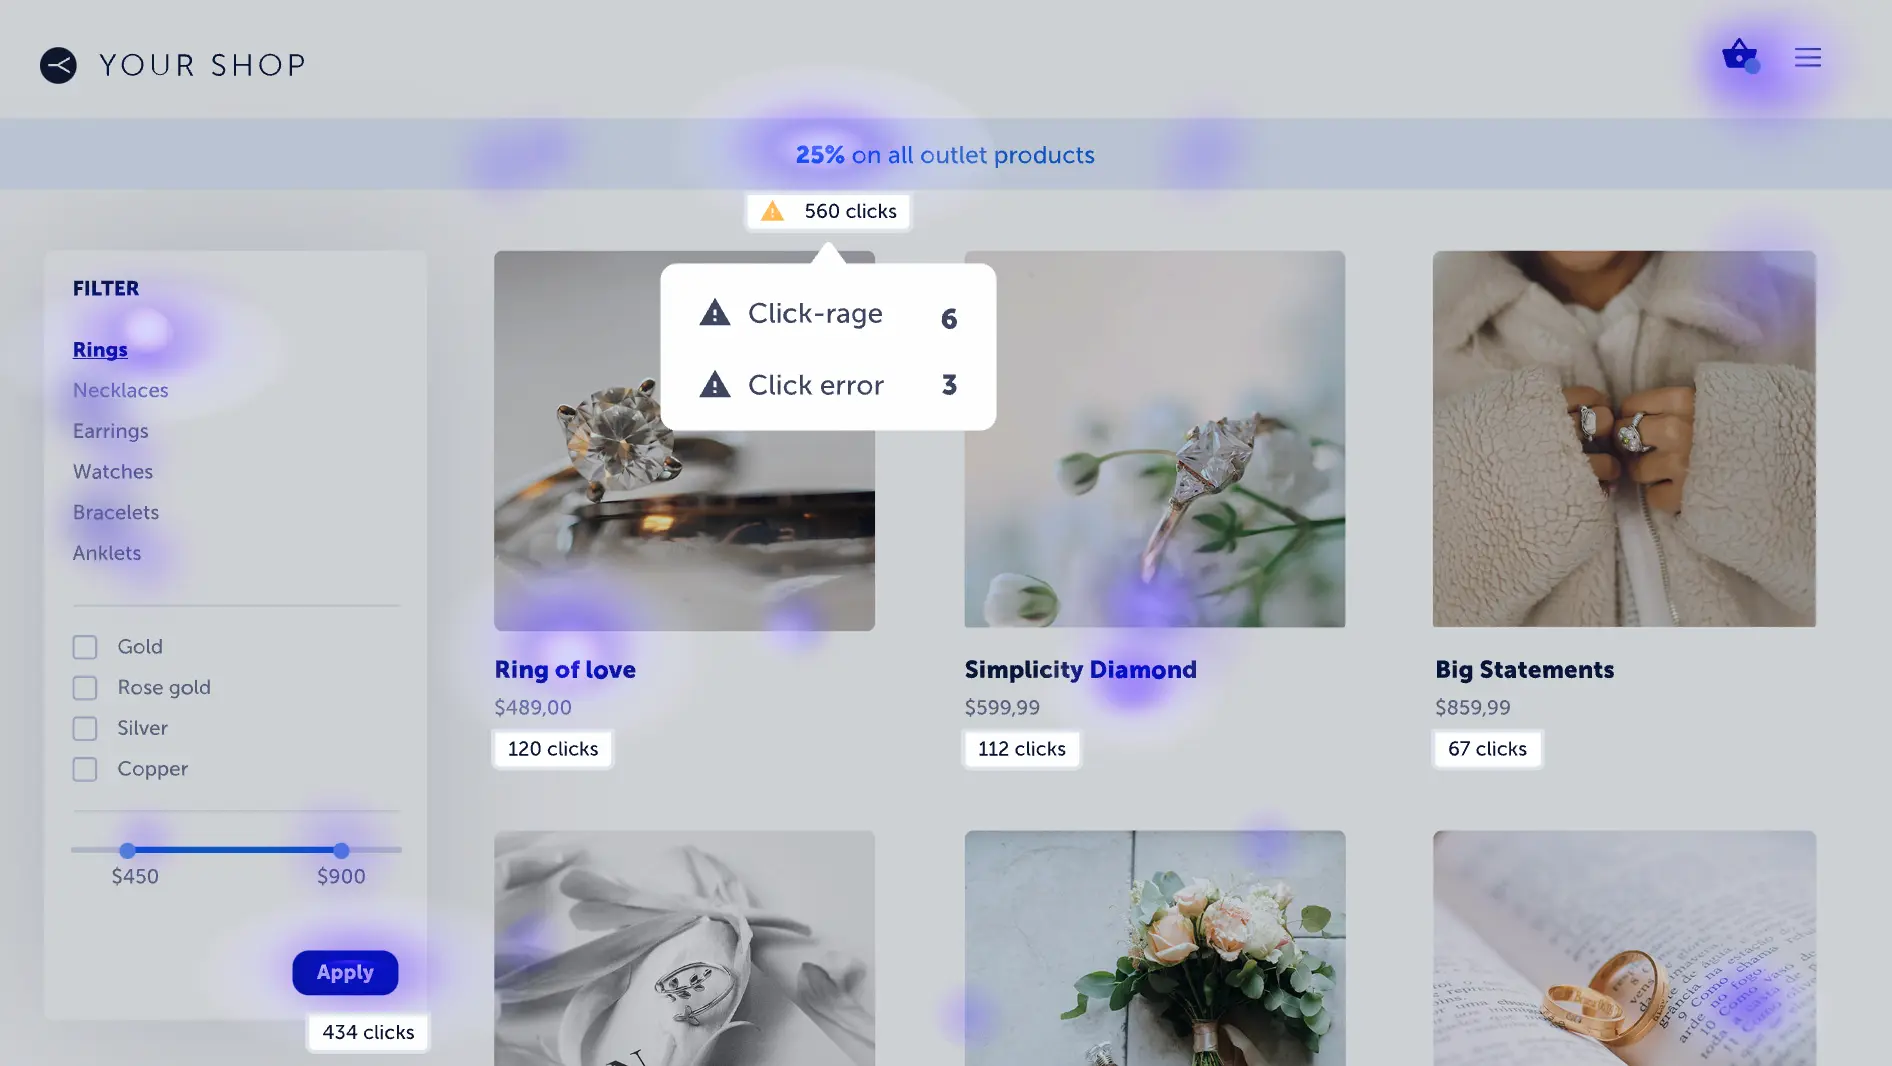
Hotjar
Best for Qualitative Data


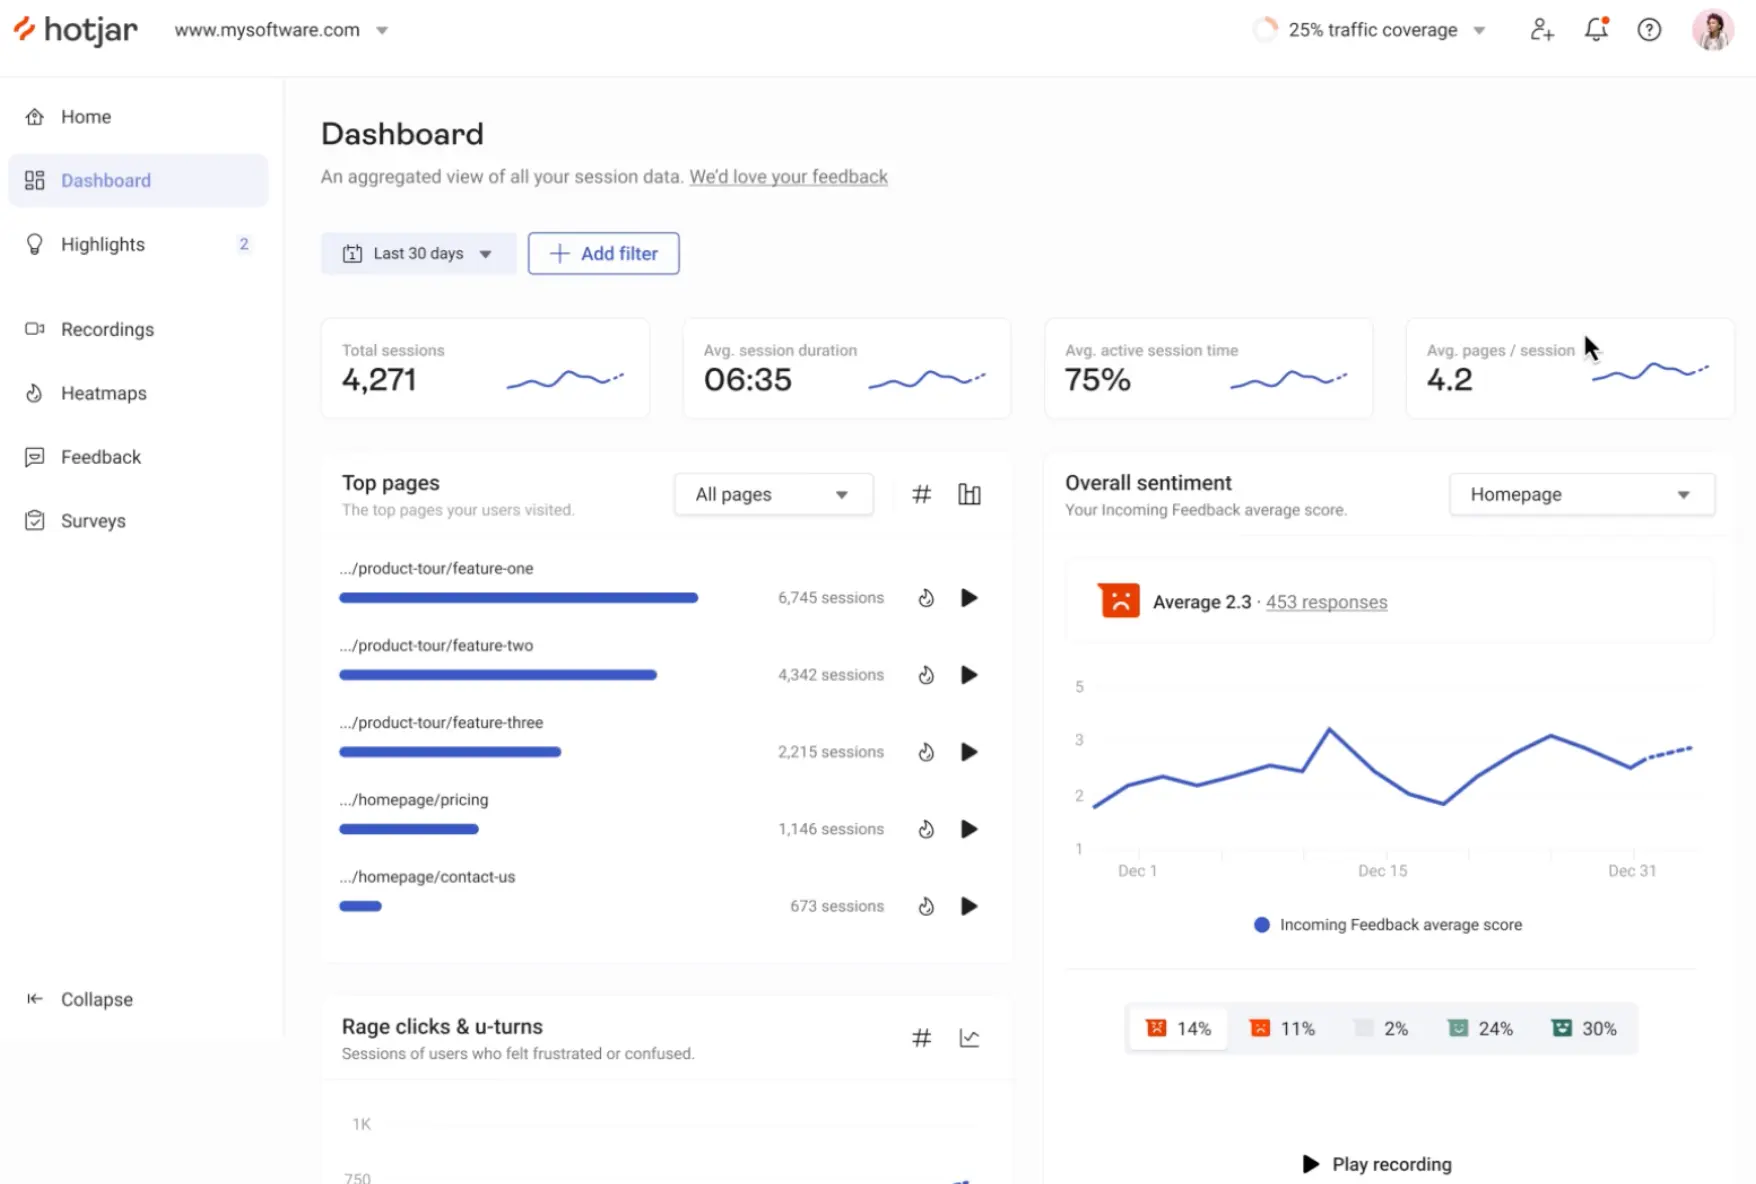
Qualitative data is a must when it comes to UX optimization—and Hotjar is a get tool to collect it.
It allows you to create heatmaps and record user sessions, helping you understand better how customers interact with your site or app. The tool also has powerful survey and 1-on-1 interview capabilities that allow you to capture real-time feedback from visitors.
Key features
Surveys & 1-on-1 Interviews: See what real users are thinking with surveys and 1-on-1 interviews.
Heatmaps: Track user interactions and behavior with heatmaps.
Intuitive Visualizations: Make insights accessible to everyone with easy-to-understand visualizations.
Pricing
Hotjar has a basic free plan that allows you to track up to 35 sessions daily.
Beyond that, there are three paid plans—Plus (€32/month), Business (€80/month), and Scale (€171/month). The higher the tier, the more advanced features you have access to.
Pros & Cons
Pros
Generous free plan.
Surveys and 1-on-1 interviews.
Intuitive heatmaps.
Cons
Pricing is expensive for the amount of tracked sessions.
Can be difficult to set up initially.
Optimizely
Best for Web Experimentation


Optimizely is a digital experience platform with powerful tools for running experiments on websites and web apps.
The platform offers a visual editor that makes it easy to create and deploy experiments (like A/B tests and multi-variant tests) without needing coding knowledge. It also includes advanced analytics tools that let you measure the impact of your changes.
Key features
Advanced A/B Testing: Run complex A/B tests with exclusions groups, targeted audiences, and custom goals.
Data Management: Manage all your data in one place with a unified dashboard.
Personalization: Create personalized experiences for different groups based on experiment outcomes.
Pricing
You’ll need to request pricing for Optimizely’s Experiment suite.
Pros & Cons
Pros
Simple setup and deployment.
Data-driven insights.
Personalization capabilities.
Cons
Can be confusing to learn.
Mouseflow
Best for Web-Based Friction Analytics


Mouseflow is an analytics tool with a powerful approach to identifying friction points.
With Mouseflow, all sessions are automatically given a Friction Score based on a range of criteria including page speed, interactions, errors, and more. This helps you quickly identify areas in your website that might need improvement.
Key features
Friction Score: Automatically generated scores that help you determine how well your website is performing.
Heatmaps: Heatmaps show you where people are clicking, scrolling, and entering text on each page of your website.
Attention Tracking: See exactly how much time people spend focused on each page of your website.
Pricing
Mouseflow has a free-forever plan that allows for up to 500 tracked sessions per month.
There are also five paid plans to choose from, ranging from Starter (€31/month) to Enterprise (custom). All features are available on each plan, so the main differentiating factors are limits and user seats.
Pros & Cons
Pros
Easy to install and set up.
Detailed friction analytics.
Clean, intuitive UI.
Cons
Low monthly tracking limits on the free plan
Tracking multiple websites is expensive.
Choosing the right alternative to Crazy Egg
Crazy Egg is a popular user experience and web analytics platform.
It helps visualize user behavior by creating heatmaps, scroll maps, confetti reports, recordings, and A/B tests. It’s fast, free to use (for basic features), and incredibly easy to set up—just add a piece of code, and you’re ready to go.
Why look for a Crazy Egg alternative?
Crazy Egg isn't a perfect tool—shocking, I know. Here are some areas where it struggles, according to G2 reviewers:
Ease of use
Crazy Egg scores a 7.4/10 for “ease of use”—far below the 8.6/10 average for competing tools.
Quality of support
Crazy Egg scores slightly better for “quality of customer support”, with a rating of 7.7./10. That said, the average for this category is 8.6/10.
Generate deeper UX insights with UXCam
Product teams are spoiled for choice these days with the number of UX optimization tools available. It’s easier than ever to make data-driven UX decisions that radically improve the user experience of your products and services.
At UXCam, we help mobile product teams optimize their user experience by providing detailed insights into exactly how users interact with their products. With a range of tools—from heatmaps and session replays to funnel analysis and user segmentation—UXCam gives you the power to make informed decisions.
Get started with a 14-day free trial and see for yourself!
You might also be interested in these;
Crazy Egg for Mobile Apps - Pros, Cons and Best Alternative
How To Write a Tracking Plan for Mobile App Analytics
Pendo for Mobile Apps - Pricing, Review & Best Alternative
FullStory for Mobile Apps Reviewed - Features, Pros & Cons
AUTHOR
Tope Longe
Product Analytics Expert
Ardent technophile exploring the world of mobile app product management at UXCam.


Related articles


Conversion Analysis
React Native Crash Reporting + Best Tools and Techniques
Learn how to improve your mobile app's stability with effective React Native crash reporting. Explore the top techniques and tools for monitoring and managing...
Tope Longe
Product Analytics Expert


Conversion Analysis
Flutter Performance Monitoring - Best Tools and Techniques
In this article, we'll introduce you to the top Flutter performance monitoring tools and demonstrate how UXCam can help you monitor your app's performance with...
Tope Longe
Product Analytics Expert


Conversion Analysis
How to measure, analyze, and reduce app churn
All the user acquisition in the world won't matter if you've got a high churn rate on your app. If you want to know why users are uninstalling or unsubscribing, tools like screen flow, heatmaps, and screen recordings can get users loving — instead of leaving your...
Tope Longe
Product Analytics Expert