Customer Journey Visualization - A Step-by-Step Guide


Looking for effective strategies to enhance your customer journey visualization? Whether you're a product manager, UX designer, or part of the customer success and marketing team, mapping out this journey helps you see your app from your users' perspective.
This process can reveal valuable insights, helping you identify opportunities for improvement and enhancing the overall user experience.
Benefits of customer journey visualization
Take a moment to consider these benefits of customer journey visualization:
Enhanced User Experience: Understand pain points and streamline the user journey.
Increased Engagement: Identify opportunities to engage users at critical touchpoints.
Data-Driven Decisions: Use visual data to inform product development and marketing strategies.
In this guide, we'll take you through the essential steps to visualize your customer's journey, the tools that can streamline this process, and strategies to engage different stakeholders in your team. By the end, you'll be equipped with the knowledge to create a compelling and effective customer journey map that drives results.
What is customer journey visualization?
Customer journey visualization is the process of creating a visual representation of all the touchpoints and interactions a customer has with a brand, from initial awareness through to post-purchase support.
It is a strategic tool used to map out the entire experience a customer has with a product, service, or brand. This visualization typically takes the form of a diagram or map that illustrates the customer's path, including their actions, thoughts, and emotions at each stage.
Key aspects of customer journey visualization include:
Touchpoints: All interactions between the customer and the company, both online and offline.
Stages: The different phases a customer goes through, such as awareness, consideration, purchase, and loyalty.
Emotions: How the customer feels at various points in their journey.
Pain points: Areas where customers experience difficulties or frustrations.
Opportunities: Potential areas for improvement or innovation.
The main goal of this visualization is to gain insights into the customer experience, identify areas for improvement, and align business strategies with customer needs and expectations. For mobile app teams, this visualization becomes even more crucial. Each tap, swipe, or interaction within the app can be a touchpoint that needs to be understood and optimized.
A well-mapped customer journey allows product managers, UX designers, customer success teams, and marketers to collaborate more effectively. By engaging with a shared vision, teams can prioritize features, enhance user experience, and ultimately drive higher customer satisfaction and retention.
Steps to visualize your customer's journey
Customer journey visualization isn't just about creating pretty diagrams; it's about gaining deep insights that drive product decisions and business growth. Below, we dive into the essential steps to create a powerful customer journey visualization that can transform your product strategy.
1. Understand the importance of customer journey visualization
Before diving into the process, it's crucial to grasp why this exercise is so valuable. Customer journey visualization isn't just a trendy buzzword - it's a strategic tool that allows you to:
Identify pain points and opportunities for improvement
Align your team around a shared understanding of the customer experience
Make data-driven decisions about product development and marketing strategies
Increase customer satisfaction and loyalty by addressing unmet needs
Your product doesn't exist in a vacuum. It's part of a larger ecosystem of customer interactions, and understanding that ecosystem is key to your success.
2. Define clear goals and objectives
You have to begin customer journey visualization with clear objectives to ensure your efforts are focused and measurable, aligning with broader business goals. Here's how to set these effectively:
Define Your Purpose: Identify specific reasons for the visualization, such as reducing customer churn, discovering upselling opportunities, unifying team vision, or shaping product strategies. A well-defined purpose guides all subsequent activities.
Set Specific Goals: Develop SMART goals to provide concrete targets and benchmarks for evaluation, like:
Boosting retention by 15% in six months.
Halving new user time-to-value by Q4.
Increasing satisfaction at critical points by 20% annually.
Establish the Scope: Determine which customer segments, timeframes, and touchpoints to focus on. Aim for a detailed analysis of key areas over a superficial overview, considering your resource constraints.
3. Identify your key customer personas
The foundation of any good customer journey map is a set of well-defined personas. These aren't just demographic profiles - they should be rich, narrative descriptions of your typical users, including their goals, motivations, and pain points.
Pro tip: Don't create personas in isolation. Use data from customer interviews, surveys, and analytics to inform these profiles. The more accurate your personas, the more valuable your journey map will be.
4. Map out the initial contact points
Now that you know who your customers are, it's time to explore how they first encounter your product or brand. This could include:
Social media interactions
Search engine results
Word-of-mouth referrals
Advertisements
Each of these touchpoints is an opportunity to make a positive first impression. By mapping them out, you can ensure you're putting your best foot forward at every possible entry point.
5. Analyze the path to purchase
This is where things get really interesting. The path to purchase is rarely linear, especially for complex products or B2B sales. Your visualization should capture:
Information-gathering stages
Comparison with competitors
Interactions with sales or support teams
Trial periods or demos
Don't just focus on the ideal path - be sure to include common detours or roadblocks that customers encounter. These often provide the most valuable insights for improvement.
6. Highlight critical decision points
Within the customer journey, there are pivotal moments that can make or break the relationship. These might include:
The decision to start a free trial
Choosing between different pricing tiers
Opting for a renewal or upgrade
Your visualization should emphasize these moments, making it clear to everyone in your organization where to focus their efforts for maximum impact.
7. Incorporate user feedback loops
A static customer journey map quickly becomes outdated. To keep your visualization relevant, build in mechanisms for continuous user feedback. This could include:
In-app surveys
Customer support ticket analysis
Regular user testing sessions
By actively seeking and incorporating user feedback, you ensure that your journey map evolves along with your customers' needs and expectations.
8. Use data analytics for deeper insights
While qualitative data is invaluable, don't neglect the power of quantitative analytics. Use tools like:
Heatmaps and tap tracking
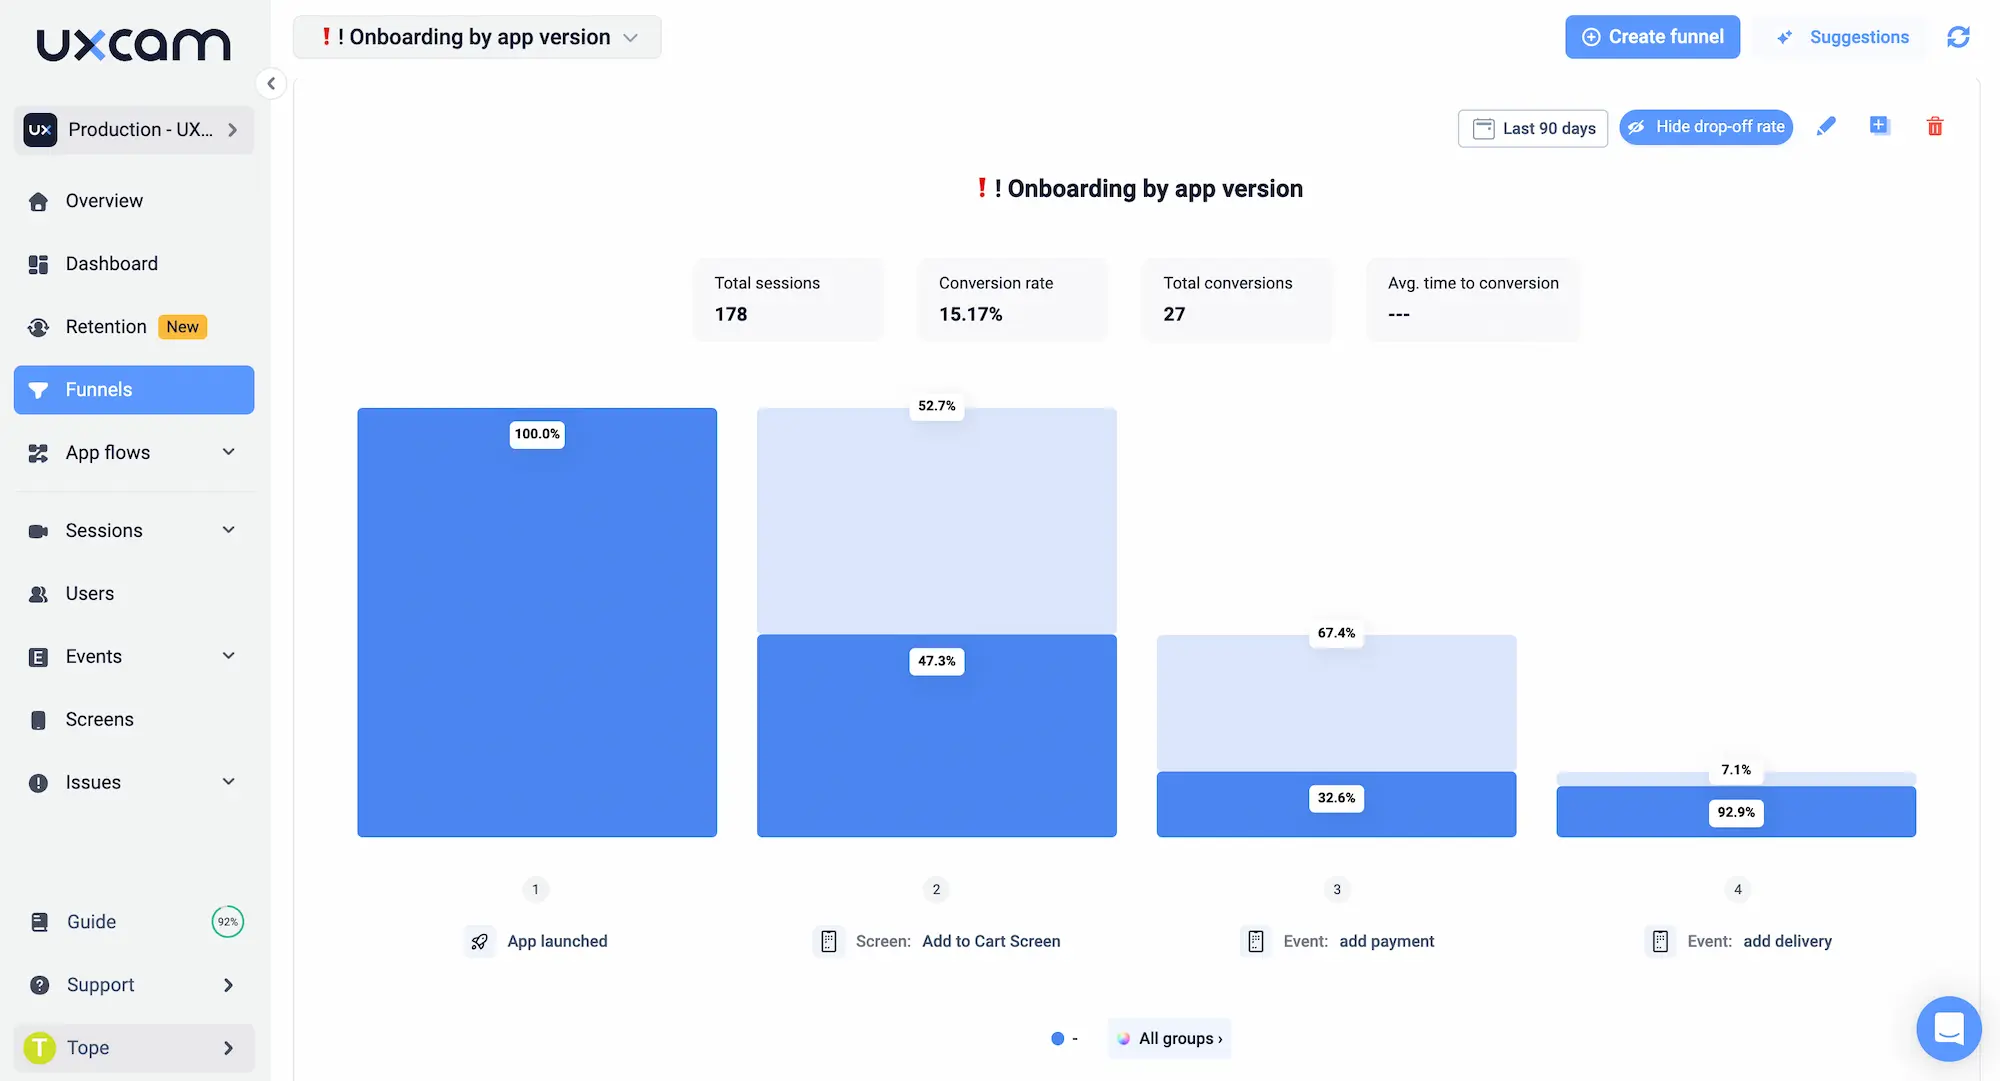
Funnel analysis
Cohort analysis
These data-driven insights can validate (or challenge) your assumptions about the customer journey, leading to more informed decision-making.
9. Continuous improvement plan
Your customer journey visualization isn't just a pretty picture - it's a strategic tool. Use it to create an actionable improvement plan:
Identify the biggest pain points or drop-off areas in the journey
Prioritize these issues based on potential impact and feasibility of solutions
Create cross-functional teams to address each priority area
Set clear KPIs to measure the success of your interventions
Regularly review and update your journey map based on new data and implemented changes
The goal isn't perfection - it's progress. By committing to continuous improvement, you'll create a product that truly resonates with your customers' needs and desires.
Top tools for customer journey visualization
Below we share top picks for tools that can help you create insightful, actionable customer journey maps. These recommendations are based on real-world application and value, focusing on what truly matters for product teams aiming to enhance their customer understanding.
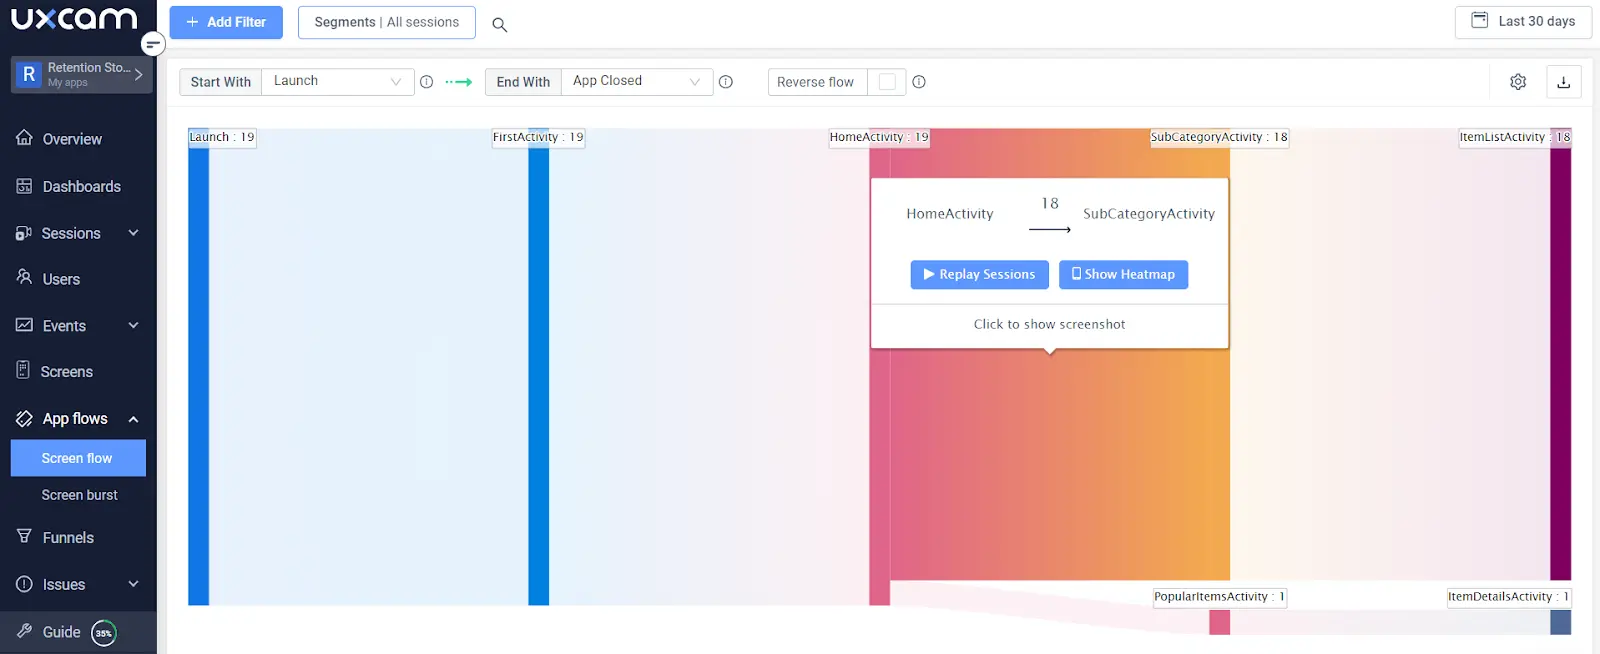
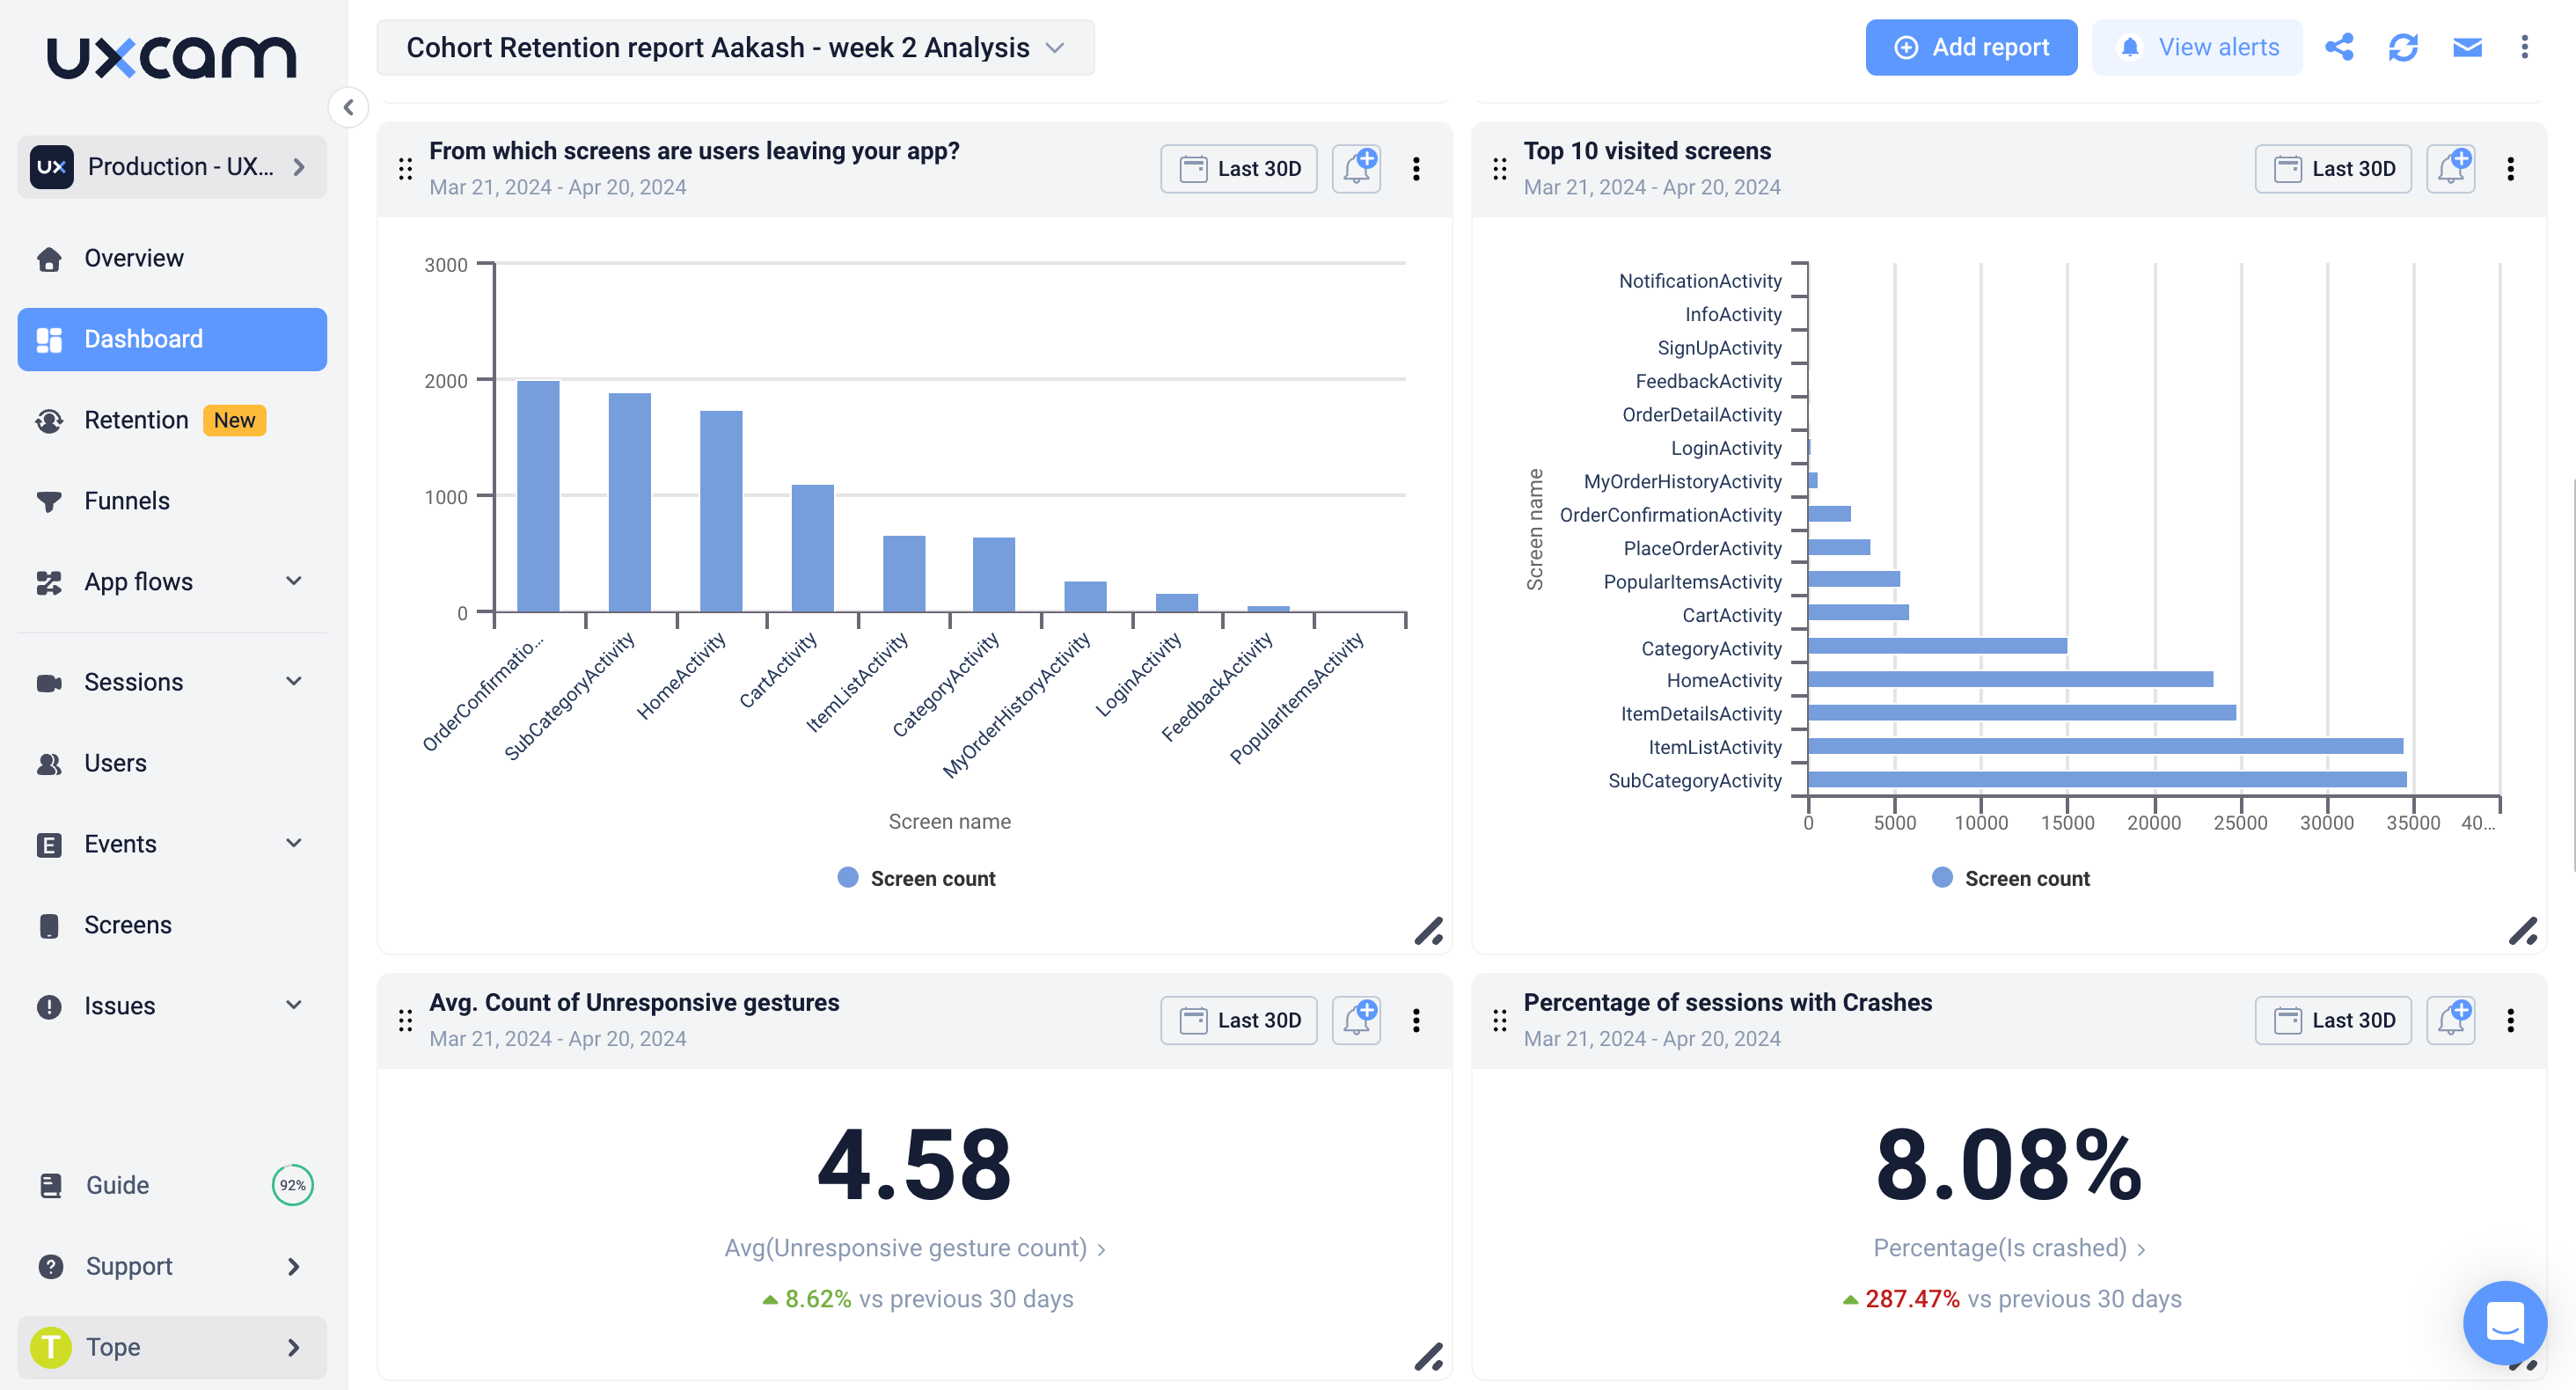
1. UXCam - For mobile app journey insights
UXCam stands out for mobile app analytics and user experience tracking. Its strength lies in providing granular insights into how users interact with your mobile application.


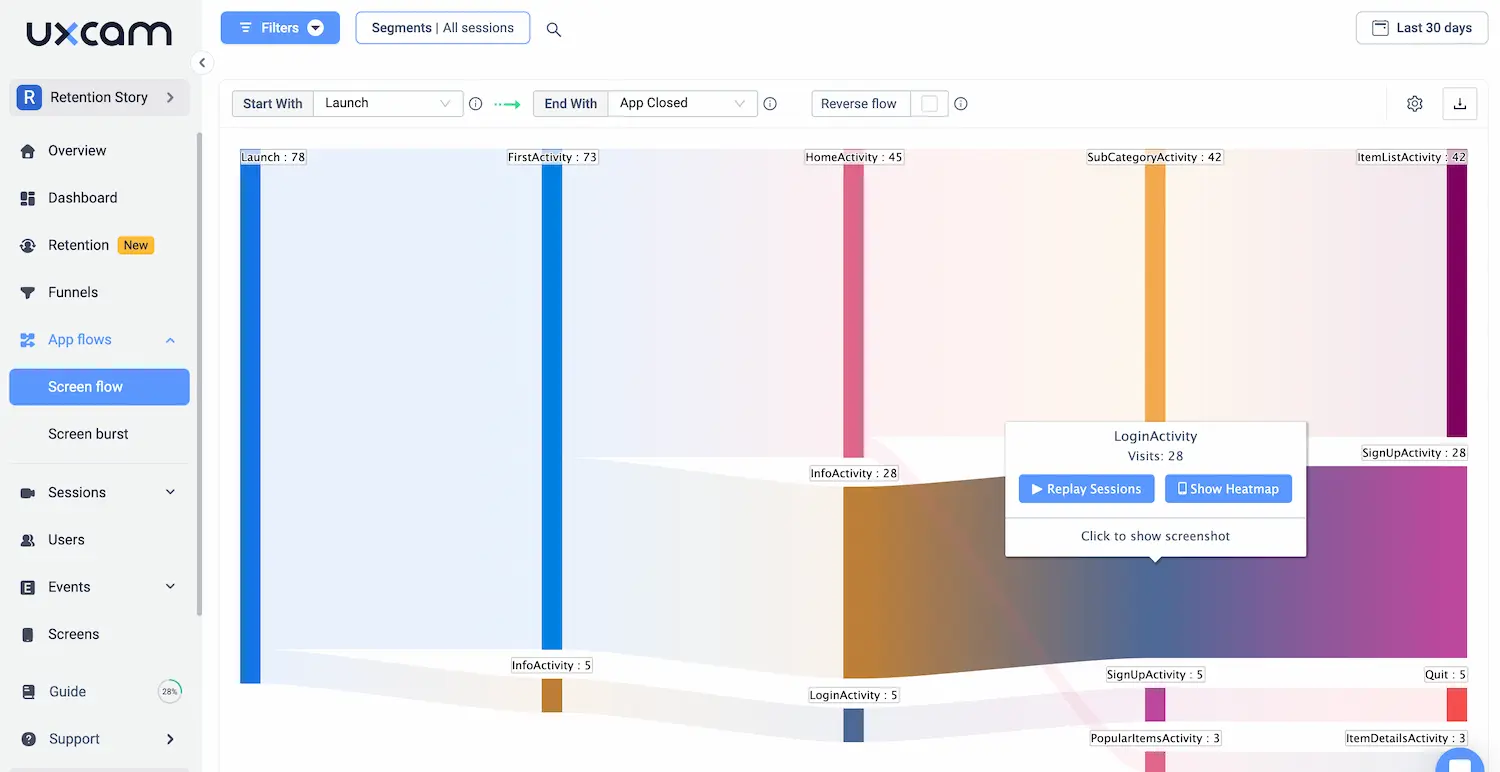
Key features:
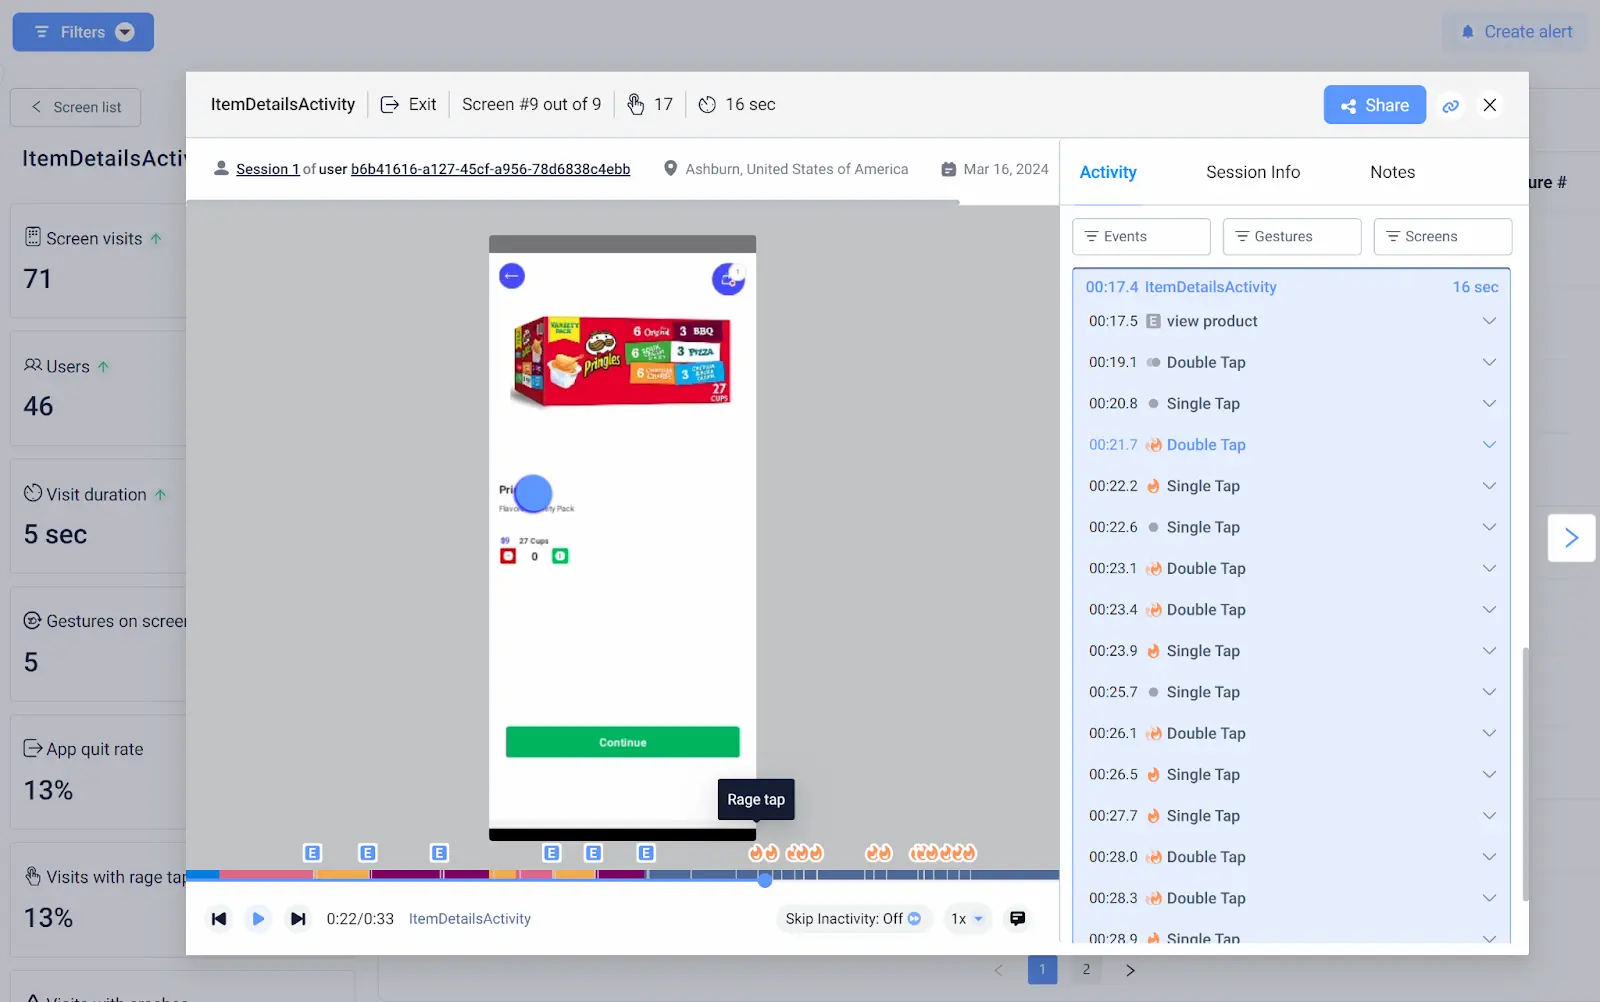
Session recordings: Watch real user interactions to identify pain points
Heatmaps: Visualize where users tap, swipe, and spend time in your app
Funnel analysis: Track user progression through key journeys
Crash analytics: Quickly identify and resolve issues affecting the user experience
UXCam is particularly valuable for product managers focused on mobile-first experiences, offering a deep dive into user behavior that can inform journey mapping and product improvements.
2. Miro - For collaborative journey mapping
Miro's infinite canvas and real-time collaboration features make it an excellent choice for teams creating and iterating on customer journey maps together.
Standout capabilities:
Customizable templates for various journey map styles
Rich media integration (images, videos, documents)
Real-time collaboration and commenting
Integration with other tools like Jira and Trello
Miro shines in cross-functional team environments, allowing stakeholders from different departments to contribute their insights to the journey mapping process.
3. Lucidchart - For detailed, data-driven visualizations
Lucidchart offers a powerful platform for creating professional-grade customer journey visualizations that can easily incorporate data from various sources.
Notable features:
Extensive shape libraries and templates
Data linking capabilities to create dynamic, data-driven visuals
Revision history and version control
Enterprise-grade security and permissions
This tool is particularly useful for product managers who need to create complex, data-rich journey maps that can be easily updated and shared across large organizations.
4. Hotjar - For website behavior analysis
Hotjar combines several powerful features that can inform your web-based customer journey visualizations.
Key offerings:
Heatmaps: Visual representation of where users click, move, and scroll
Session recordings: Playback of real user interactions on your site
Feedback polls and surveys: Gather qualitative data directly from users
Funnel visualization: Identify where users drop off in critical journeys
Hotjar is invaluable for understanding the nuances of user behavior on websites, providing both quantitative and qualitative data to enrich your journey maps.
5. Smaply - For holistic journey mapping
Smaply is purpose-built for customer journey mapping, offering a comprehensive set of tools for creating detailed, multi-layered journey visualizations.
Standout features:
Persona creation tools
Stakeholder maps
Journey mapping with emotional lanes
Collaborative features for team input
This tool is particularly suited for product managers who want to create rich, detailed journey maps that incorporate multiple aspects of the customer experience.
6. Google Analytics - For Data-Driven Insights
While not a journey mapping tool per se, Google Analytics is crucial for informing your journey visualizations with real user data.
Key benefits:
User flow visualization
Behavior flow analysis
Goal funnel visualization
Custom report creation
Google Analytics provides the quantitative backbone for your journey maps, helping you validate assumptions and identify key areas for focus.
How to choose the right tool
The best customer journey visualization tool for your team depends on several factors:
The complexity of your customer journey
Your team's collaboration needs
The type of product or service you're mapping (e.g., mobile app vs. website)
Integration requirements with existing tools and data sources
Budget and scalability needs
Tools are just a means to an end. The real value comes from the insights you derive and how you apply them to improve your product and customer experience.
Sometimes, a combination of tools often yields the best results. For instance, using UXCam for mobile app insights and data validation, Miro for collaborative mapping, can provide a comprehensive view of your customer's journey.
How to engage stakeholders in the visualization process
Below we share battle-tested strategies for involving key players across your organization, ensuring your journey maps drive product innovation and deliver measurable business impact.
Before diving into engagement tactics, let's identify the key stakeholders in the customer journey visualization process:
Executive leadership
Design team
Engineering team
Sales and marketing
Customer support
Data and analytics team
Each group brings unique insights and expertise to the table. Your role is to orchestrate these diverse perspectives into a cohesive, actionable journey map.
Here are top strategies for engaging different stakeholder groups;
1. Executive leadership: Aligning with business strategy
To engage executives effectively:
Frame journey mapping as a strategic tool for achieving key business objectives
Present data-driven insights that demonstrate potential ROI
Connect journey improvements to competitive advantage and market positioning
Funnel analysis: Leverage UXCam's funnel analysis to showcase how optimizing critical user journeys directly impacts conversion rates and revenue. This data-driven approach resonates strongly with executive stakeholders and helps justify resource allocation for journey improvement initiatives.


2. Design team: Translating insights into user-centric solutions
Engage your design team by:
Involving them early in the journey mapping process to ensure visual representation of insights
Using journey maps to prioritize design sprints and UX research
Collaborating on creating design patterns that address common pain points across the journey
Pro tip: Use UXCam's session recordings to provide designers with real-world examples of user interactions. This tangible evidence can inspire more intuitive and user-friendly design solutions.


3. Engineering team: Bridging customer needs with technical feasibility
To effectively engage your engineering team:
Involve them in journey mapping sessions to understand technical constraints and opportunities
Use journey insights to inform and prioritize the technical roadmap
Collaborate on defining and measuring technical KPIs that align with journey improvement goals
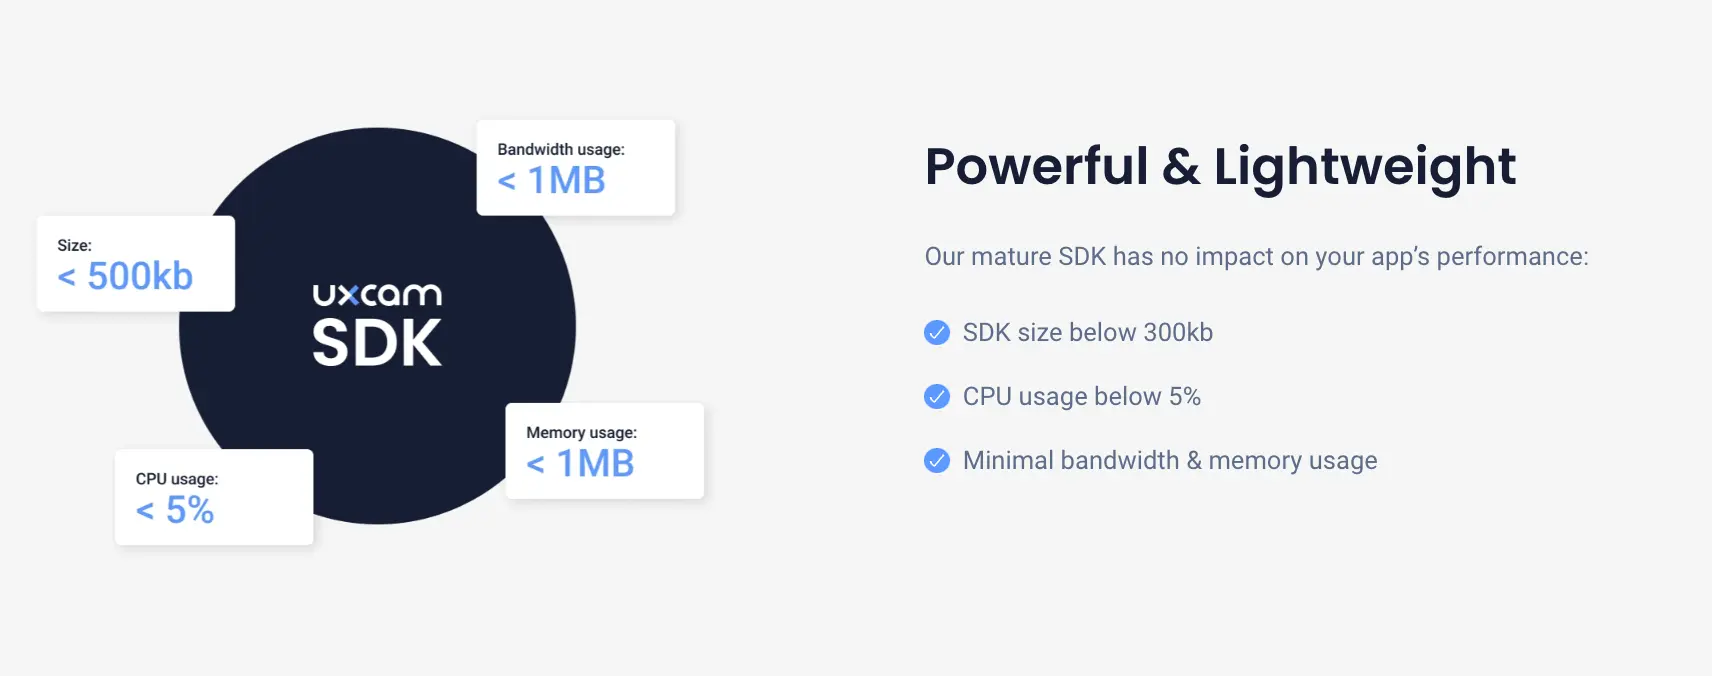
Technical integration: Show your team how UXCam's light-weight SDK can be seamlessly integrated into the development process, providing ongoing insights without significant overhead. This can help engineers see the direct impact of their work on user experience.


4. Sales and marketing: Aligning the customer journey with go-to-market strategies
Engage sales and marketing teams by:
Mapping the customer journey alongside the sales and marketing funnels
Using journey insights to refine messaging, targeting, and positioning
Collaborating on identifying and addressing drop-off points in the customer acquisition process
Data-driven insight: Utilize UXCam's heatmaps to show marketing teams how users interact with in-app promotional content or onboarding flows. This can help optimize marketing strategies and improve user activation rates.


5. Customer support: Harnessing front-line insights
To leverage the valuable insights of your support team:
Conduct regular feedback sessions with support staff to understand common user pain points
Incorporate support ticket data and trends into your journey maps
Involve support leads in journey mapping workshops to ensure their front-line perspective is represented
Support integration: Use UXCam's user journey flow to give support teams context on a user's journey leading up to an issue. This can improve resolution times and provide valuable data for journey improvement.


6. Data and analytics team: Driving data-informed decisions
Engage your data team by:
Collaborating on defining key metrics for each stage of the customer journey
Involving them in setting up tracking and measurement frameworks for journey improvements
Leveraging their expertise to conduct deep-dive analyses on user behavior and journey patterns
Analytics synergy: Combine UXCam's quantitative and qualitative behavioral data with your broader analytics stack to create a comprehensive view of the user journey. This holistic approach can uncover insights that might be missed when looking at data in silos.


Cross-functional collaboration in customer journey mapping
While engaging individual stakeholder groups is crucial to achieve your customer journey visualization, the real magic happens when you bring everyone together. Here's how to foster cross-functional collaboration:
Journey Mapping Workshops: Organize regular workshops where representatives from each stakeholder group collaborate on journey mapping exercises. Use these sessions to break down silos and foster a shared understanding of the customer experience.
Agile Journey Squads: Form cross-functional teams responsible for specific journey stages or key user flows. These squads should have the autonomy to implement and iterate on improvements quickly.
Continuous Communication: Establish a regular cadence of updates and check-ins to keep all stakeholders informed and engaged. Consider using a dedicated Slack channel or project management tool to facilitate ongoing collaboration.
Shared OKRs: Develop Objectives and Key Results (OKRs) that align journey improvement goals with broader business objectives. This ensures all teams are working towards common goals.
Celebration and Recognition: When journey improvements lead to positive outcomes, celebrate these wins across all involved teams. This reinforces the value of collaboration and keeps stakeholders motivated.
Overcoming Common Challenges
You'll likely encounter some hurdles in stakeholder engagement. Here's how to address them:
Competing Priorities: Align journey improvement initiatives with departmental KPIs to demonstrate relevance to each stakeholder group. Show how improving the customer journey can help each team achieve their specific goals.
Data Overload: With tools like UXCam providing a wealth of data, stakeholders can sometimes feel overwhelmed. Focus on presenting actionable insights rather than raw data. Use CX dashboards and clear narratives to make the data accessible and meaningful.
Short-Term Thinking: Some stakeholders may push for quick wins at the expense of long-term journey improvements. Use data and customer stories to illustrate the long-term value of investing in the overall journey. UXCam's cohort analysis can be particularly useful in demonstrating the long-term impact of journey improvements on user retention and lifetime value.
Resistance to Change: Use compelling user stories and data visualizations to illustrate the need for change. UXCam's session recordings can be particularly powerful in bringing user pain points to life and building empathy across teams.
Limited Resources: Start with high-impact, low-resource initiatives to build momentum and demonstrate value. Use data from UXCam to identify these "low-hanging fruit" opportunities that can deliver quick wins.
Conclusion
Mastering customer journey visualization is crucial for mobile app teams looking to enhance user experience and identify growth opportunities. By thoroughly understanding each step, leveraging the right tools, and fostering collaboration among stakeholders, you can uncover invaluable insights that lead to smart, data-driven decisions. Keep it mind that the customer journey isn't static; it's a dynamic process that needs continuous improvement and adaptation.
Ready to take your customer journey visualization to the next level? Try Uxcam for free and start transforming your user insights into actionable strategies today!
You might also be interested in these;
Your Guide to the Mobile App Customer Journey
Customer Journey Optimization: 6 Practical Steps
Top 5 Best Customer Journey Analytics Tools User Journey Map Guide with Examples & FREE Templates
AUTHOR
Tope Longe
Product Analytics Expert
Ardent technophile exploring the world of mobile app product management at UXCam.


Related articles


Product Management
Say hello to new funnels: Analyzing app conversion rates just got easier
UXCam's updated funnels make analyzing conversions easier than ever with new conversion criteria and funnel...


Jane Leung
Product Analytics Expert


Conversion Analysis
React Native Performance Monitoring Guide 2026
Master React Native performance monitoring. Track JS thread stalls, dropped frames, and bridge lag with AI insights from Tara to ship a faster, smoother...
Tope Longe
Product Analytics Expert


Conversion Analysis
Top 51 Mobile App KPIs: Ultimate List 2026
51 mobile app KPIs — determine the KPIs and metrics that matter the most for your...


Jonas Kurzweg
Product Analytics Expert