In-App Analytics - Guide on Best Techniques and Tools
PUBLISHED
17 September, 2024

Growth Marketing Manager
Imagine launching a mobile app and having no idea how users interact with it. Are they navigating smoothly? Are they abandoning key features? Without in-app analytics, these crucial insights remain a mystery, leaving your team to rely on guesswork.
In-app analytics bridges this gap by showing you exactly how users engage with your app. It’s like having a map that reveals what’s working and what’s not. For product, UX, and marketing teams, this data-driven approach is a game-changer.
Why? Because understanding user behavior gives you a competitive edge. Instead of guessing which features drive engagement, you can see real-time data that highlights user preferences, pain points, and opportunities for improvement. This insight empowers you to make informed decisions that boost overall app performance.
Now that you understand the impact of in-app analytics, let’s dive into the what, why, and how of implementing it.
In the sections that follow, we’ll cover:
A clear definition of in-app analytics and the key metrics you should track.
Step-by-step guidance on how to implement and measure in-app analytics effectively.
A review of the top in-app analytics tools and platforms.
The numerous benefits and practical use cases for in-app analytics.
Let’s explore how you can unlock the full potential of your app with these insights!
What is in-App analytics?
In-app analytics is the process of tracking and analyzing how users interact with your mobile app. It provides real-time insights into user behavior, allowing you to understand how people navigate, engage, and use different features within your app.
Unlike traditional web or device analytics, in-app analytics focuses specifically on what happens inside your app. It goes beyond just tracking downloads or installs. Instead, it gives you detailed data on what users do once they’re inside, helping you understand their journey.
For example, with web analytics, you might track page views or bounce rates. But in-app analytics gives you deeper insights like how long users spend on a particular screen, what actions they take, and where they drop off. This helps you make more informed decisions about improving your app.
Key metrics to track
To get the most out of in-app analytics, there are several key metrics you’ll want to keep an eye on. These metrics give you a comprehensive view of your app’s performance and how users are engaging with it.
Retention rates" Retention rates show how many users return to your app after their first visit. High retention means your app is delivering value and users find it worth coming back to. Low retention might signal usability issues or a lack of engaging features.
Active users (daily/monthly): Tracking the number of daily or monthly active users (DAU/MAU) helps you see how often users are coming back and engaging with your app. This is a great indicator of overall app health and user satisfaction.
Session duration: Session duration tells you how long users spend in your app during a single visit. Longer sessions typically mean users are finding value in your app, while shorter sessions could indicate frustration or confusion.
User engagement and interaction: Understanding how users interact with specific features is key. Are they exploring your app thoroughly, or are they only using a few basic functions? This metric helps identify which parts of your app are most (or least) valuable.
Conversion events (sign-ups, purchases, etc.): Conversion events track when users complete a desired action, such as signing up for an account or making a purchase. This metric helps you measure the effectiveness of your funnels and optimize for better conversion rates.
Crash reports and performance monitoring: No one likes an app that crashes. By tracking crash reports and performance issues, you can quickly identify and fix technical problems before they drive users away.
In-app analytics gives you a holistic view of how your users are interacting with your app. By keeping a close eye on these key metrics, you can optimize your app to better meet user needs, improve engagement, and ultimately, drive growth.
How does in-app analytics empower different teams?
Whether you’re focused on product development, UX optimization, marketing strategies, or performance monitoring, in-app analytics can provide valuable insights that lead to tangible results.
Product development
In-app analytics allows your product team to make data-driven decisions rather than relying on assumptions. By understanding which features drive user engagement, you can prioritize those in your product roadmap. This ensures you’re building what your users truly need.
When you know what features users love, you can invest more in their development. On the other hand, underperforming features can be improved or eliminated. This strategic approach ensures you’re constantly enhancing your app to meet evolving user expectations.
UX optimization
For UX teams, in-app analytics is invaluable for improving user experience. By analyzing behavior patterns, such as session replays or heatmaps, you can see exactly how users are navigating your app. This helps you spot areas where users may get stuck or confused.
By identifying drop-off points in the user journey, you can take steps to reduce churn. Maybe a button isn’t clear, or a flow is too complicated. In-app analytics helps you pinpoint these issues and optimize for a smoother, more enjoyable experience.
Marketing strategies
Marketing teams can use in-app analytics to personalize campaigns based on actual user behavior. By segmenting your audience and understanding their preferences, you can craft messaging that resonates and drives engagement.
In-app analytics also helps you optimize conversion funnels. By seeing how users move through the app, from discovery to conversion, you can refine your campaigns and reduce friction. This leads to higher conversion rates and more effective marketing efforts.
Performance monitoring
No one likes an app that crashes or freezes. In-app analytics allows you to monitor performance issues like crashes and technical glitches in real time. By quickly identifying these problems, you can address them before they negatively impact user experience.
Performance monitoring ensures that your app runs smoothly, which is key to keeping users happy and engaged. The sooner you resolve technical issues, the less likely users are to abandon your app due to frustration.
How to implement in-app analytics
Implementing in-app analytics may seem like a big task, but with the right steps, you’ll be up and running in no time. Let’s break it down into a simple, step-by-step process so you can track, analyze, and improve your app’s performance with ease.
Step-by-step guide for setting up in-app analytics
Choose the right analytics platform
The first step is choosing the right platform for your app. Not all analytics tools are created equal, so look for one that fits your app’s unique needs. Consider factors like ease of integration, reporting capabilities, and whether it offers features specific to your product, UX, or marketing goals.
Pro-tip: With UXCam’s Autocapture feature, you can automatically track all user interactions, without the need for extra manual tagging. This saves you time and ensures nothing important slips through the cracks.
Integrate SDKs
Once you’ve selected your platform, it’s time to integrate the SDK. This step is critical because it allows your app to start collecting the necessary data. A lightweight SDK ensures that the integration doesn’t affect app performance, keeping everything running smoothly for your users.
Pro-tip: UXCam’s lightweight SDK makes integration seamless and won’t slow down your app’s performance, giving you powerful insights without compromising user experience.
Define key goals and metrics
Next, clearly define the goals and metrics you want to track. This will vary depending on your team’s focus. Product teams may want to track feature engagement, while UX teams could focus on user flows, and marketing teams might prioritize conversion rates.
By aligning metrics with your team’s objectives, you ensure that the data you collect is both actionable and relevant.
Create user segments
User behavior can vary drastically, so it’s crucial to create user segments to understand different behaviors. Segment your audience into groups like first-time users, returning users, users at risk of churning, or high-value users. This helps you tailor the app experience to each group’s needs.
Test and validate tracking
Once your goals and segments are set, it’s time to test and validate your tracking. Make sure the data you’re collecting is accurate and reflects real user behavior. You don’t want to base decisions on faulty data, so double-check everything before moving forward.
Tracking user journeys and conversion funnels
How to create effective user journeys
Mapping out user journeys is essential for understanding how users move through your app. With in-app analytics, you can see where users start, the actions they take, and where they drop off. This helps you identify any pain points or confusing areas that need improvement.
Pro-tip: UXCam’s user journeys feature visualizes the entire user path, from entry to exit, allowing you to see where users may encounter friction or abandon tasks, so you can quickly optimize those touchpoints.
Setting up and tracking conversion funnels
Conversion funnels help you track specific user actions, like signing up or making a purchase. By setting up funnels, you can monitor how well users are progressing through these key actions and where they may get stuck, providing insight into how to optimize your app’s flow.
Pro-tip: Use UXCam’s conversion analytics to easily track and visualize each step in your funnel. This makes it simple to see how many users complete critical actions, like onboarding or purchases, and where drop-offs happen.
Analyzing data for actionable insights
How to use heatmaps, session replays, and screen flows
Once your analytics are live, the real value comes from analyzing the data. Heatmaps show where users are tapping, scrolling, and interacting the most, giving you insights into user behavior patterns. Session replays allow you to see exactly what a user experienced during their time in the app.
By combining heatmaps and session replays, you can get a full picture of how users are navigating your app, helping you identify opportunities to improve.
Identifying friction points and areas for improvement
Sometimes, friction points aren’t immediately obvious. However, tools like heatmaps and session replays make it easier to spot problems like users frequently tapping on non-interactive elements or struggling with a particular flow. These insights help you fine-tune the user experience.
Pro-tip: UXCam’s issue analytics automatically flags crashes, bugs, and frustration signals like rage taps, allowing you to address pain points quickly and improve the overall user experience.
Best techniques for measuring in-app analytics
Measuring in-app analytics isn’t just about tracking data—it’s about focusing on the right data that aligns with your goals. Whether you’re looking to boost engagement, improve conversion rates, or understand user retention, these techniques will help you measure what matters.
Defining your KPIs
The first step is defining your key performance indicators (KPIs). Your KPIs should align with your team’s goals. For UX teams, this might mean focusing on user engagement or flow completion rates. Marketing teams might prioritize conversion rates or the cost per acquisition.
Choosing the right KPIs ensures that your team is not overwhelmed by data. Instead, you’re focusing on actionable insights that drive real improvement. This makes your in-app analytics efforts more targeted and effective.
Pro-tip: With UXCam’s dashboards, you can easily track custom KPIs that matter most to your team, ensuring you always have quick access to the metrics that drive your decisions.

A/B testing for optimization
A/B testing is one of the most effective ways to see what works and what doesn’t. By running experiments with different variations of a feature or design, you can see which version leads to better engagement, conversions, or retention. This helps you make data-backed decisions when optimizing your app.
For example, you can test two different button designs to see which leads to more clicks or sign-ups. The key is to isolate one variable at a time so you can confidently measure the impact of that change.
Cohort analysis
Cohort analysis helps you track how specific user groups behave over time. This is useful for understanding if users who signed up during a certain period behave differently from those who joined later. It helps you spot trends, see when engagement starts to drop, and take action accordingly.
For instance, you might find that users who sign up after a feature update are more engaged. This can guide your decisions on which features to focus on in future updates.
Behavioral analytics
Behavioral analytics goes beyond just tracking simple metrics like page views or clicks. It involves understanding specific user actions, like swipes, taps, or scroll depth, and what these behaviors indicate about user intent. By tracking these, you can gain deeper insights into how users interact with your app.
This kind of data helps you identify what users are really trying to do and where they might be getting frustrated. It’s an opportunity to uncover subtle patterns that can improve the overall experience.
Pro-tip: UXCam’s Smart Events automatically tracks user interactions like taps, swipes, and scrolls, giving you a detailed view of how users engage with your app without requiring manual setup.
Retention analysis
Retention analysis is crucial for understanding why users leave your app and how to keep them coming back. It helps you identify when and why users stop using your app, so you can take steps to reduce churn.
For example, if you notice a sharp drop-off after the first week, you might focus on improving onboarding or adding more value early on. By understanding retention trends, you can adjust your app strategy to keep users engaged longer.
Pro-tip: Use UXCam’s retention analytics to monitor how different cohorts of users are sticking around over time, so you can pinpoint when engagement starts to dip and take action to boost retention.
Top in-app analytics tools and platforms
When it comes to choosing the right in-app analytics platform, there are plenty of options. Each tool has its own strengths, but the key is finding the one that fits your specific needs—whether it’s tracking user behavior, improving retention, or optimizing conversion funnels.
Here are some of the top in-app analytics platforms to consider:
UXCam
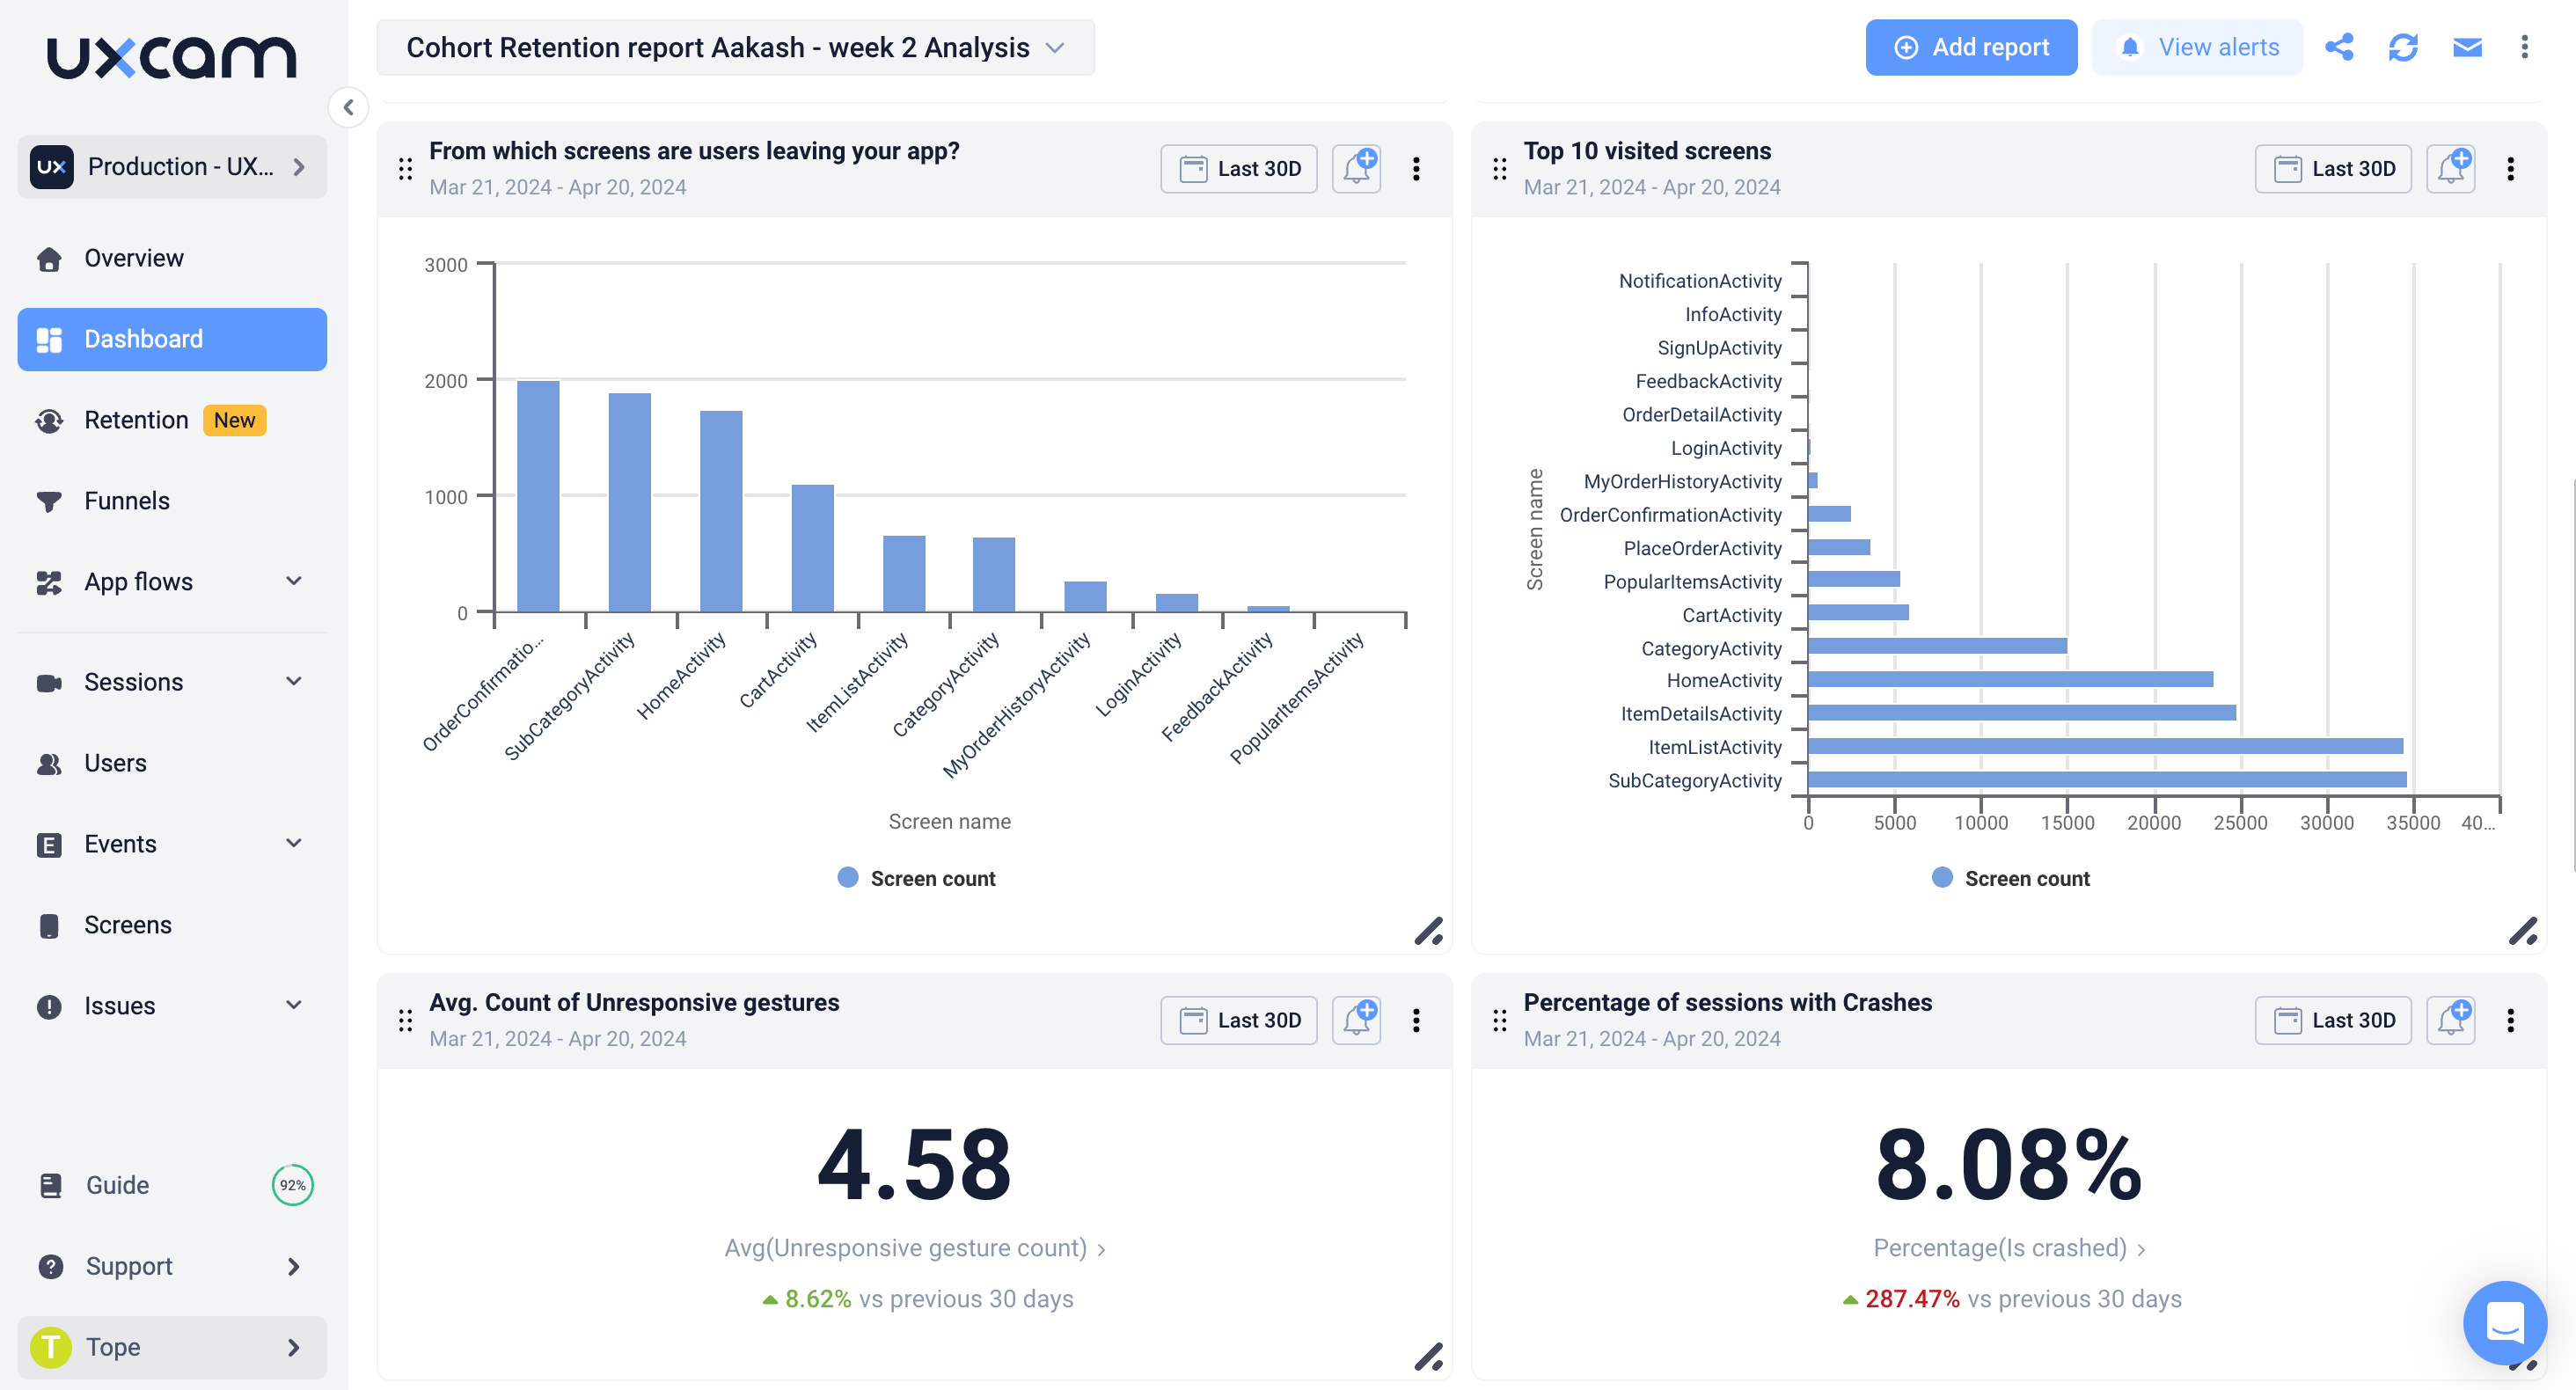
If you’re looking for powerful product analytics without the complexity, UXCam is a great option. It helps you make faster, data-driven decisions by automating data capture and reporting. The guided onboarding, autocapture, and instant reports mean you can get up and running quickly, with minimal manual effort.
UXCam goes beyond just basic metrics. With features like session replay and heatmaps, you can visualize exactly how users interact with your app. You’ll not only see what users are doing but also understand why they’re doing it. Plus, AI-powered user journey suggestions help you boost activation and conversions by identifying areas for optimization in your funnel.
Google Firebase Analytics

Firebase Analytics is a strong option for those focused on engagement, retention, and app performance. It’s especially useful for developers, as it integrates seamlessly with other Firebase tools. Firebase offers real-time insights into user behavior, performance issues, and crash reporting, helping you maintain a smooth user experience.
While Firebase Analytics might not offer advanced behavioral tracking out of the box, it’s highly customizable and works well for apps that need a blend of analytics and app infrastructure.
Mixpanel

Mixpanel is all about understanding user behavior through detailed event tracking. With its focus on behavioral analytics, you can track every action a user takes within your app, such as button clicks, form submissions, or purchases. It’s ideal for teams who want to get granular with their data.
Mixpanel also offers powerful cohort analysis, allowing you to track how different user segments behave over time. This makes it easier to spot trends and identify which features drive long-term engagement.
Amplitude

Amplitude is designed for deep insights into product analytics and user journeys. It’s a great tool for product teams that want to understand how users move through different stages of the app, from onboarding to conversion.
With Amplitude, you can visualize user flows, see where users drop off, and identify opportunities for improving your app’s design. It also integrates well with other tools, making it easier to build a comprehensive analytics ecosystem.
CleverTap
CleverTap is focused on lifecycle marketing and user engagement. It allows you to segment users based on behavior and target them with personalized messaging. This is particularly useful for apps that rely on engagement and retention to drive growth.
CleverTap also offers tools for optimizing conversion funnels and improving user retention, making it a strong option for marketing teams that want to combine analytics with campaign automation.
How to choose the right tool
Choosing the right in-app analytics tool depends on your team’s specific needs and goals. Here are some key factors to consider:
Ease of integration: How quickly can you get the platform up and running? Look for tools with simple SDK integration that won’t slow down your app.
Pricing: Different platforms offer varying pricing models, so be sure to choose one that fits your budget, whether you’re a startup or an enterprise.
Customization: Does the platform allow you to track the metrics and events that matter most to your app? Some tools offer more flexibility in customizing reports and dashboards.
Support for app platforms: Make sure the tool supports your app’s platform, whether it’s iOS, Android, or both. Some tools may have stronger capabilities for one platform over the other.
Scalability: As your app grows, you’ll need a platform that can scale with you. Ensure the tool can handle increasing data volumes and user demands.
Why choose UXCam?
If you’re looking for an in-app analytics platform that checks all these boxes—and more—UXCam stands out as a compelling choice. With its lightweight SDK, UXCam is easy to integrate and won’t impact your app’s performance. This means you can start collecting insights without the technical headaches.
UXCam’s autocapture feature ensures you don’t miss any critical user actions. There’s no need for manual tagging, which saves time and reduces errors. You’ll get instant access to important metrics and user behavior without the extra setup.
What really sets UXCam apart is the depth of insights it provides. Beyond basic metrics, UXCam offers session replays and heatmaps, allowing you to see exactly how users interact with your app. This visual understanding helps your team pinpoint friction points and optimize user experiences more effectively.
Plus, as your app grows, UXCam scales effortlessly, supporting both iOS and Android platforms. Its AI-driven user journey suggestions help you stay ahead of user needs and continuously improve conversions. With flexible pricing options, UXCam is suited for businesses of all sizes, making it a versatile solution that evolves with your app.
If you want a tool that delivers both power and simplicity, UXCam is the clear choice.
Use cases of in-app analytics
Here are three examples of companies using in-app analytics to drive success.
JobNimbus: From low ratings to high retention
JobNimbus, a project management app for contractors, faced poor user retention and a 2.5-star rating. By leveraging UXCam’s analytics, they tracked how non-tech-savvy users interacted with their app and identified areas that needed improvement.
Through data insights on feature adoption and device usage, the team rebuilt their app with a focus on user-friendly design. This resulted in a rating boost from 2.5 to 4.8 stars and transformed the app from a top churn reason to a top retention driver.
Costa Coffee: Fixing registration drop-offs
Costa Coffee aimed to increase sign-ups for its loyalty program but faced a 30% drop-off during the app registration process. Using UXCam’s session recordings and funnel analytics, they discovered that 15% of the drop-offs were caused by invalid password entries.
By addressing this issue, Costa Coffee redesigned the registration flow, resulting in a 15% increase in successful registrations. This not only improved app engagement but also enhanced customer spending through their loyalty program.
Western Governors University: Boosting app engagement
Western Governors University (WGU) had a major challenge: only 19% of their student population used the app regularly. UXCam analytics revealed that 61% of users were dropping off during the login process due to an error in the app’s logic.
By adjusting the login flow to include pre-term students, WGU saw monthly active users increase by 112%, with login conversions jumping from 61% to 95.6%. This data-driven change made the app more accessible and significantly boosted student engagement.
Conclusion: take action with in-app analytics
In-app analytics is the backbone of improving your mobile app’s performance. By continuously tracking and refining user insights, you’re not just guessing what works—you’re making informed decisions that enhance your product, user experience, and marketing strategies. Choosing the right tools and techniques is essential to driving user engagement and app success. In-app analytics ensures that you’re constantly learning from your users and adapting to meet their needs, keeping your app competitive and valuable. If you’re ready to take your app’s analytics to the next level, consider UXCam. With features like autocapture, session replay, and user journey analysis, UXCam gives you everything you need to understand your users deeply and optimize their experience. Ready to get started? Sign up for a free trial of UXCam today and start uncovering insights that drive growth.
You might also be interested in these;
App Analytics Guide: definition, tools and best practices
Product Usage Analytics - Examples and How to Set It Up
Top 18 Mobile App Analytics Tools
The most important mobile app analytics metrics to measure
How To Write a Tracking Plan for Mobile App Analytics
AUTHOR

Tope Longe
Growth Marketing Manager
Ardent technophile exploring the world of mobile app product management at UXCam.
What’s UXCam?
Related articles
App Analytics
The Hotjar for mobile apps: UXCam
Read on to learn about the best Hotjar alternative for native mobile apps (Android and iOS) and hybrid apps. Here's how to get heatmaps and session recordings for your mobile...

Audrey Meissner
App Analytics
Top 19 Mobile App Analytics Tools in 2025
Choosing the best mobile app analytics tools and platforms for your app can be overwhelming. We did the research, so you don't have...

Jonas Kurzweg
Growth Lead
App Analytics
Amplitude React Native Integration Review & Best Alternative
Explore how to set up Amplitude React Native, read expert reviews, and discover the best alternatives for optimizing your mobile...

Tope Longe
Growth Marketing Manager

