User Engagement Metrics - The Complete Guide

Understanding user behavior is essential for creating engaging experiences. As Peter Drucker said, "What gets measured gets managed". This underscores the importance of tracking user engagement metrics effectively. So let's take a look at how we can track these metrics!
Quick Summary - Top user engagement metrics
Why trust us: UXCam is a leading product analytics platform that helps 37,000+ product teams track and increase user engagement.
Why it matters: User engagement metrics are crucial for understanding user behavior and improving product experiences, ensuring your product remains competitive and relevant in the market.
| Metric | Description |
|---|---|
| Session Duration | The average time users spend in a session. Indicates user interest and engagement. |
| User Retention Rate | The percentage of users who return to use the app after their first visit. |
| NPS Score | Direct insights gathered from users about their experience. Indicates level of engagement. |
| Conversion Funnel Drop-Off Rate | Tracks the steps users take before converting to highlight drop-offs. |
| Active Users | Measures the number of unique users engaging with the app over time. |
| Onboarding Completion Rate | Assesses the onboarding process to improve initial interaction. Indicates engagement during onboarding. |
| Feature Adoption Rate | Tracks which new features are being used by users and how frequently. |
| User Churn Rate | The rate at which users stop using the app, reflecting user loss. |
| Session Frequency | Analyzes how often users return to use the app within a specific timeframe. |
| Time on Page | Examines how long a user spends on a particular page to evaluate content effectiveness. |
| Rage Tap/Click Rate | Rapid consecutive taps by a user, indicating frustration with the app. |
Session Duration


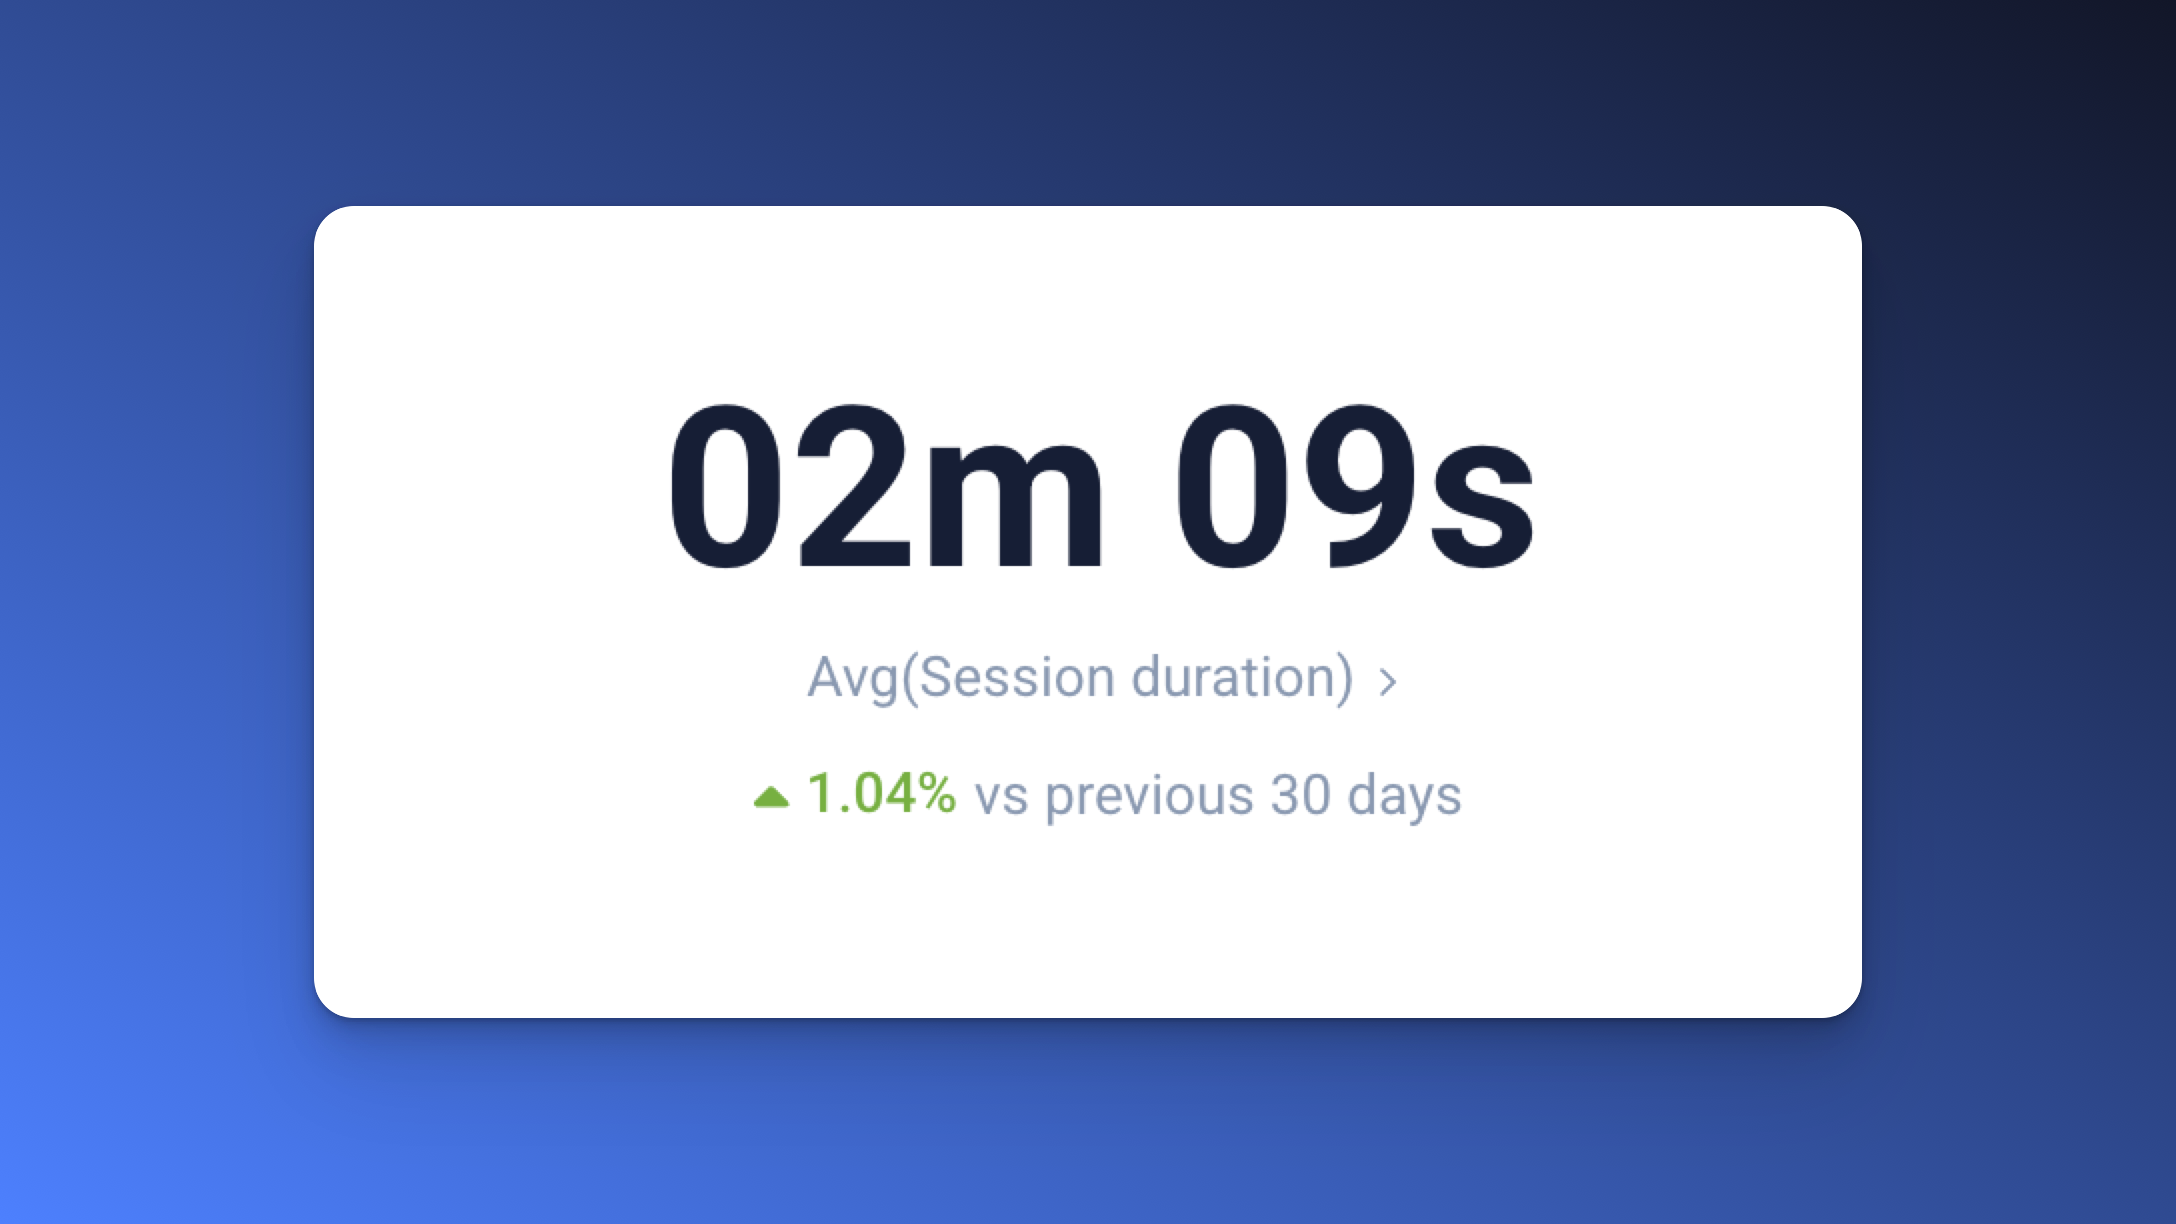
Understanding session duration gives insight into how long users interact with your app each time they open it. It's a fundamental metric to ascertain the level of engagement your app fosters. By evaluating session duration, you can determine if users find value in their interaction with your application or if they leave too soon, potentially missing key features or value propositions.
When tracking session duration, you're equipped to enhance your app's engagement strategy. First, identify a baseline—how long are users typically staying engaged? Using UXCam’s dashboard, you can monitor this metric effortlessly.
Segment your user base to spot trends: perhaps new users spend less time compared to long-term users. Analyze whether this aligns with your content and functionality goals.
Next, explore factors influencing duration, such as page load time or navigational complexity, and iterate based on data-driven insights. Conduct A/B tests on design elements that could encourage longer sessions. Remember, longer doesn't always mean better—it's about meaningful interaction. Thus, balance the pursuit of increased duration with the goal of enhancing user satisfaction and achieving your app’s core objectives.
How to track session duration:
First, open your UXCam Dashboard and click on "Add Report".


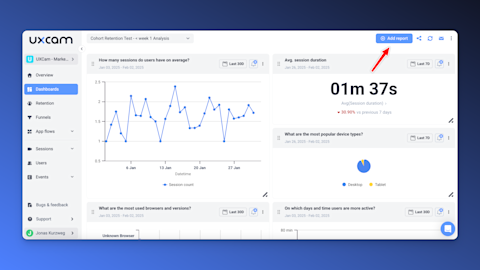
Then select "Sessions" and "Session Duration".


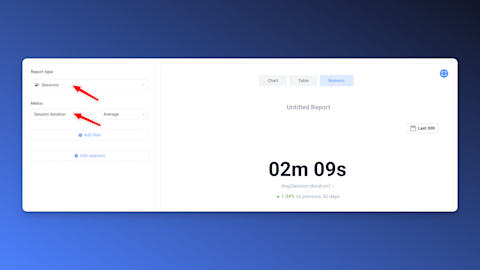
Done! Now you can add your report to your dashboard.
Active Users


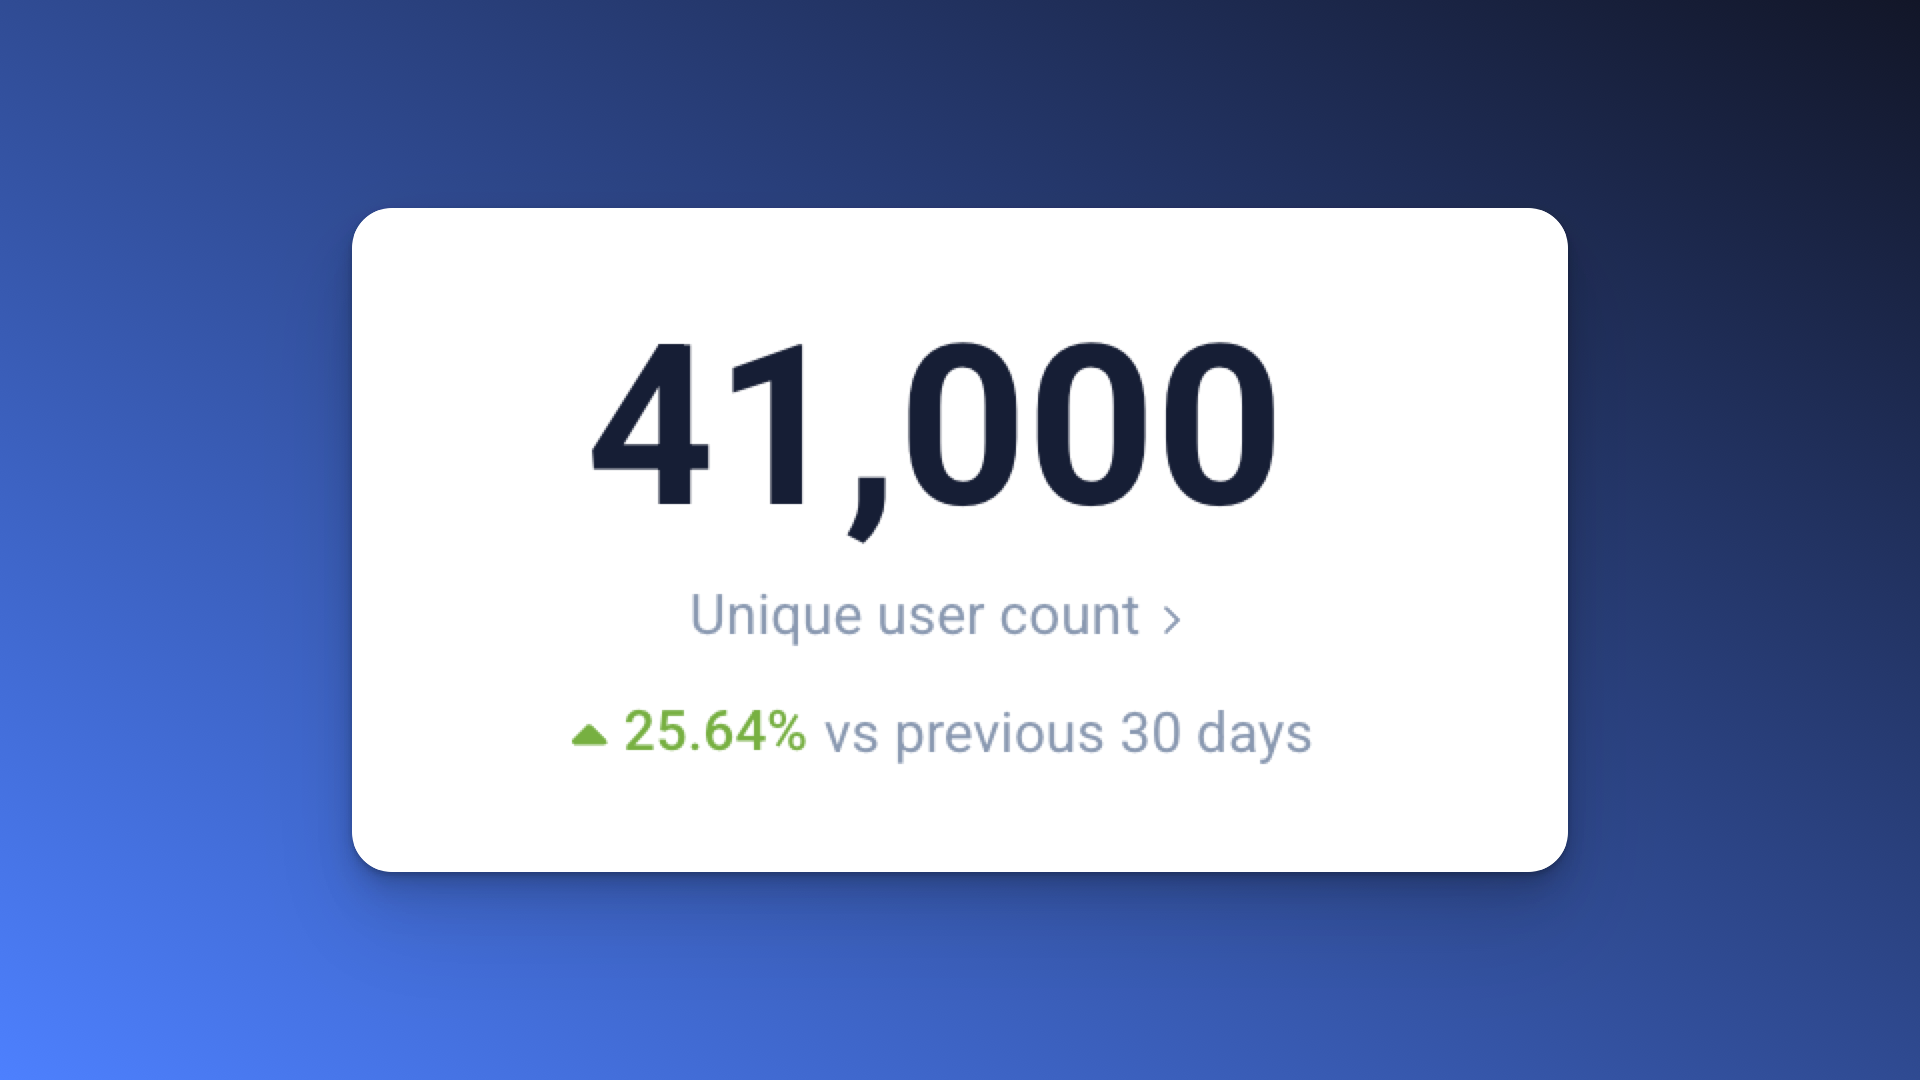
One crucial aspect of assessing user engagement is understanding the number of Active Users in your application. Unlike total downloads or users registered, active users reflect those who are currently engaging with your app within a specific timeframe. This metric is instrumental in evaluating how "sticky" or engaging your app is.
Typically categorized as Daily Active Users (DAU), Weekly Active Users (WAU), or Monthly Active Users (MAU), these metrics offer insight into user engagement over different periods. A higher count of DAU, WAU, or MAU generally indicates a higher level of interest and frequent interaction from your user base.
Tracking active users is critical for understanding how engaging your app truly is. By focusing on these metrics, you can answer key questions about user behavior and app performance over different periods. Are users consistently finding value in your app spread out through the day, week, or month? If so, you'll see an increase in DAU, WAU, and MAU figures.
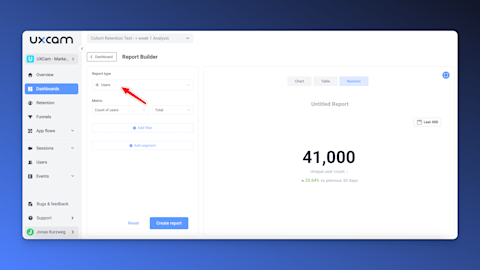
How to track Active Users
To track these metrics you can use UXCam.
Just go into your dashboard, click on "add report" and select "Users" as a report type. You can use the date range to create reports for DAU, WAU and MAU.


Use filtering options in UXCam to segment users and tailor features or outreach specifically to enhance further engagement with your app.
Periodically assessing these metrics and reacting to trends is crucial for maintaining a loyal user base and enhancing overall app success.
User Retention Rate


User retention rate is a critical metric that helps you understand the percentage of users who return to your app over a specific period. It reflects the effectiveness of your app in keeping users engaged and ensuring they have a reason to return. Unlike the churn rate, which focuses on user loss, retention is about maintaining user interest and loyalty.
To calculate the user retention rate, you can use the following formula: Retention Rate (%) = (Number of Returning Users / Total Number of Users) × 100
For example, if you have 1000 total app downloads and 250 of those users return the following month, your retention rate would be 25%. Consistently tracking this metric enables you to pinpoint retention strategies that work and iterate on those that don't. Ultimately, a small increase in your retention rate can substantially boost your revenue due to prolonged user engagement.
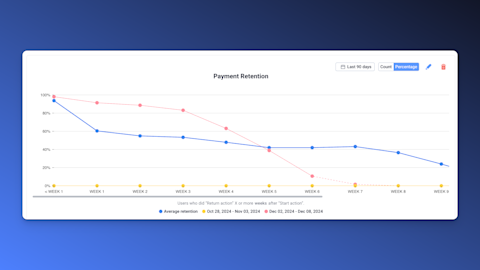
How to track retention rate:
Within UXCam, tracking user retention is streamlined through their robust analytics interface.
First, open the retention tab inside UXCam. Then, press "Create report".


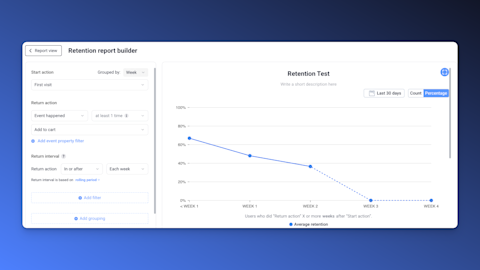
Enter the start action, return action, and the return interval. Done!
NPS Score


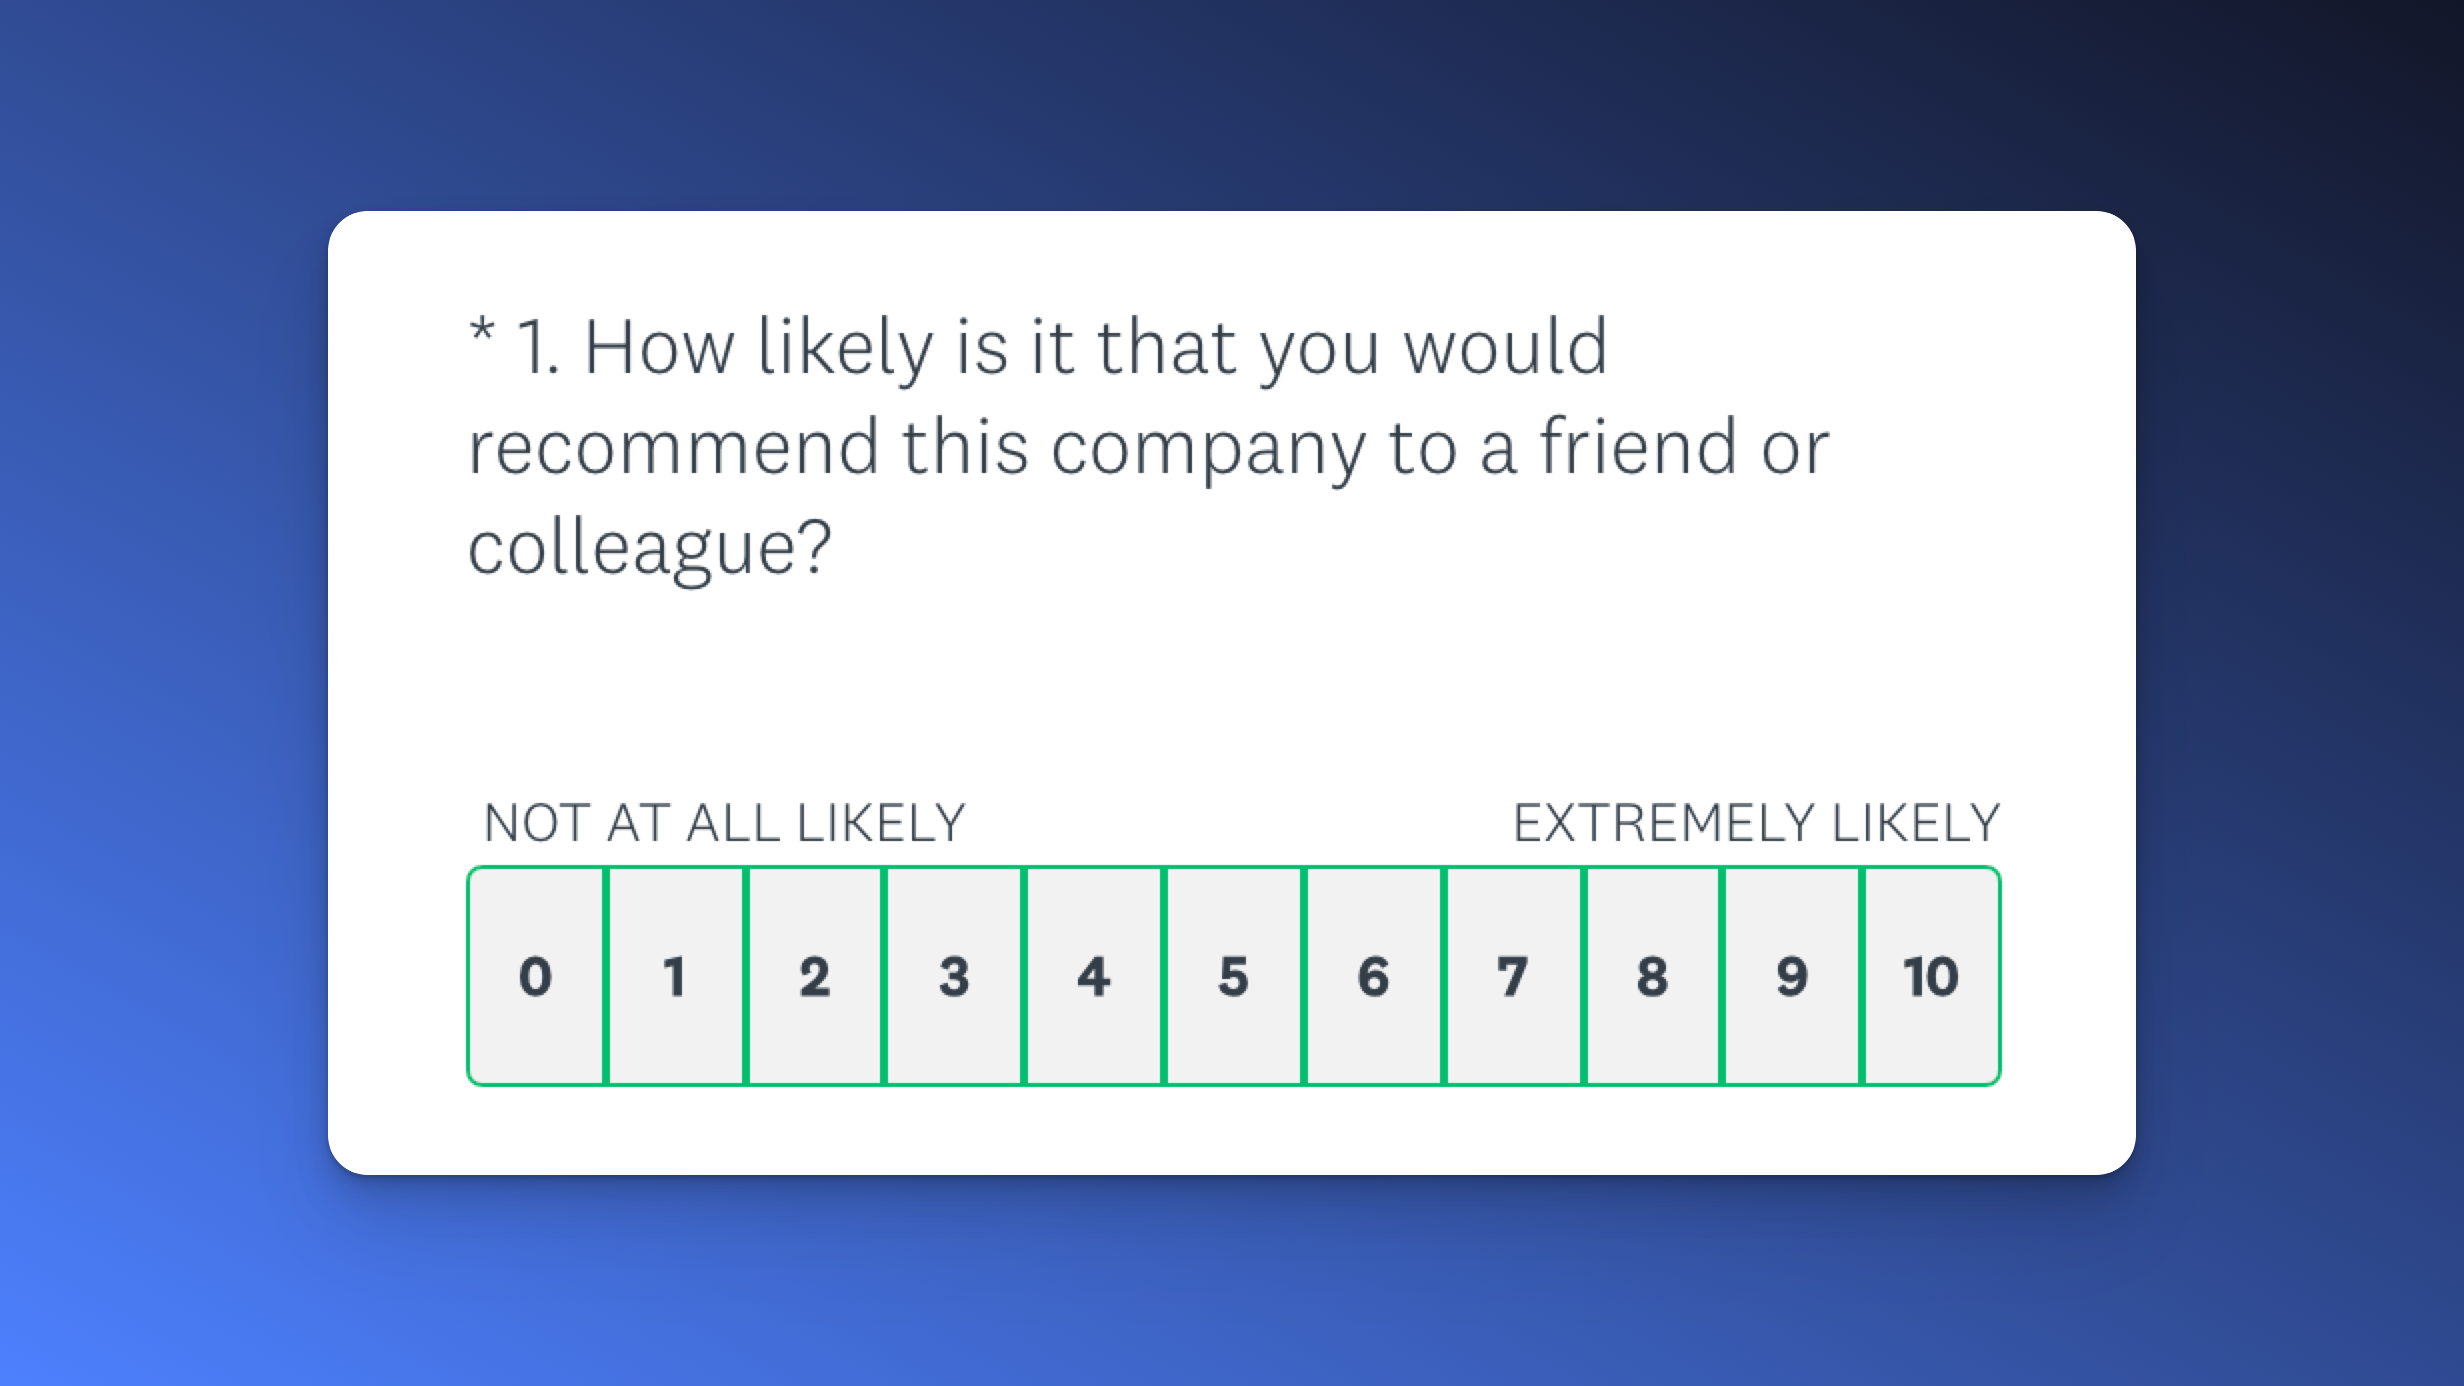
The NPS Score, or Net Promoter Score, is a valuable metric for gauging user satisfaction and loyalty towards your app. It operates on a simple question: "On a scale of 0 to 10, how likely are you to recommend our app to a friend or colleague?" Respondents are classified into three categories: Promoters (scores 9-10), Passives (scores 7-8), and Detractors (scores 0-6).
To calculate the NPS Score, subtract the percentage of Detractors from the percentage of Promoters. The scale ranges from -100 to 100, with higher scores indicating stronger user satisfaction and advocacy.
How to track the NPS score
You might consider other specialized platforms such as SurveyMonkey or a similar tool to handle your NPS tracking.
First, create an NPS survey, which typically involves a simple question like, "How likely are you to recommend our app to a friend?" with a rating scale from 0 to 10. Once set up, schedule the survey to automatically appear at key moments in the user journey, such as after completing a significant action or upon logging out.
Monitor the responses in real-time using your chosen platform's dashboard, and analyze the feedback to segment users into promoters, passives, and detractors. Though UXCam cannot track NPS directly, you can still correlate NPS trends with other user behavior metrics tracked on UXCam for deeper insights into areas for improvement.
By consistently tracking and acting on your NPS data, you can enhance user experience and drive long-term loyalty.
Conversion Funnel Drop-Off Rate


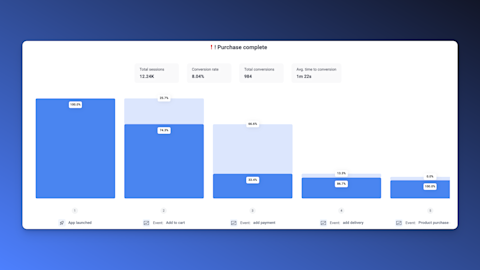
The conversion funnel is key to understanding the journey users take toward completing a desired action within your app, such as making a purchase or signing up. However, not all users will see the process through to the end. That's where the drop-off rate becomes critical. This metric helps you identify the stages where users are abandoning the journey, providing crucial insights to enhance user flow efficiency and reduce friction.
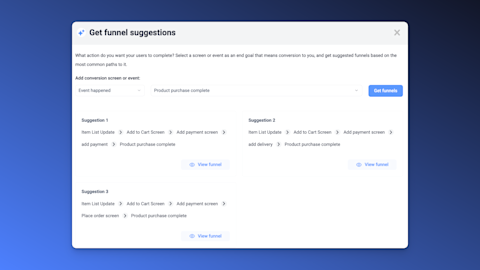
How to track the Conversion Funnel Drop-Off Rate
Begin by setting up a funnel inside UXCam, where you can map out the steps users take to reach a conversion. To do this, you can just use UXCam's "Funnel suggestion feature".


As you analyze these steps, focus on the points with the highest drop-off rates. This will highlight the stages that require improvement, whether it be streamlining the user interface, reducing load times, or enhancing the overall user experience.
By closely monitoring and optimizing your conversion funnel drop-off rates with dashboards, you'll be better equipped to guide users smoothly from entry to conversion, ultimately increasing engagement and boosting your conversion rates.
Feature Adoption Rate


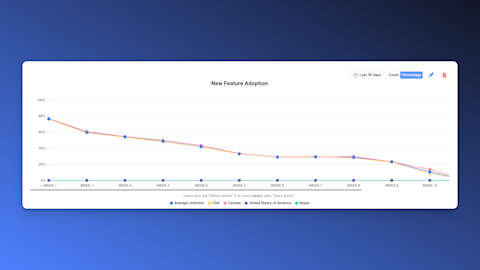
The Feature Adoption Rate is crucial in understanding how well users are integrating new features into their app usage routine. It helps in identifying whether the introduced features are enhancing the user experience or if additional improvements are needed. For instance, if a newly added feature shows a low adoption rate, it might indicate the need for better in-app guidance, user education, or a review of the feature's usability.
How to track feature adoption rate:
With UXCam, you can delve into comprehensive analytics to monitor how frequently a new feature is used. Set up user paths and event tracking to observe the interaction rate with new elements. You can analyze session replays to gather qualitative insights about users' engagement with the feature, identifying any barriers to interaction.
Additionally, creating funnels specific to the feature can help visualize progression from initial interaction to habitual use. Leverage heatmaps to see where users are spending most of their time, indicating interest and potential areas for optimization.
User Churn Rate
Understanding the user churn rate is critical for any app or service to maintain a steady growth trajectory. Essentially, churn rate tracks the percentage of users who stop using your app over a specific period. A high churn rate might indicate issues with your app's user experience or that the competition is pulling your users away.
One of the key strategies in reducing churn is continuously engaging your users through meaningful interactions and offering irresistible value through your service. Identifying why users leave and addressing those reasons can help improve retention and eventually lower the churn rate.
How to track user churn rate:
Tracking churn rate can be as simple as subtracting your active users at the end of a period from those at the beginning, then dividing by your starting user count. UXCam allows you to dig deeper into why users are leaving, by providing you with:
Heatmaps and Session Replays: Identify patterns where users are dropping off most frequently.
Cohort Analysis: Compare different user segments over time to see how retention is evolving and correlate it with user behavior.
Leveraging these tools not only allows for a granular understanding of user behavior but also helps in creating actionable strategies to win back lost customers and reduce churn substantially. Remember, lowering churn meaningfully boosts your application’s growth and sustainability.
Session Frequency
Session frequency, a vital metric in understanding user engagement, represents how often a user returns to your app within a given period. It signals the stickiness of your app — how compelling and essential it is to the user.
A higher session frequency can hint at a successful app strategy, indicating that users find consistent value and reason to return. On the flip side, a low session frequency might suggest a need for app enhancements or more engaging content.
Tracking session frequency helps you uncover trends and patterns in user behavior. Is there a particular day or time when users are more likely to engage? Identifying such insights can lead to strategic improvements and targeted campaigns to further boost user interaction.
How to track session frequency:
Using UXCam, you can effectively monitor session frequency by setting up appropriate filters and dashboards. Here's how you can do it:
Set Date Ranges: Determine the timeframe over which you want to measure session frequency, such as daily, weekly, or monthly.
Segment Users: Categorize your users based on specific criteria like new vs. returning users to better understand different engagement metrics.
Use Custom Dashboards: Tailor your analytics dashboard to highlight session frequency data, offering quick insights into user behavior patterns.
By paying attention to session frequency metrics within UXCam, you'll be well-equipped to make data-driven decisions aimed at increasing user engagement and improving app performance.
Time on Page
Time on Page is a critical metric that provides insight into how engaging your content is. By measuring the amount of time users spend on a particular page, you can determine which areas of your app or website captivate your audience's attention and which might require improvement.
A longer Time on Page usually indicates that users find the content valuable, while a short duration may signify issues such as confusing navigation, a lack of interest, or slow-loading pages.
How to track Time on Page:
With UXCam, monitoring Time on Page is straightforward and insightful. Here's how you can do it:
Dashboard Overview: Start by accessing your UXCam dashboard, where you can find a comprehensive overview of user interactions across pages.
Custom Events: Set up custom events to track the precise time users begin interacting with a particular page and when they exit.
Session Replay: Utilize session replay to visually analyze and understand how users navigate through each page, offering context to the time spent on the page.
By effectively analyzing Time on Page, you can tailor content to better meet user expectations, thus enhancing the overall user experience.
Rage Tap/Click Rate
Rage tap or click rate is a metric that identifies frustration among users when interacting with your app. It indicates how often users repeatedly tap or click on the same area within a short timespan, often due to unresponsive buttons or confusing design interfaces.
How to track Rage Tap/Click Rate:
With UXCam, tracking rage taps or clicks becomes intuitive and efficient. Here's how you can do it:
Session Replays: Observe user interactions through recorded sessions. These replays provide a firsthand view of moments when users exhibit frustration by tapping or clicking in fury.
Automatic Alerts: Set up automatic alerts in UXCam to notify you whenever a user exhibits rage tapping behavior. This can help you quickly address usability hurdles.
Heatmaps: Utilize UXCam's heatmap feature to identify common areas where rage tapping frequently occurs, revealing problematic elements in your design.
Custom Dashboards: Create custom dashboards within UXCam to monitor rage tap rates across different segments such as device type or particular screens.
By actively tracking this metric, you can gain insights into potential user experience issues, allowing you to refine your app for better engagement and satisfaction.
Conclusion
Understanding user engagement metrics is crucial for optimizing your product and providing exceptional user experiences. These metrics, when tracked diligently using tools like UXCam, offer insights into user behavior and preferences, allowing you to make data-driven decisions that improve satisfaction and retention. Whether it's measuring the session duration, analyzing onboarding completion rates, or understanding why users churn, each metric plays an integral role in painting a comprehensive picture of your product's performance.
Incorporating these metrics into your analytics routine can significantly enhance your ability to engage your audience and refine your offerings. Start by selecting a few key metrics that align with your business goals, implement tracking with UXCam, and iteratively optimize based on your findings. With a solid understanding of how users interact with your product, you can create meaningful changes that resonate with your audience and foster long-term loyalty.
Remember, the ultimate aim is not just to collect data but to translate it into actionable insights. By continuously learning and adapting, you'll not only meet your users' needs but also anticipate them, positioning your product for sustained success.


Related articles


Product best practices
5 best user behavioral analytics tools for mobile app teams
Behavioral analytics offers deep insights into user interaction. Learn about the best behavioral analytics tools to optimize the user experience on your mobile...

Jonas Kurzweg
Product Analytics Expert


Product best practices
Top 11 Remote Usability Testing Tools You Can Use Now
Usability testing tools that will put your mind at...
Jonas Kurzweg
Product Analytics Expert


Curated List
7 Best AB Testing Tools for Mobile Apps
Learn with examples how qualitative tools like funnel analysis, heat maps, and session replays complement quantitative...


Jane Leung
Product Analytics Expert