Back to blog
9 MIN READ
Value Metrics - How to Find, Measure and Apply Yours
PUBLISHED
10 June, 2024

Product Analytics Expert
Value metrics are measures used to quantify the value a product or service delivers to its users or customers.
“Value” may be subjective—but it has very real implications for businesses. If customers perceive a product as valuable, they will likely buy it, use it, and recommend it. If not, you’ll likely struggle to make sales.
Value metrics are your best bet for keeping tabs on the perceived value of your product.
In this guide, we’ll explore value metrics from different angles—what they are, how to measure them, and why you should be tracking them. We aim to give you all the tools you need to optimize your product for deeper customer engagement.
Let’s get started!
What are value metrics?
Value metrics measure the value exchange between your product and customers.
Still confused? We don’t blame you.
To put this concept more simply, value metrics are a tool that lets you price your product based on the benefits users get from using it. A great example of this comes from Appcues—a popular product adoption tool:
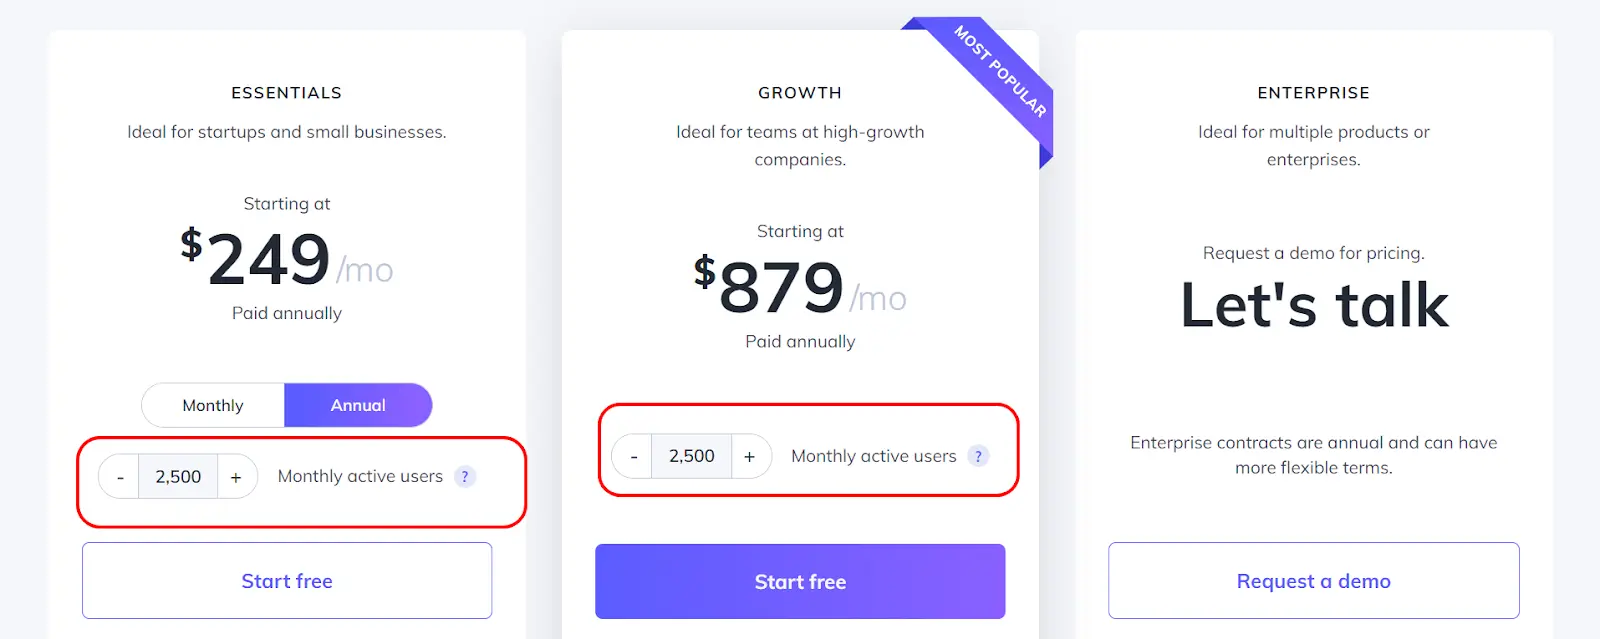
“Monthly active users tracked” is a value metric for Appcues. The more users engage with the product’s onboarding tools, the more value customers get from it. That means they can safely charge more for more active users.
However, without understanding the qualitative aspects of user experience—what features and elements of the product make it valuable—it’s hard to get accurate data. That’s why, when measuring value metrics, you need to zoom out and look at the entire customer journey.
That’s where UXCam comes in.
We offer mobile product teams the data-driven insights they need to create user-centered products and features. By analyzing real user behavior, teams can easily step into their customers' shoes and gain a more profound understanding of their journey.
Types of value metrics
1. Functional value metrics
Functional value metrics measure how much or how often customers use a product or service. If your app sends automated reminders when a task is due, one functional value metric might be “reminders sent per user.”
Other common examples include:
User seats
Average session length
Feature usage rate
2. Outcome-based value metrics
Outcome-based value metrics measure the outcome of an interaction with your product. For example, if customers use your mobile app to save money each month automatically, one possible outcome-based value metric is “amount saved.”
Other outcome-based value metrics include:
Number of conversions
Feature adoption rate
Number of product ratings
Six Impactful value metrics to consider
1. Monthly recurring revenue (MRR)
Monthly Recurring Revenue (MRR) is a financial indicator representing the anticipated monthly income a company receives from its customers in exchange for its products or services. MRR measures the company’s normalized monthly revenue. It’s a crucial cost measure in the operational analysis of a company
2. Customer churn
Customer churn refers to the proportion of customers who have discontinued using your company's product or service within a specified period. To determine the churn rate, divide the number of customers you lost during that time by the number of customers you had at the beginning.
3. Renewal rate
The renewal rate is a metric that indicates the number of customers who actively opt for contract renewal. On the other hand, the retention rate represents customers who have chosen not to cancel their subscription, whether it be an automatic or intentional decision to renew their contract.
4. Revenue churn
Revenue churn refers to the proportion of subscription revenue that a company fails to retain during a specific time frame. It also reflects the company's ability to maintain the value of existing customer contracts. Together with customer churn, which measures the retention of customers, these two metrics offer insights into the overall strength of a company's customer base.
5. Expansion MRR
Expansion Monthly Recurring Revenue (Expansion MRR) refers to the increase in monthly recurring revenue from existing customers between the current month and the previous month. It specifically excludes any new revenue generated from new customers or new sources. A high expansion MRR rate essentially suggests a revenue boost through effective customer retention.
6. Unit cost
Unit cost represents the average expense incurred by a business to produce one unit of a product or provide one unit of service. It includes both fixed and variable costs, like labor, materials, overhead, and production expenses. Monitoring cost per unit helps ensure competitiveness and sustainable financial health.
How to find the right value metrics for your product
Understand your customer
Consider your product’s use case(s)
Align with your long-term business goals
Track product usage patterns of different segments
Gather relevant data from your customers
Experiment with metrics
Analyze competitors
Review and refine
Understand your customer
Understanding your customers is the first step in identifying the right value metrics for your business. There are multiple approaches for collecting this information, including surveys, interviews, and user testing. The goal is to gain insights into what your customers value most about your product or service.
Consider your product’s use case(s)
The use case of your product plays a significant role in determining the value metrics. It’s essential to understand how different customer segments use your product.
For instance, a video platform like Wistia might consider the number of videos uploaded as a value metric, while a communication application like Slack might consider the number of messages sent.
Align with your long-term business goals
Your value metrics should align with your long-term business goals. This means that the metrics you choose should help you track progress towards achieving these goals. For example, if one of your goals is to increase customer satisfaction, you might pick customer satisfaction score (CSA) as one of your value metrics.
Track product usage patterns of different segments
Tracking product usage patterns of different customer segments can provide valuable insights for determining your value metrics.
You should focus on:
Which features they use and which they don’t.
Usage frequency, time, and intensity – how often and how long they use it.
Goals and objectives they achieve and the ones that they don’t.
These are the dimensions along which you could plot your product value.

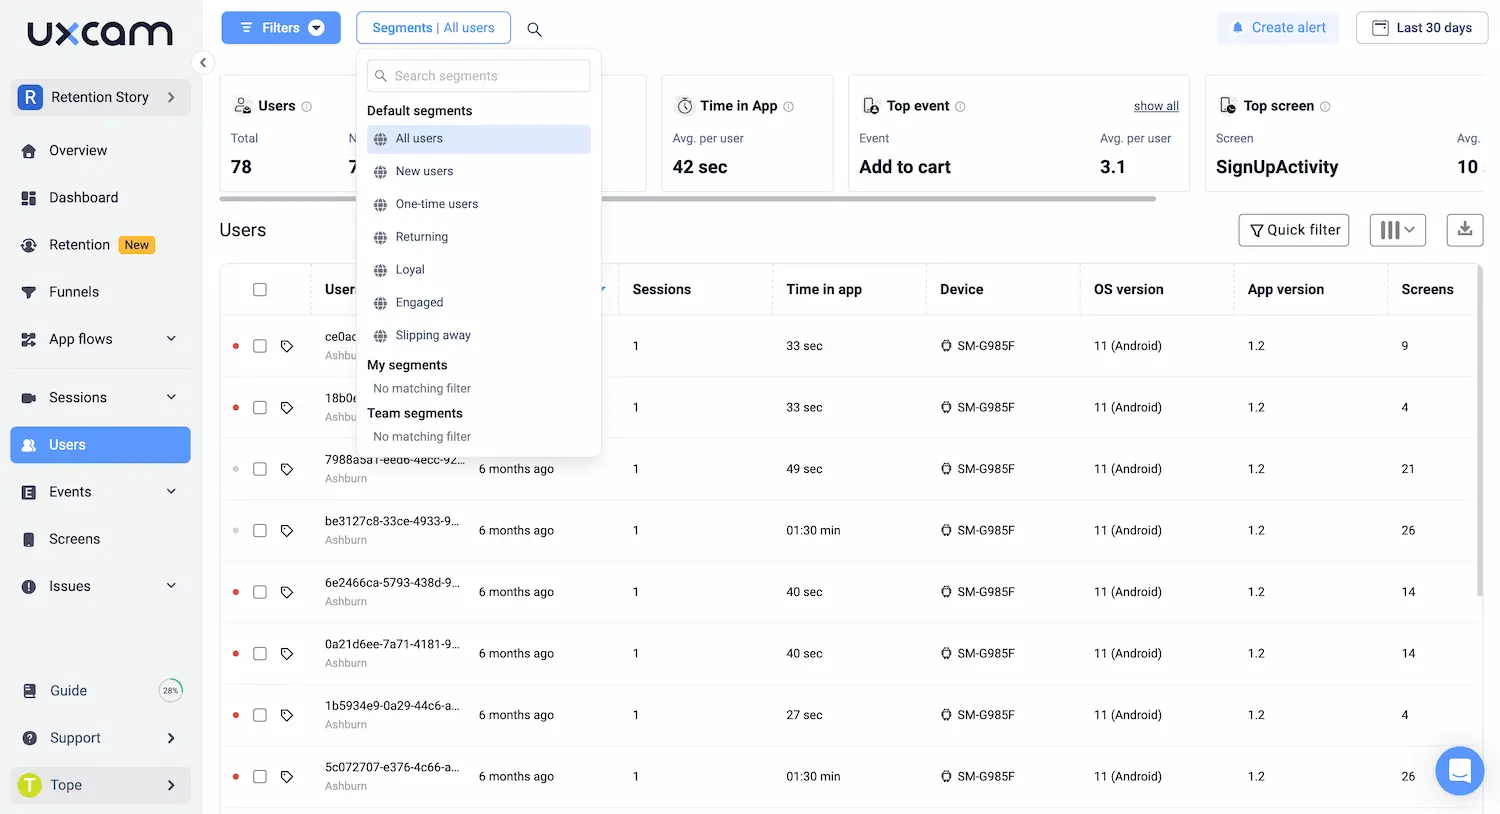
UXCam's segments feature enables cohort analysis and behavior comparison between users. It also provides insights into the user journey, like the screens they visited before and after a certain screen. This helps to understand how different user segments navigate and interact with your app (and derive value from it).

Housing.com used UXCam’s segmentation and session replay features to discover why users weren’t adopting their mobile app. They found that a specific user segment wanted to be able to search for housing in multiple cities at once—this was the value they were looking for.
Adding this feature led to a 20% increase in product adoption.
Gather relevant data from your customers
Gathering relevant data from your customers is crucial for determining your value metrics. This can be done through various methods like surveys, interviews, user testing, and data analytics. The data collected should be relevant to the value metrics you are trying to determine.
Experiment with metrics
Experimenting with different metrics can help you find the ones that best represent your product's value to your customers. This involves testing different metrics, analyzing the results, and refining the metrics based on these analyses.
Analyze competitors
Analyzing your competitors can provide valuable insights into what value metrics might work for you. This involves understanding what products your competitors offer, their sales tactics and results, their pricing, and any perks they offer.
Review and refine
It’s important to regularly review and refine your value metrics based on new insights and changes in your business environment. This involves monitoring your metrics, analyzing the results, and making necessary adjustments to ensure that they continue to represent the value your product provides to your customers accurately.
Tools for Measuring Value Metrics
When it comes to measuring value metrics, leveraging the right tools is essential. One such tool that stands out is UXCam, a comprehensive mobile analytics platform designed to help product teams gain deep insights into user behavior. UXCam offers a suite of features that make tracking and analyzing value metrics straightforward and effective.
Features and Benefits
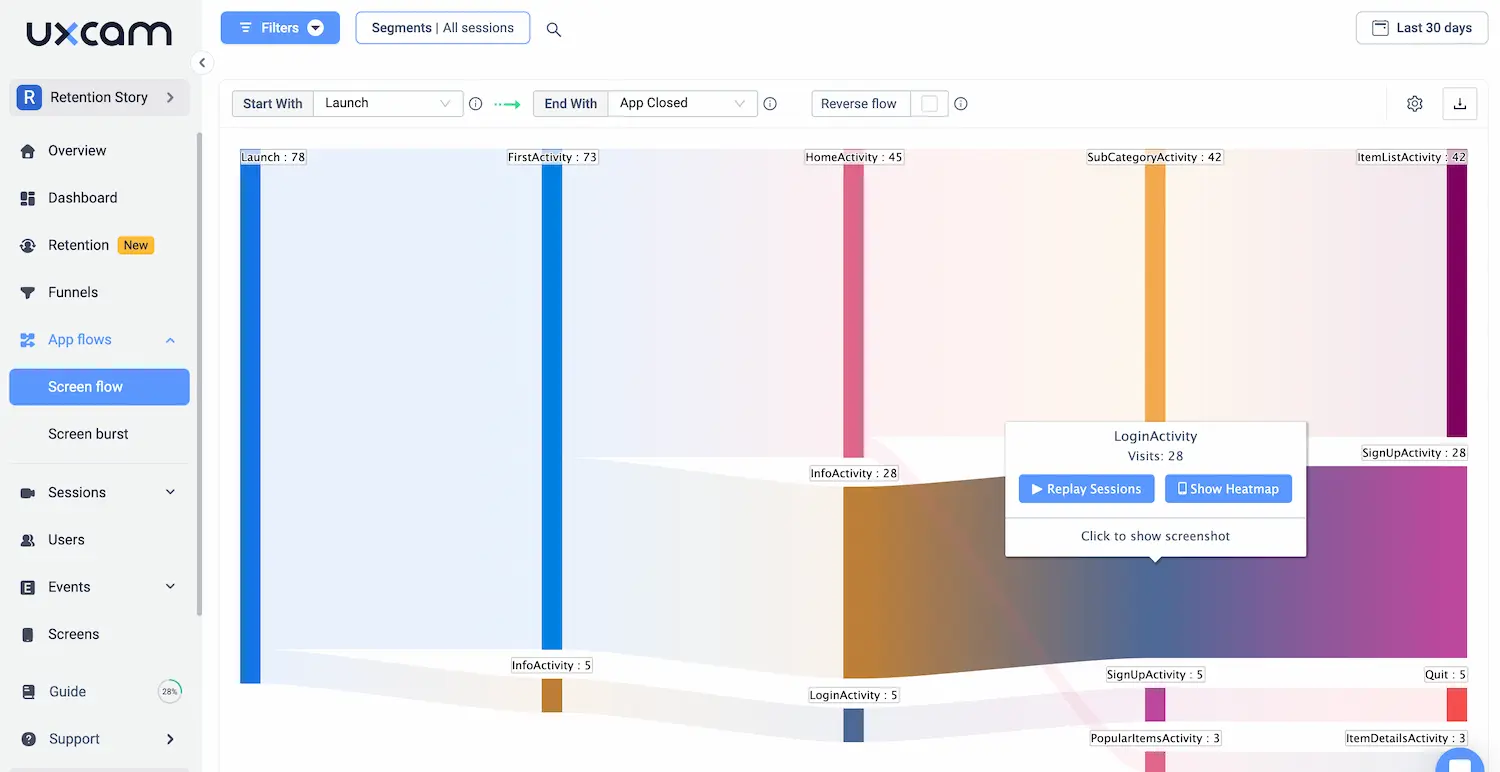
Session Replay - UXCam’s session replay functionality allows you to record and playback user sessions. This feature helps you see exactly how users interact with your app, capturing every tap, swipe, and action. By visually understanding user behavior, you can identify friction points, optimize the user experience, and enhance the overall value delivered to your customers.
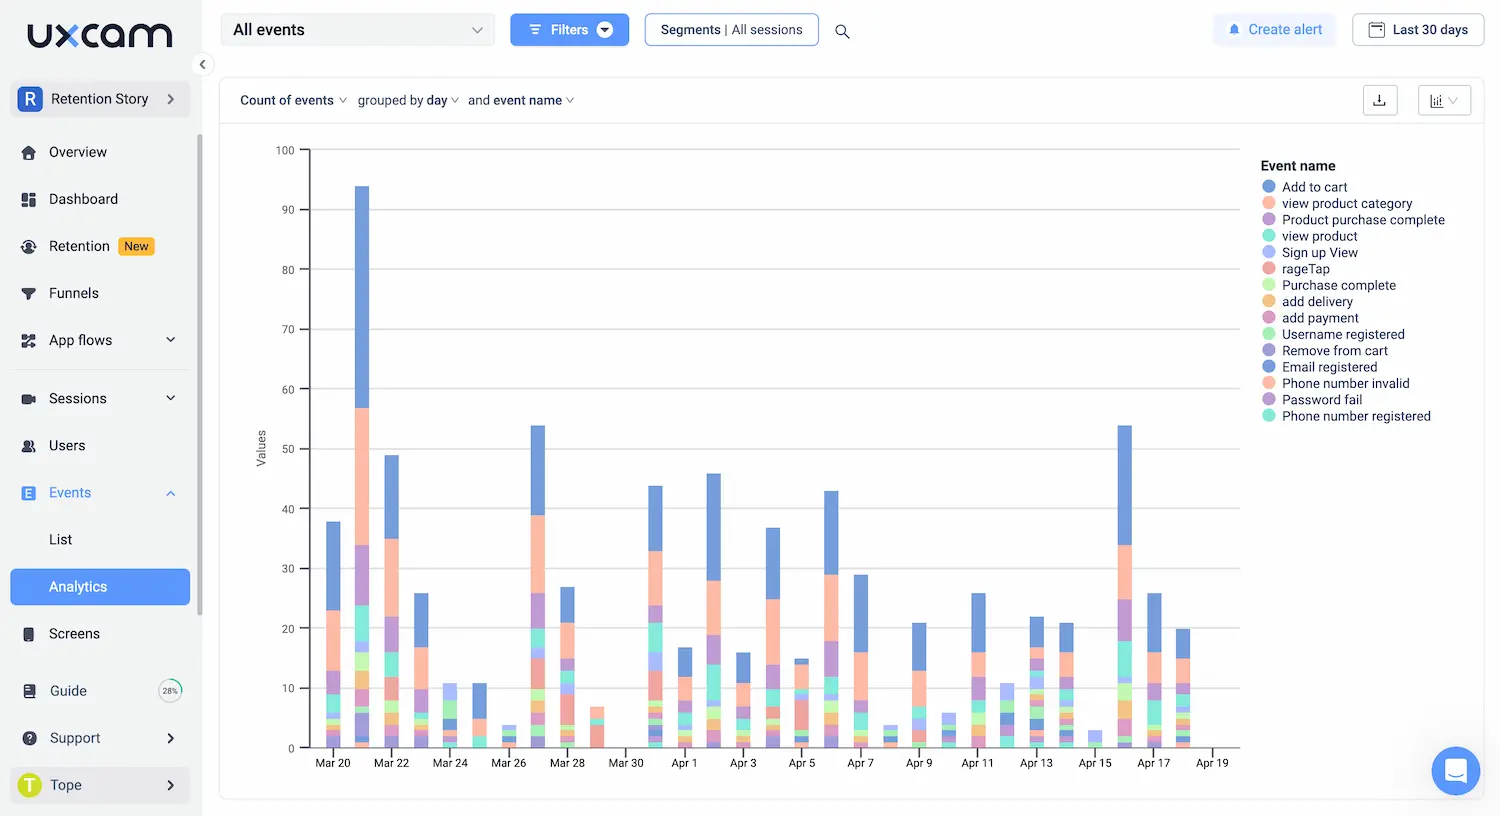
Event Analytics in UXCam provides detailed insights into specific user actions, such as button clicks, form submissions, and navigation patterns. This granularity allows you to track key performance indicators (KPIs) and value metrics with precision, helping you understand which features are most valuable to users and how they engage with them.
Heatmaps visually represent user interactions on your app, highlighting the areas with the most and least activity. Heatmaps are invaluable for understanding user focus areas and optimizing layout and design to enhance user engagement and satisfaction, thereby increasing perceived value.

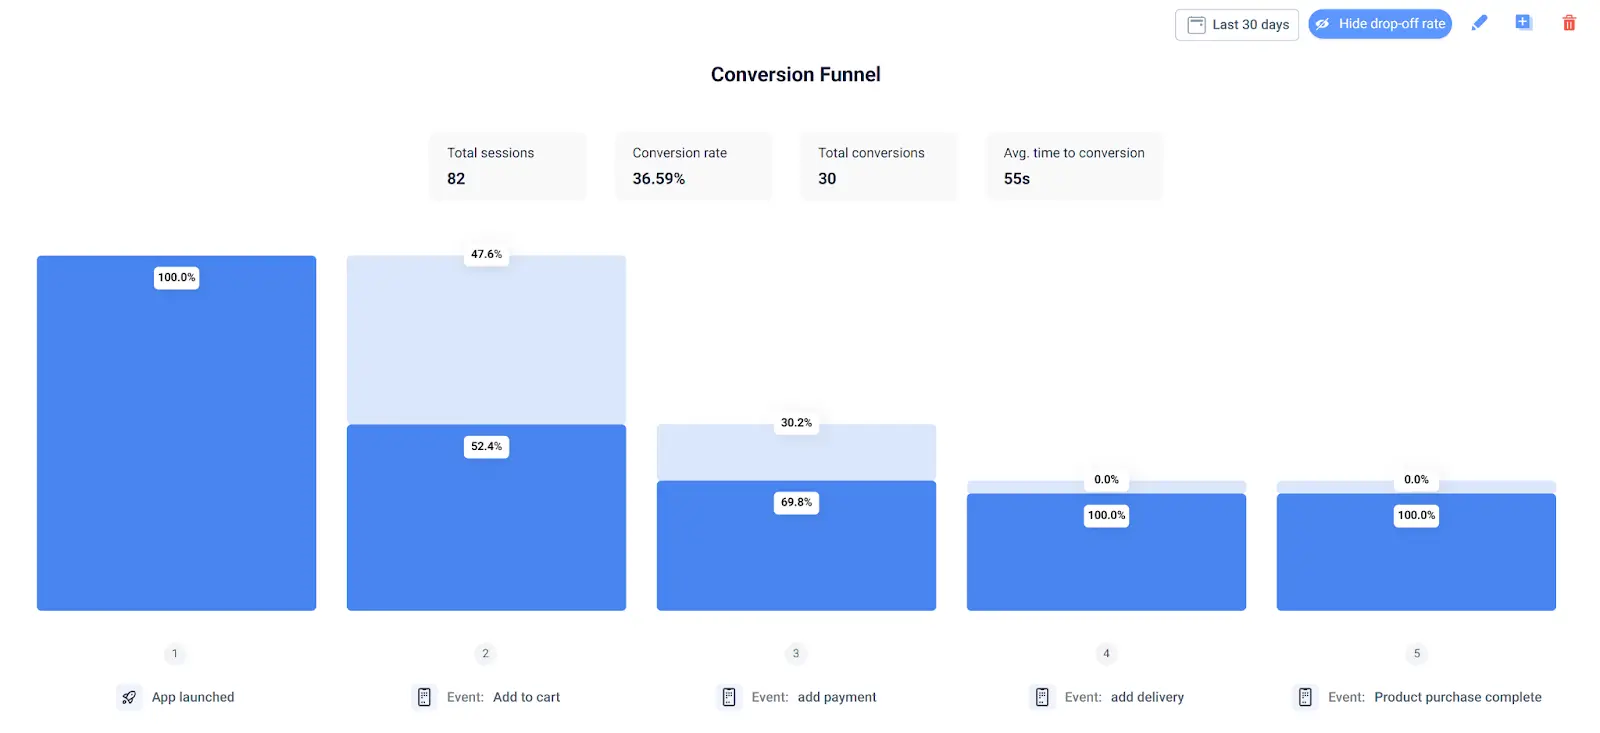
Funnel Analysis allow you tracks the user journey through various stages of your app, from onboarding to conversion. By identifying drop-off points and understanding user progression, you can streamline processes and enhance user experience, ultimately improving retention and conversion rates.
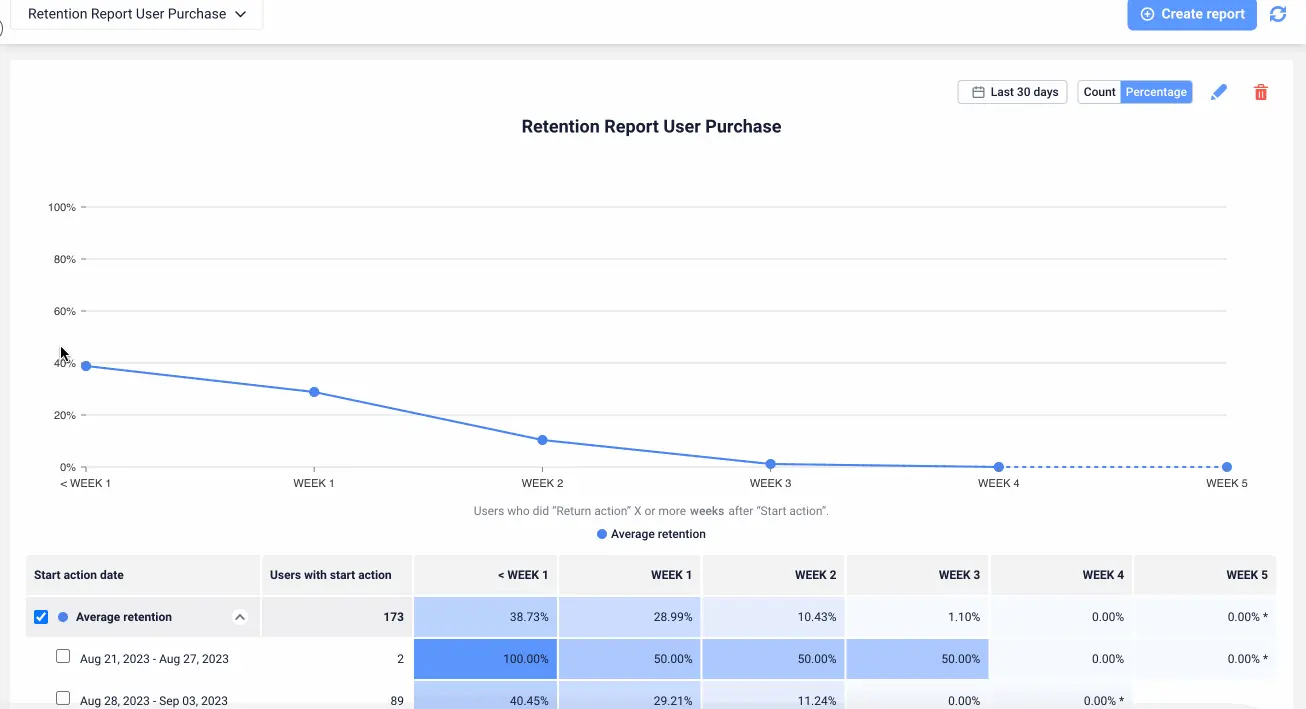
Cohort Analysis - UXCam’s cohort analysis groups users based on shared characteristics or behaviors over a specific period. This analysis helps you track the long-term engagement and satisfaction of different user segments, providing insights into how different cohorts derive value from your app.
User Segmentation allows you to categorize users based on various attributes such as demographics, behavior patterns, and engagement levels. By understanding distinct user segments, you can tailor your strategies to meet the specific needs and preferences of each group, thereby enhancing the overall value provided.
Integration Capabilities - UXCam integrates seamlessly with other analytics and product management tools, such as Firebase, Segment, Slack, and Jira. This interoperability ensures that you can consolidate data from various sources, providing a holistic view of user behavior and value metrics.

Practical Tips for Optimizing Value Metrics
Align Metrics with Business Goals: Ensure that your value metrics are directly linked to your overarching business objectives. This alignment helps in tracking progress and making informed strategic decisions.
Prioritize Customer-Centric Metrics: Focus on metrics that reflect customer satisfaction and engagement, such as Net Promoter Score (NPS) and customer lifetime value (CLV). These metrics provide insights into how well your product meets customer needs.
Regularly Review and Update Metrics: Continuously monitor and refine your value metrics to reflect changing customer preferences and market conditions. Regular reviews help in maintaining the relevance and accuracy of your metrics.
Leverage Advanced Analytics Tools: Use tools like UXCam to gather detailed insights into user behavior. These tools offer features like session replay, heatmaps, and event analytics, which are essential for understanding and optimizing user interactions.
Incorporate Qualitative Feedback: Combine quantitative metrics with qualitative feedback from surveys, interviews, and user testing. This holistic approach provides a comprehensive understanding of customer value.
Experiment and Iterate: Regularly experiment with different metrics and approaches to find what works best for your product and audience. Use A/B testing and other methodologies to validate changes and improvements.
Engage Cross-Functional Teams: Involve teams from different departments, such as marketing, sales, and customer support, in the process of defining and optimizing value metrics. This collaboration ensures a well-rounded perspective and better alignment across the organization.
Common Pitfalls to Avoid
Overlooking Customer Feedback: Ignoring direct feedback from customers can lead to misguided metrics. Always consider customer insights when defining and refining value metrics.
Focusing Solely on Financial Metrics: While financial metrics are important, relying exclusively on them can overlook other critical aspects of customer value. Balance financial metrics with engagement and satisfaction indicators.
Neglecting Regular Updates: Failing to update metrics regularly can result in outdated and irrelevant data. Make it a routine to review and adjust your metrics based on the latest data and trends.
Underestimating Data Quality: Poor data quality can lead to incorrect conclusions and decisions. Ensure that your data collection processes are robust and accurate to maintain the integrity of your metrics.
Ignoring SegmentationTreating all customers as a homogenous group can mask important differences in behavior and preferences. Use segmentation to tailor your value metrics to different customer groups.
Conclusion
Choosing the right value metrics involves understanding your customers, aligning with business objectives, and being flexible. It should be tailored to your product's unique use case and align with long-term goals. Experiment with different metrics and keep refining your approach.
But remember—a holistic picture of value cannot be achieved through a single metric. The key is finding the right metrics combination to give you an accurate picture of customer value.
UXCam is an all-in-one mobile analytics tool that helps mobile product teams develop that holistic picture. Features like session replay, event analytics, heatmaps, and more can provide valuable insights into user behavior. Try UXCam today for free today.
You might also be interested in these;
How to analyze session recordings
Mobile app KPI dashboard examples and how to use them
10 mobile app engagement metrics to track and measure
Mobile app metrics: essential metrics to track in your job role
Product design process - Step-by-step guide for app ideation
AUTHOR

Tope Longe
Product Analytics Expert
Ardent technophile exploring the world of mobile app product management at UXCam.
What’s UXCam?
Related articles
Curated List
Top 19 Mobile App Analytics Tools in 2026
Discover the top mobile analytics tools in 2026. Compare features, pricing, and reviews to choose the right platform for app tracking, behavioral insights, and data-driven...

Jonas Kurzweg
Product Analytics Expert
App Analytics
Best Android App Analytics Tools in 2026
Discover the top 8 Android analytics including UXCam, Firebase, and Flurry Analytics. Compare features, pricing, and platforms...

Annemarie Bufe
Product Analytics Expert
App Analytics
Top Analytics SDKs 2026
Pick the right analytics SDKs to improve your app's...

Jonas Kurzweg
Product Analytics Expert


