What is Product Analytics? Guide, Tools & Best Practices


TABLE OF CONTENTS
- What is product analytics?
- Product analytics vs traditional web analytics
- What are the key product analytics metrics and KPIs?
- Recommended product analytics tools and software
- Checklist for choosing the ideal tool
- Actionable strategies for effective product analysis
- Step-by-step guide to implementing product analytics
- Common pitfalls to avoid
- Improve your product experience with UXCam
This article explains what product analytics is, how it differs from traditional web analytics, and the key metrics to track. It also covers top tools like UXCam, Mixpanel, and Pendo, best practices, and a step-by-step guide to implementing product analysis. For more insights on improving user engagement, explore our blog.
Want to see how users interact with your product?
Every successful web product is built on understanding user behavior. But raw data alone is not enough; you need to know not just what users do, but why they do it.
Product analytics turns user actions into actionable insights. It shows where people drop off in funnels, which features drive engagement, and what keeps users coming back.
And the results speak for themselves: companies that rely on data-driven decisions are 23 times more likely to acquire new customers.
In this UXCam article, we’ll explore what product analytics is, the tools that help you uncover deeper insights, and actionable strategies for improving user experience and driving long-term growth.
Why trust us?
At UXCam, we’ve helped numerous product teams improve conversions by uncovering exactly how users interact with their products. Our expertise and years of experience position us to guide you in understanding product analytics and building data-informed strategies that enhance user experience.
UXCam helps us to find friction points during our order flow that could cause users not to complete an order. - Luis Bitencourt-Emilio, Chief Product Officer at Rappi.

What is product analytics?
Product analytics is the process of tracking, analyzing, and interpreting how users interact with your web product. It focuses on understanding user behavior, uncovering patterns, and identifying opportunities to optimize your product for better engagement, retention, and overall success.
Unlike traditional website analytics, which measures general metrics like traffic and bounce rates, product analytics dives deeper into the user journey. It examines specific actions users take, such as feature clicks, navigation flows, and drop-off points in key funnels like onboarding or checkout. This level of insight is essential for web-based products where user experience drives value.
For product managers, product analytics is a game-changer. It answers critical questions like:
Which features are users engaging with the most?
Where are users getting stuck or abandoning their tasks?
What drives users to convert, return, or churn?
These insights allow you to prioritize features, refine user flows, and shape your product roadmap based on real data, not guesswork. Whether you're fixing usability issues or testing new features, product analytics helps you make smarter, data-driven decisions that directly impact your web product’s success.
By going beyond surface-level metrics, product analytics empowers you to connect the dots between user behavior and business outcomes, making it an indispensable tool for building products users love.
Product analytics vs traditional web analytics
At first glance, web analytics and product analytics may seem similar; they both analyze data from your web product. But they serve very different purposes. Understanding these differences is crucial for making informed decisions about your tools and strategies.
What is the difference between product analytics and web data analytics?
Web analytics is primarily focused on marketing metrics. It tracks traffic patterns like pageviews, bounce rates, and referral sources to help you evaluate your website’s performance and marketing campaigns. For example, web analytics can tell you how many visitors land on your site from an ad campaign or how long they stay on a particular page.
On the other hand, product analytics dives into user behavior within your web product. It focuses on user journeys, behavior flows, and feature-level engagement. Instead of just tracking whether someone visited your product page, it helps you understand what they did next—Did they click a specific button? Complete the onboarding flow? Abandon a key step in the signup process?
Here’s a quick comparison of their key differences:
| Aspect | Web Analytics | Product Analytics |
|---|---|---|
| Primary Focus | Marketing metrics (traffic, conversions) | User journeys, feature engagement |
| Level of Insight | Surface-level (pageviews, bounce rates) | Deep behavioral insights (flows, events) |
| Use Case | Evaluate campaigns, traffic sources | Optimize UX, improve product functionality |
| Tools | Google Analytics, Adobe Analytics | UXCam, Amplitude, Mixpanel |
Depth of insight
Product analytics offers a much richer understanding of how users interact with your product by leveraging advanced tools and techniques:
Session replay: This feature lets you replay user sessions to see exactly how users navigate your product. It’s a powerful way to identify pain points or confusion that raw numbers can’t reveal.
Heatmaps: Visualize which areas of your web product users interact with the most. Heatmaps highlight hotspots of activity and help you identify underused features or design elements.
Funnel analysis: Track user progress through critical workflows like onboarding or checkout. Funnel analysis helps you pinpoint exactly where users drop off and optimize those bottlenecks.
Event tracking: Go beyond pageviews by tracking specific actions, like button clicks or form submissions. This granularity helps you understand user intent and behavior at a feature level.
Why product analytics matters more for web products
If your focus is improving user experience, retention, and engagement, traditional web analytics falls short. Product analytics provides actionable insights that allow you to fine-tune your product, from feature adoption to navigation flows.
For example, a solution like UXCam combines session replay and funnel analysis to give you both the "what" and the "why" behind user actions. Instead of just knowing a user dropped off on a signup form, you can see the exact steps they took, and fix the root issue.


By shifting from web analytics to product analytics, you unlock a deeper understanding of your users, enabling you to deliver a product that truly meets their needs.
What are the key product analytics metrics and KPIs?
Tracking the right metrics is the foundation of effective product analytics. These metrics go beyond surface-level data and give you actionable insights into how users interact with your web product. Each one tells a story about user behavior and product performance.
Here are some of the most important metrics to focus on:
| Metric | What it measures | Why it matters |
|---|---|---|
| Funnel conversion rate | User progress through workflows like signup or checkout. | Identifies drop-off points to improve user conversions. |
| Engagement rates | User activity such as sessions and feature interactions. | Highlights user interest and areas needing improvement. |
| Retention & churn rate | Tracks returning users and those who stop using. | Reveals product satisfaction and long-term user value. |
| Feature adoption rate | Frequency of use for specific product features. | Prioritizes valuable features and identifies underutilized ones. |
| Time-on-task | Time spent completing tasks or workflows. | Uncovers usability issues for optimizing user experience. |
Connecting metrics to product success
These metrics aren’t just numbers; they’re a roadmap for delivering a better user experience. When you track them effectively, you gain insights that help you:
Identify and fix pain points in user workflows.
Improve usability and feature discoverability.
Prioritize product updates based on actual user behavior.
With UXCam, you can move beyond merely tracking metrics to uncovering the why behind user behavior, bridging the gap between quantitative data and qualitative insights with a single click. This seamless transition accelerates your time to insight, simplifying how you approach product analytics.
Using UXCam’s powerful features like session replay and funnel analysis, you can go deeper into your data. Instead of just identifying where users drop off or engage, you can see exactly how they navigate your web product. Watch real user sessions to uncover friction points, confusion, or moments of delight, and transform raw numbers into actionable insights effortlessly.
By leveraging these tools, you’ll not only track core KPIs but also gain the clarity needed to build a product that’s intuitive, engaging, and perfectly aligned with user expectations. With UXCam, accelerating product improvements and simplifying complex analytics workflows has never been easier.
Recommended product analytics tools and software
The best tools go beyond basic metrics, offering features like session replay, funnel analysis, and user segmentation to help you understand both quantitative trends and qualitative behaviors.
Below, we present some of the most effective product analytics platforms available.
1. UXCam
UXCam helps you understand exactly how users experience your mobile and web apps. Our platform records user sessions, tracks gestures like taps and scrolls, and visualizes key moments with heatmaps and funnels. This gives you a complete picture of how people interact with your product.


We combine quantitative metrics with qualitative insights so you can see not just what users do, but why they do it, and improve experiences faster. This enables data-driven decisions that improve engagement, conversion, and long-term growth across web and mobile platforms.
Key Features
Tara AI: Use our AI-driven assistant Tara to automatically analyze user sessions, detect friction points, and summarize behavioral insights.
Session replay & heatmaps: Watch real user sessions and see visual summaries of taps, scrolls and gestures to understand how people actually use your app.
Automatic event & screen capture: One snippet of code gets you a wide range of captured data, screens visited, gestures, crashes, UI freezes, without heavy manual instrumentation.
Funnels & retention analysis: Track conversion paths, identify drop-offs, and monitor user retention so you can find where users disengage.
Segmentation & smart filters: Filter sessions and events by device, user property, session behavior, or natural-language queries to zero in on specific cohorts.
Privacy & lightweight SDK: The SDK is built to minimize performance impact and includes features to mask sensitive user data and comply with privacy norms.
Pricing
We offer a free plan giving up to 3,000 sessions per month with core features included. Paid plans are custom-quoted and scale with session volume and features, so you only pay for what you need.
2. Mixpanel
Mixpanel helps you analyze how users interact with your product by tracking events, funnels, and retention. With real-time insights and customizable dashboards, you can measure engagement, identify drop-offs, and make data-driven decisions to improve user experience and growth.


Key Features
Event-tracking: Track specific user actions such as clicks, sign-ups, and purchases.
Funnel analysis: Visualize how users move through defined steps and where they drop off.
Retention & cohort analysis: Measure how often users return and engage over time.
Segmentation & cohorts: Break down users by attributes, behaviours and create custom groups.
Real-time reports & dashboards: View live data, build custom visualisations, and track trends.
Pricing
Mixpanel offers a free tier covering up to 1 million events per month. Paid “Growth” plans scale with your event volume at $0.28 per 1000 events. The Enterprise plan is custom-quoted for high volumes and advanced features.
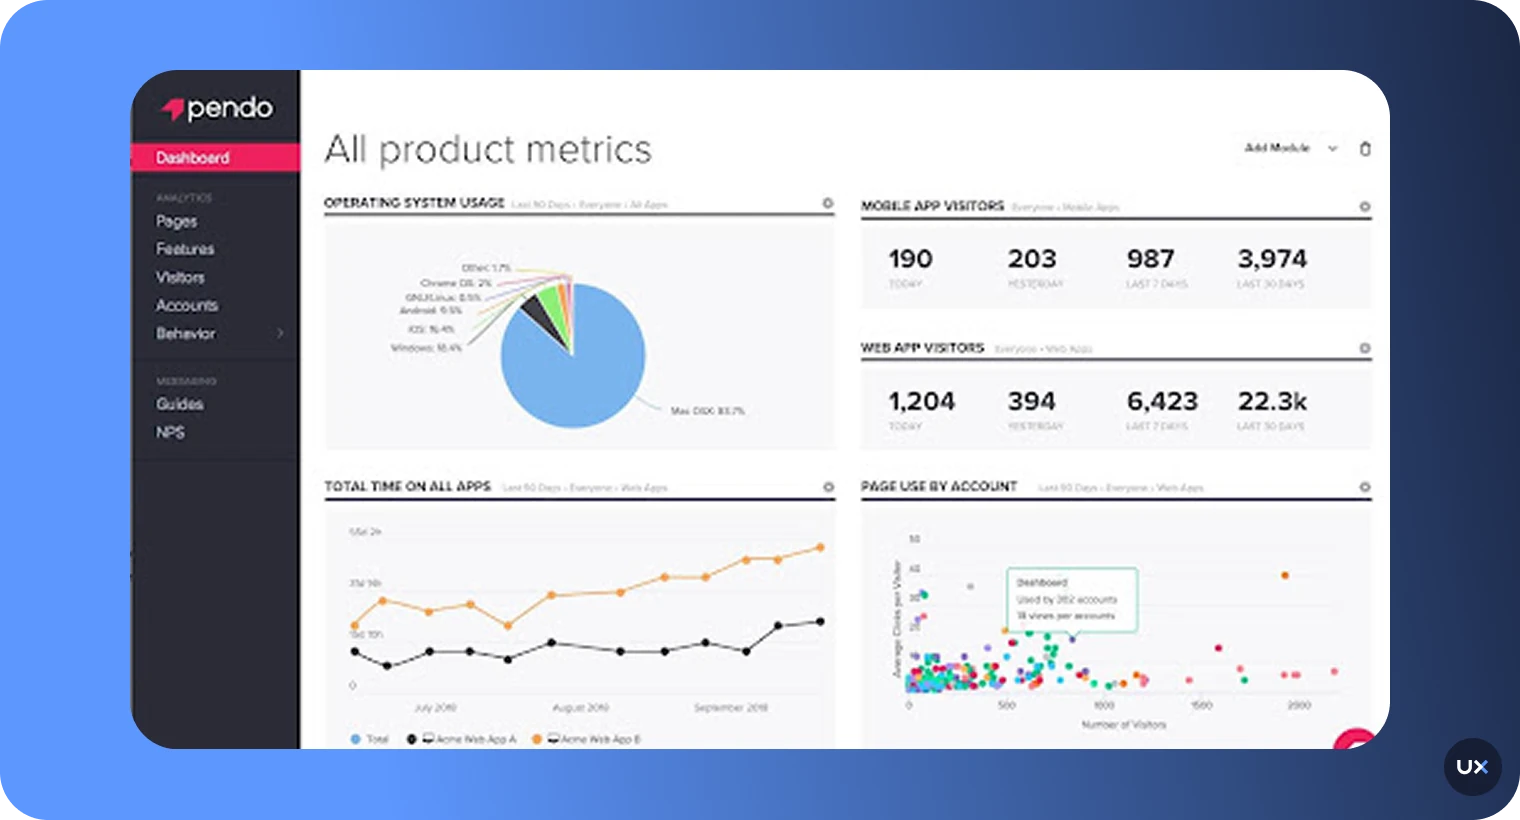
3. Pendo
Pendo is a product experience platform that helps you see how customers and employees use your software across web, mobile, and desktop. It lets you track feature usage and user journeys, gather feedback through surveys, and deliver in-app guides to boost onboarding and adoption.


Key Features
Product analytics: Track user journeys, page views, and conversion funnels without heavy coding.
Feature usage tracking: Monitor which product features users interact with most to measure adoption and engagement.
In-app guides: Create walkthroughs, tooltips, and announcements to onboard users and highlight new features.
User feedback: Collect insights through in-app surveys and polls to understand customer sentiment.
Segmentation: Group users by behavior, role, or demographics to personalize experiences and analyze trends.
Pricing
Pendo offers four plans (Base, Core, Pulse, Ultimate). Pricing is customized based on monthly active users, product features, and level of support required.
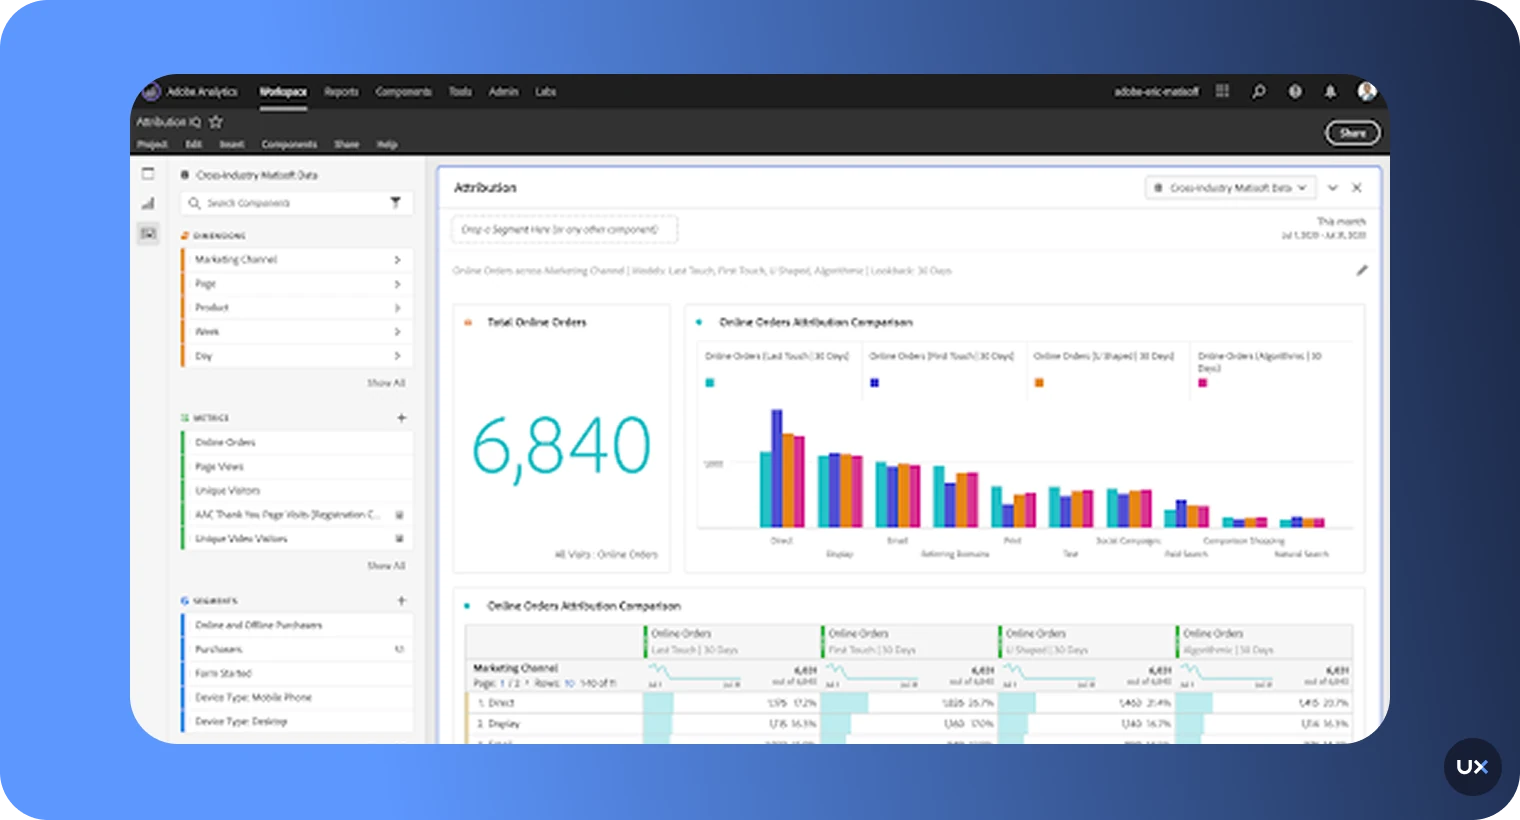
4. Adobe Analytics
Adobe Analytics helps businesses collect and analyze data from websites, mobile apps, and other channels to understand customer behaviour, optimize experience,s and support decision-making. It offers real-time analytics, advanced segmentation, and predictive insights that scale for enterprise use.


Key Features
Cross-channel tracking: Collect and analyze data from web, mobile, and other digital touchpoints in one platform.
Real-time analytics: Monitor visitor activity and performance metrics as they happen for faster decision-making.
Advanced segmentation: Break audiences into detailed segments based on behavior, demographics, and custom variables.
Attribution modeling: Understand which channels and campaigns drive conversions across the customer journey.
Predictive analytics: Use AI-driven insights to forecast trends and identify potential opportunities or risks.
Pricing
Adobe Analytics offers a tiered structure (Select, Prime, Ultimate) with customized pricing based on data volume, users, features, and integrations.
5. Countly
Countly is a product analytics platform that gives you full control of your data and prioritises privacy. It tracks user activity across mobile, web, and desktop apps, offering real-time insights, engagement tools (like surveys, notifications, A/B testing,) and flexible self-hosted or cloud deployment options.


Key Features
Event tracking: Monitor user actions and behaviors across mobile, web, and desktop apps in real time.
Funnels and retention: Identify where users drop off and measure long-term engagement trends.
Segmentation: Group users by behavior, demographics, or device to uncover usage patterns and opportunities.
Crash analytics: Detect and analyze app crashes with detailed reports to improve stability.
User profiles: View individual user journeys, session histories, and interaction timelines.
Pricing
Countly offers a free plan (Lite). Paid plans (Flex Free, Flex, and Enterprise) scale with monthly active users (MAUs), data points, add-on features, hosting model, and support level.
Here’s an overview of the tools:
| Tool | Best For |
|---|---|
| UXCam | Seamless quantitative and qualitative insights, AI analyst, session recording |
| Mixpanel | Real-time analytics, event tracking, predictive insights |
| Pendo | In-app guides, user feedback, product engagement |
| Adobe Analytics | Cross-channel tracking, advanced segmentation, attribution modeling |
| Countly | Self-hosted flexibility, crash reports, A/B testing |
Checklist for choosing the ideal tool
Custom event tracking - Track specific user interactions, like clicks and form submissions, tailored to your product.
Customizable dashboards - Visualize track key metrics live for immediate insights.
Session replay & heatmaps - See user interactions through session replays and identify engagement hotspots or neglected areas with heatmaps.
User segmentation and cohort analysis - Group users by behavior, demographics, or cohorts to uncover trends and optimize experiences.
Funnel analysis - Map user navigation paths to identify patterns, shortcuts, or inefficient flows.
Retention & churn analysis - Monitor user return rates over time to assess long-term product value.
Error tracking and monitoring - Detect, analyze, and prioritize bugs or technical issues impacting user experience.
Behavioral filters - Dynamically segment users based on specific behaviors (e.g., completed onboarding but didn’t upgrade).
Custom alerts and notifications - Receive real-time updates for critical changes in metrics or user behaviors.
Scalable data infrastructure - Ensure the tool handles growing user data seamlessly as your product scales.
Privacy and compliance tools - Built-in features for GDPR, CCPA, and other privacy regulations to handle data responsibly.
Actionable strategies for effective product analysis
1. Start small, then scale
When starting with product analytics, resist the urge to track everything at once. Focus on a few critical metrics or key events that align with your product goals, such as funnel conversion or feature adoption. Tracking too much data upfront can lead to analysis paralysis and make it harder to identify actionable insights. As your understanding grows, gradually expand your tracking efforts to include more nuanced user behaviors.
2. Iterative testing
Treat your product analytics as a foundation for continuous improvement. Use A/B testing to experiment with changes, such as UI tweaks or feature placements, and validate your hypotheses with real user data. For instance, if users are dropping off during onboarding, test a shorter flow or different messaging. This iterative approach helps you refine your UI/UX design based on what works best for your users.
3. Combine quantitative and qualitative insights
Numbers tell you what’s happening, but they rarely explain why. Pair your quantitative data, like funnel metrics or retention rates, with qualitative insights, such as user surveys or session replay. For example, session replays can help you observe where users struggle in real time, complementing the trends you see in analytics dashboards. Together, these insights offer a complete picture of user behavior and help you make informed decisions.
4. Collaborate across teams
Product analytics is most effective when it’s a team effort. Involve stakeholders from different departments, designers, developers, marketers, and customer success teams, to ensure a shared understanding of analytics goals. Designers can leverage behavioral data to refine user flows, while marketers can use engagement metrics to optimize campaigns. Collaboration ensures everyone is aligned, resulting in a cohesive product strategy and more meaningful outcomes.
5. Prioritize user-centric metrics
Focus on metrics that directly impact the user experience and product value, such as task completion rates, time-to-value, or feature adoption. Avoid vanity metrics like raw pageviews or downloads unless they offer actionable insights.
6. Use automated alerts
Set up automated alerts for significant changes in key metrics, such as a sudden drop in conversion rates or a spike in churn. Real-time notifications enable you to react quickly and minimize the impact of problems.
7. Regularly reassess goals and metrics
Analytics priorities should evolve as your product and business grow. Periodically revisit your goals, KPIs, and tracking setup to ensure they remain aligned with current objectives and user needs.
Step-by-step guide to implementing product analytics
Following a structured process helps you avoid confusion, minimize errors, and get actionable insights from day one. Here’s a step-by-step approach to guide you:
Define key events & KPIs: Start by identifying the most critical metrics and events for your product goals. For example, if your goal is to improve user onboarding, track events like account creation, feature usage during onboarding, and completion rates. Defining these KPIs ensures your analytics efforts are focused and impactful.
Deploy tracking code: Integrate the analytics tool’s tracking code into your web product. Ensure the code is optimized to avoid affecting page load times or overall product performance. Collaborate with developers to map events accurately and prevent implementation errors that could compromise your data.
Validate & test data accuracy: Once your tracking code is live, validate your data to ensure accuracy. Compare event data with expected outcomes. Did the tool capture the correct interactions? Perform test scenarios (e.g., mock user sessions) to confirm every key event is being tracked as intended.
Set up dashboards: Create intuitive dashboards that visualize your key metrics in real time. Prioritize simplicity, highlight critical insights like funnel progress, session durations, or feature adoption trends. Dashboards provide immediate visibility, making it easier for your team to monitor product performance at a glance.
Analyze & iterate: Review your data regularly to identify trends and opportunities. Combine quantitative metrics, like funnel drop-off rates, with qualitative tools such as session replay to understand user behavior. Use these insights to create an ongoing feedback loop, refining your product with every iteration.
Common pitfalls to avoid
Data misinterpretation: Numbers don’t always tell the full story. Avoid jumping to conclusions based on surface-level metrics. For instance, a high bounce rate might seem alarming, but session replays could reveal that users quickly found what they needed. Always dig deeper.
Ignoring qualitative feedback: Quantitative data shows what users are doing, but qualitative feedback explains why. Ignoring session replays, heatmaps, or user interviews can lead to missed insights. Pair both types of data to build a complete picture of user behavior.
Failing to align analytics with business goals: Tracking data without a clear connection to your business objectives can lead to irrelevant or overwhelming insights. Always ensure your analytics strategy is tied to specific goals, such as improving retention or increasing feature adoption.
Ignoring edge cases: Overlooking edge cases, such as small user segments or rare behaviors, can hide valuable insights. For example, a small group of power users may reveal patterns that could benefit a broader audience.
Neglecting user privacy and compliance: Failing to prioritize privacy can lead to regulatory issues and damage user trust. Ensure your implementation complies with data protection regulations like GDPR and CCPA, and provide transparency about how user data is collected and used.
Improve your product experience with UXCam
Product analytics gives you a clear view of how users experience your web app. By tracking key metrics and combining quantitative data with qualitative insights, you can uncover what drives engagement and retention, and make smarter decisions that lead to lasting product success.
UXCam brings these insights to life. With tools like session replay, funnel analysis, and intelligent autocapture, you can spot friction points, understand user intent, and improve experiences faster.
Try UXCam for free and build better, more intuitive products.
You might also be interested in these;
Product Analytics Examples - 5 Case Studies to Inspire You
How to measure product adoption (metrics, formulas & tools)
5 Best product analytics tools and software
Top 6 LogRocket alternatives for product analytics & monitoring
Product insights - Definition, benefits & practical examples
Top 11 product management KPIs to track
Top 14 SaaS Product Usage Metrics and How to Improve Them


TABLE OF CONTENTS
- What is product analytics?
- Product analytics vs traditional web analytics
- What are the key product analytics metrics and KPIs?
- Recommended product analytics tools and software
- Checklist for choosing the ideal tool
- Actionable strategies for effective product analysis
- Step-by-step guide to implementing product analytics
- Common pitfalls to avoid
- Improve your product experience with UXCam


Related articles


Product best practices
12 Apps with Great User Onboarding (2026 Examples)
The 12 mobile app onboarding flows I'd study if I were designing one today, with specific callouts for what each does well, common mistakes, and the...


Silvanus Alt, PhD
Founder & CEO | UXCam


Product best practices
Why creating a data-driven culture has less to do with data than you think
Kishan Gupta, CEO, shares 5 tips and techniques for fostering a data-driven culture based on his own experiences building and leading...


Kishan Gupta
Co-Founder of UXCam


Product best practices
Finance apps have a customer support problem, here's how to fix it
Learn about the customer support problem in finance apps and practical solutions to fix it in our latest blog post, and improve user satisfaction and...


Jane Leung
Product Analytics Expert