How to Conduct Cohort Retention Analysis with UXCam


Cohort retention analysis is a valuable tool that reveals user engagement trends over specific timeframes. It offers important insights for decision-making involving marketing strategies, product development, and customer retention initiatives.
At UXCam, we recognize the importance of cohort retention analysis in data-driven app development. This guide will show you exactly how you can use UXCam to run simple, impactful cohort retention reports to improve your app's UX.
Let’s dive in.
Helpful summary
Overview: Discover why cohort retention analysis is important for mobile app developers.
Why you can trust us: UXCam specializes in user experience analytics. Our tools and insights help app developers enhance user retention through detailed analysis.
Why it matters: Optimizing for retention directly impacts revenue and growth potential.
Action points: Use UXCam’s retention analysis suite to run regular cohort retention reports and optimize your app’s user experience.
Further research: Learn more about mobile app user retention by visiting the UXCam blog.
Why listen to us?
At UXCam, we've seen firsthand how critical cohort retention analysis is for businesses aiming to improve their app's user experience and overall performance.


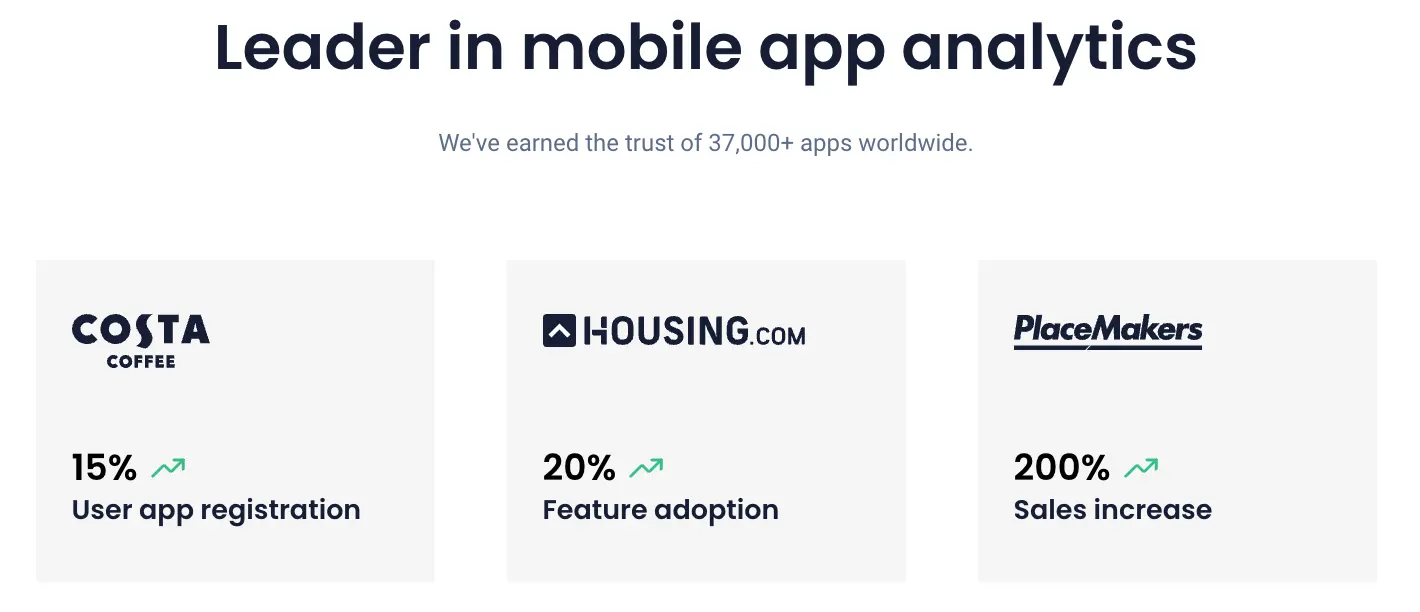
Our retention analysis tools have helped 37,000+ businesses gain valuable insights into their user behavior and make data-driven decisions to improve their app's retention rates.
What is cohort retention analysis?
First, we need to define cohorts. The simplest definition is:
segment + time = cohort
In other words, you take a segment (e.g., new users) and add a time frame (e.g., the month they signed up in) to create a cohort (new users from January).
Cohort retention analysis is the process of analyzing the behavior and retention rates of specific cohorts over time—and comparing them to other cohorts. To continue our example, we could compare the retention rates of new users from January to those of new users from February, March, and so on.
This would allow us to see when users stop finding value in our app and what factors may be contributing to their churn.
Here are two retention analytics use cases to illustrate:
SuperEats
SuperEats (a food delivery app) faced app retention challenges despite offering a popular 50% discount for new users.


By analyzing retention data with UXCam, SuperEats discovered tons of users were signing up, but by the fourth week, only a small percentage were still active. To keep users engaged beyond this point, they introduced a points system and prioritized offers for the 4-week cohort on an ongoing basis.
Puzly
Puzly (a gaming app) found that users on low-end devices had low retention rates due to technical issues like crashes and UI freezes.


By using UXCam's retention analysis, Puzly optimized its app for low-end devices, resulting in a significant 10% increase in overall retention over a few months.
Why is cohort retention analysis important?
Improve user retention over time
Cohort analysis enables app developers to meticulously track user retention patterns over time intervals. This granular approach is essential for gauging how effectively an app retains new users and pinpointing periods where user engagement may decline.
Identify marketing targets
Segmenting users into cohorts based on behavior or other criteria is a strategic move. Developers can identify users likely to convert into paying customers, those at risk of churning, and prospects for upselling or cross-selling.
Optimize strategies
Insights derived from cohort analysis fuel data-driven decisions. Developers can fine-tune app features, enhance user experience, and optimize marketing strategies to improve overall retention rates.
How to conduct a cohort retention analysis with UXCam
Conducting a cohort retention analysis with UXCam involves a structured approach:
Step 1 - Create a retention report
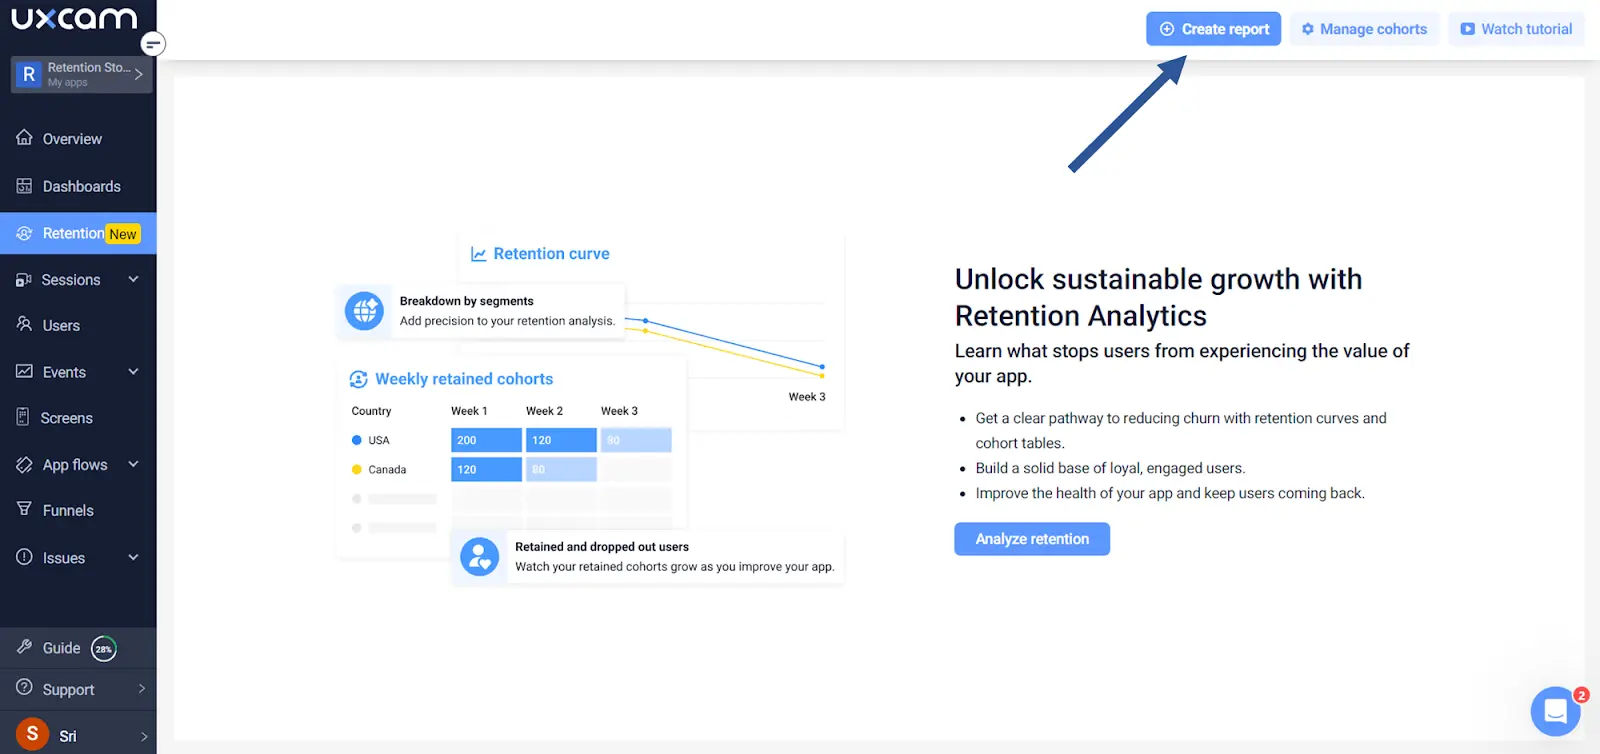
To create a retention report in UXCam, follow these steps:
Click on “Create Report”.
Select your start action, which is the foundational action for your report (e.g., “user registration”, “sign-up”, “first visit”).
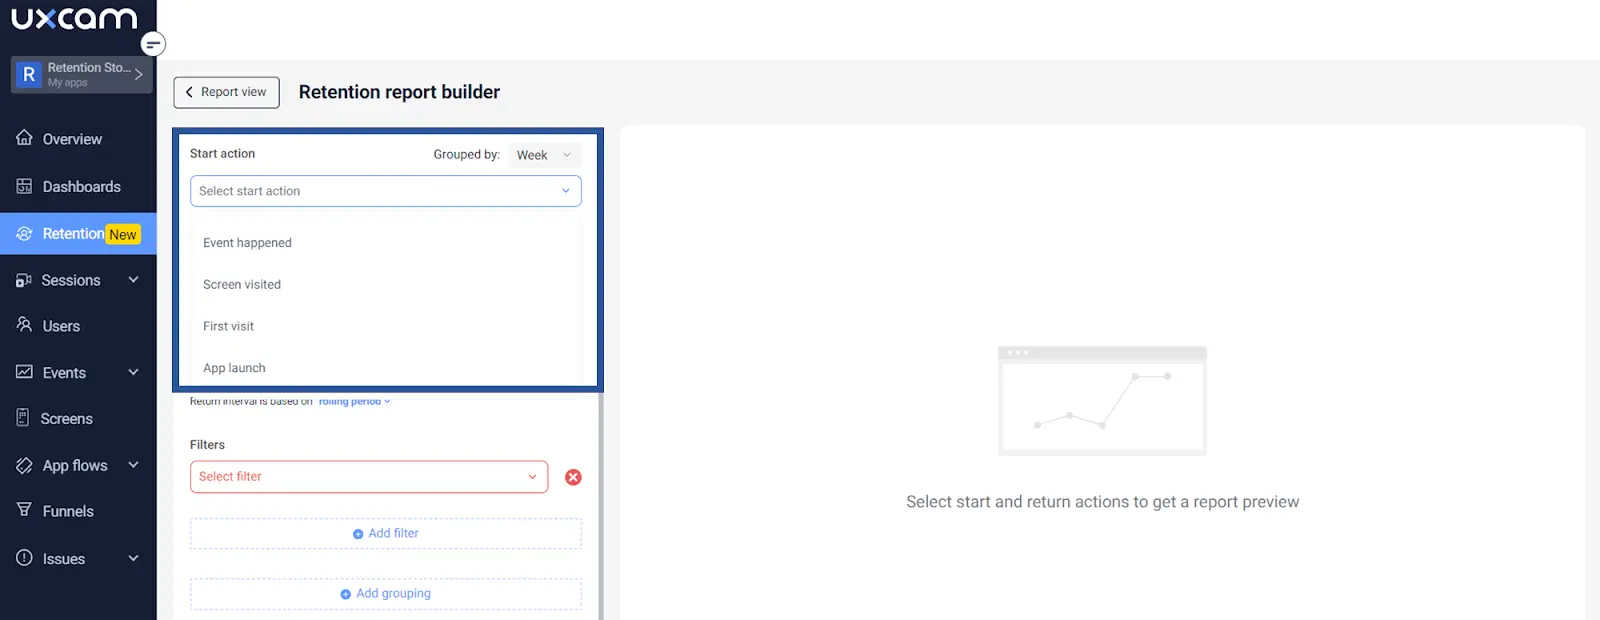
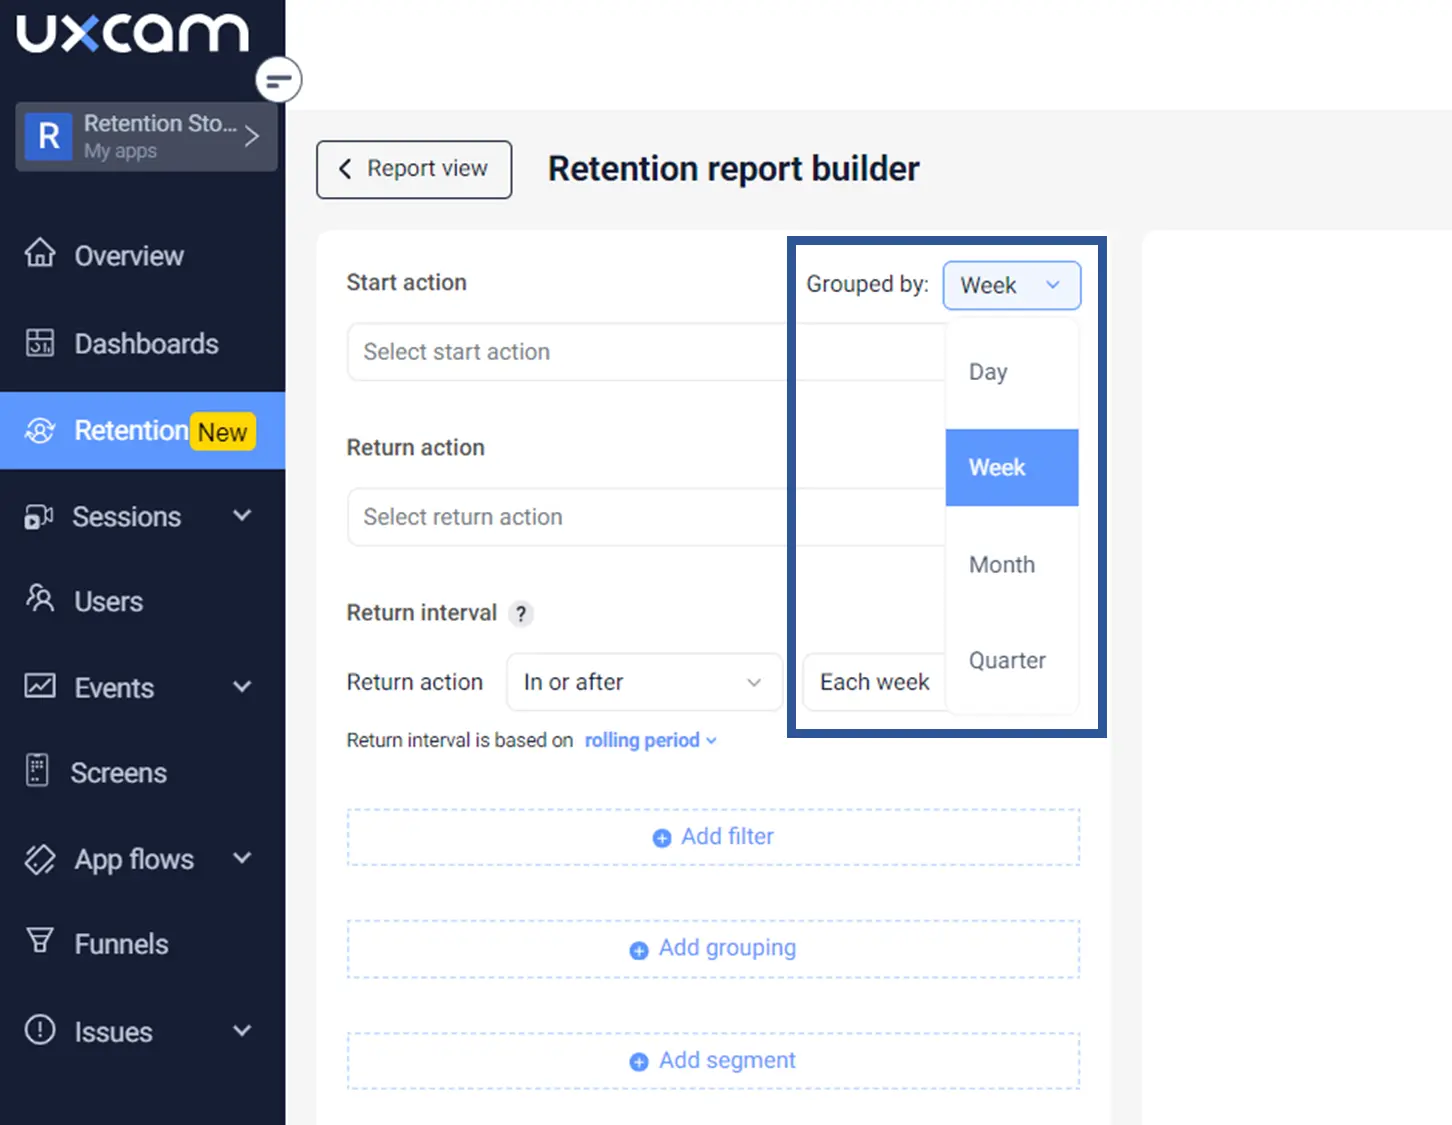
Define the size of your cohorts by selecting a grouping period (daily, weekly, monthly, quarterly).
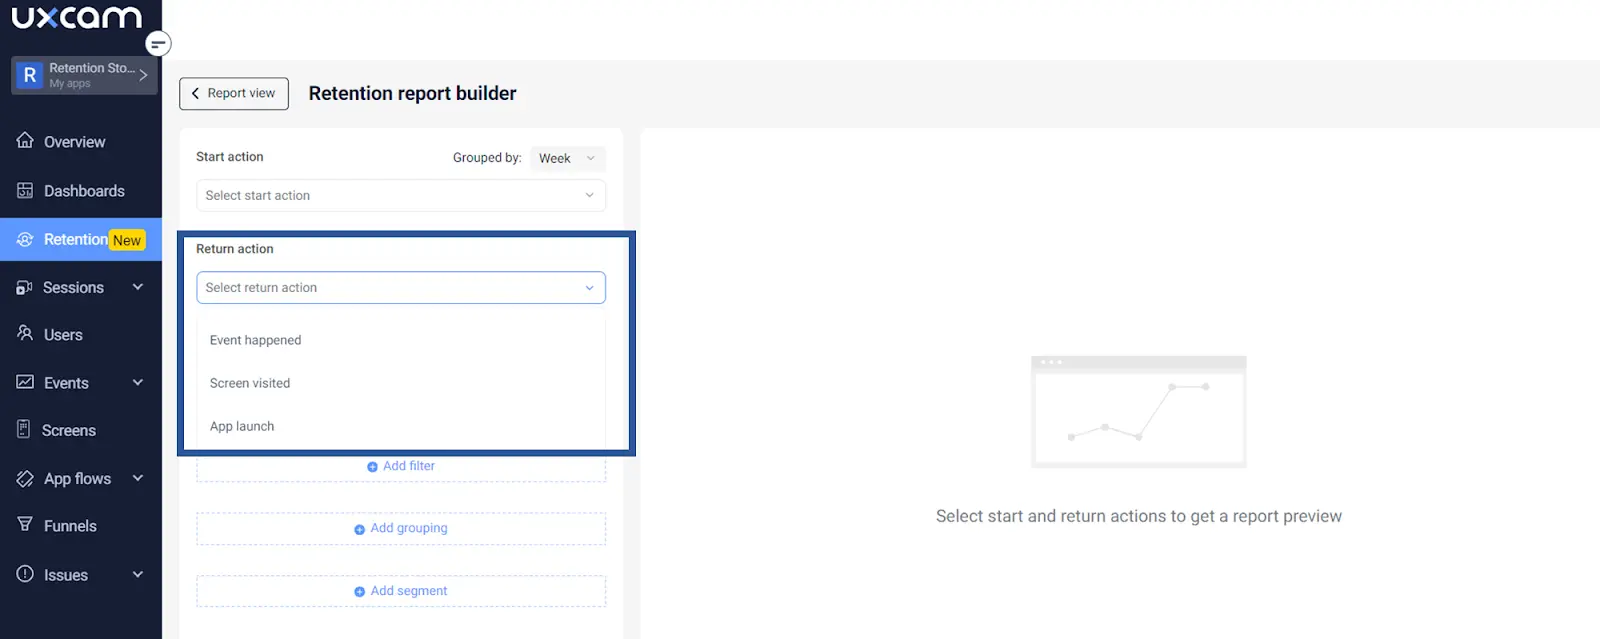
Choose your return action, which is the action you want users to repeat over time.
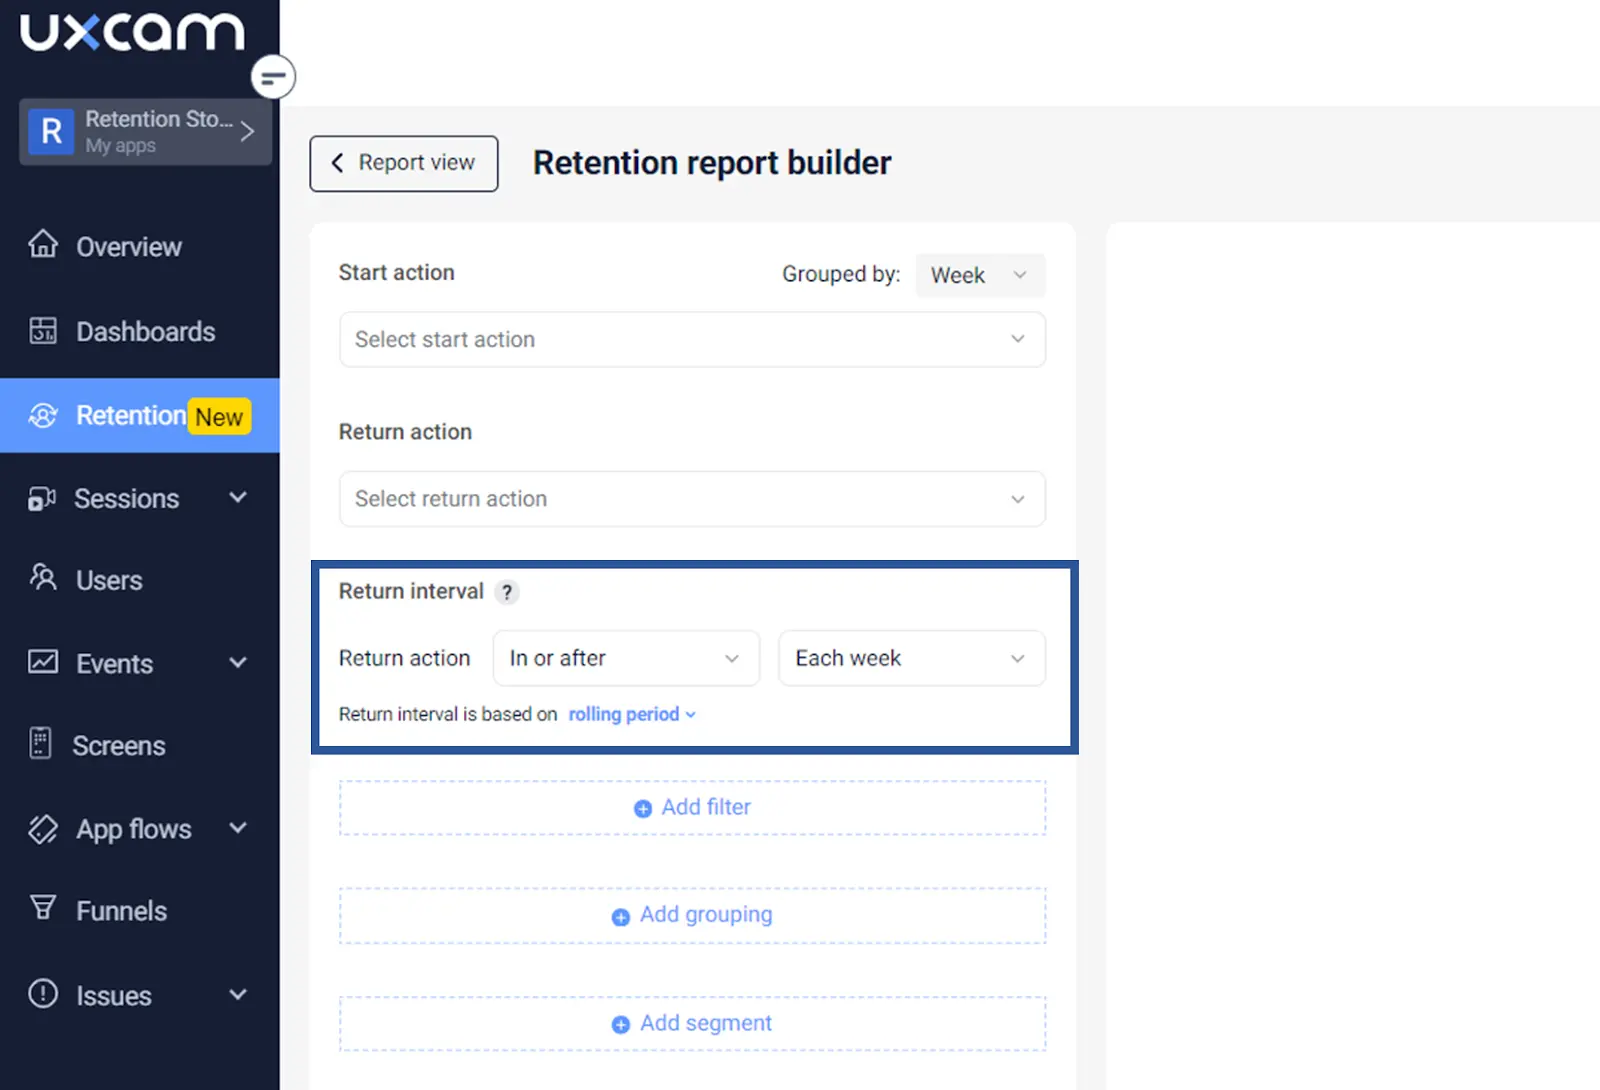
Set the return interval based on how often you expect users to perform the return action.
Choose how retention is measured (bounded vs. unbounded retention).
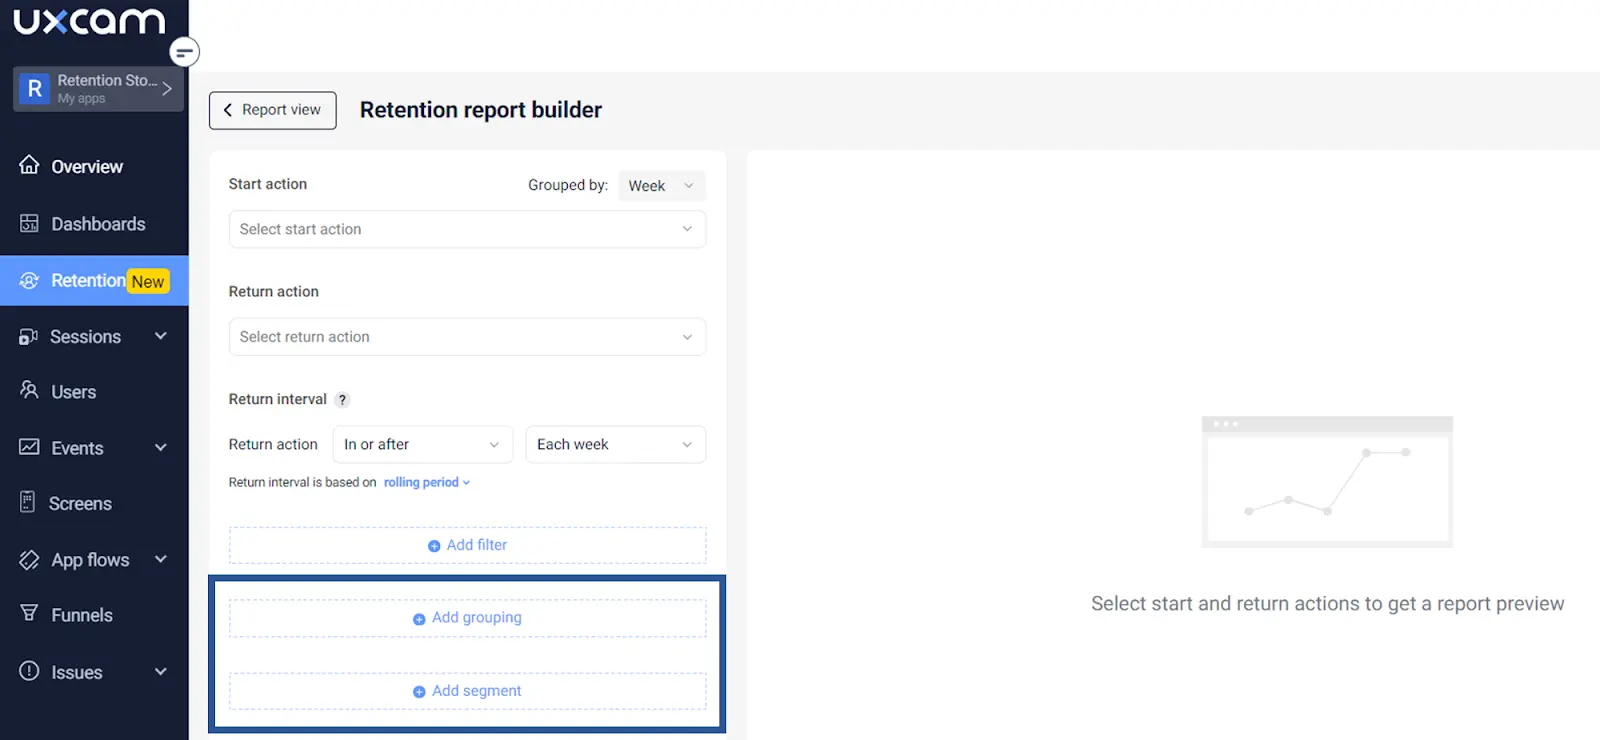
Apply filters to narrow down your report by device or user properties.
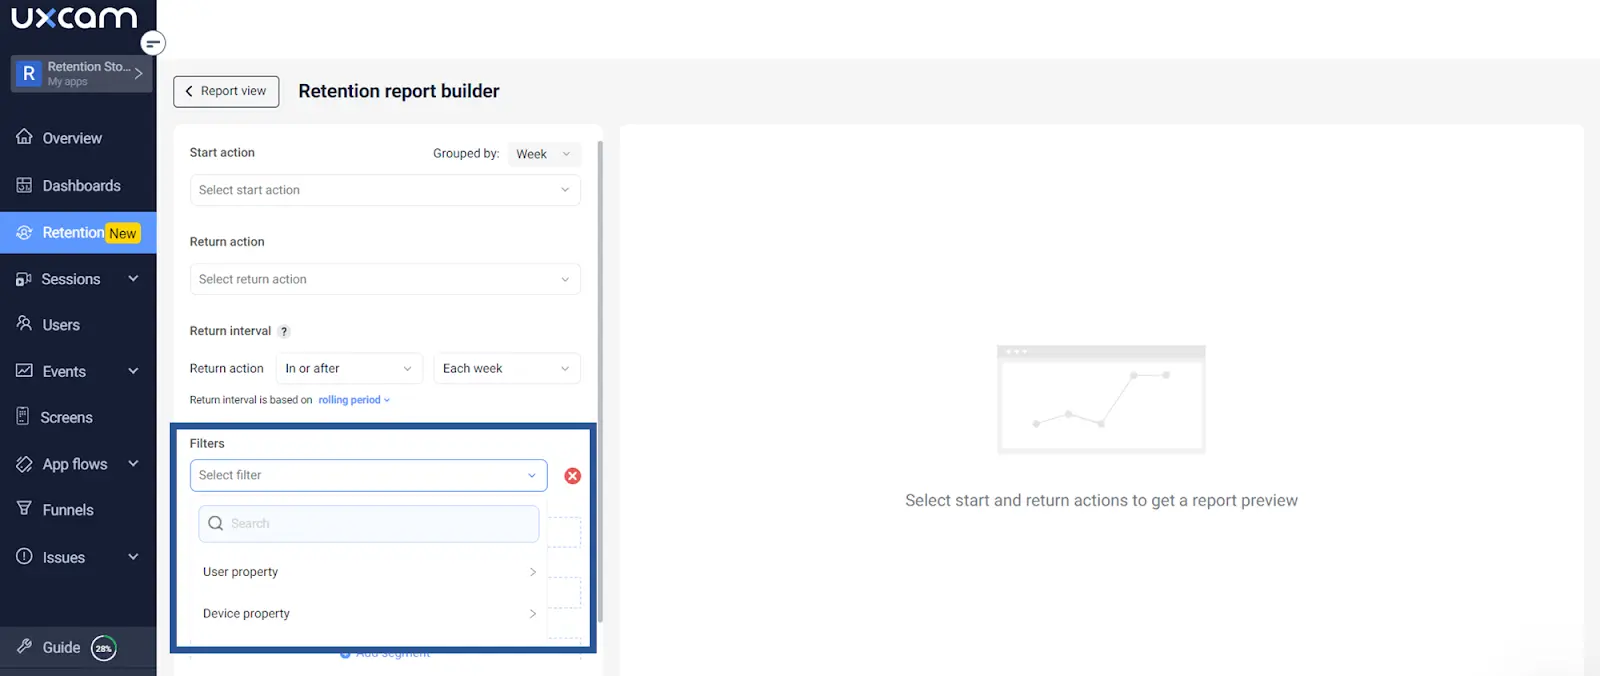
Optionally, segment your report further by applying groupings based on different properties.


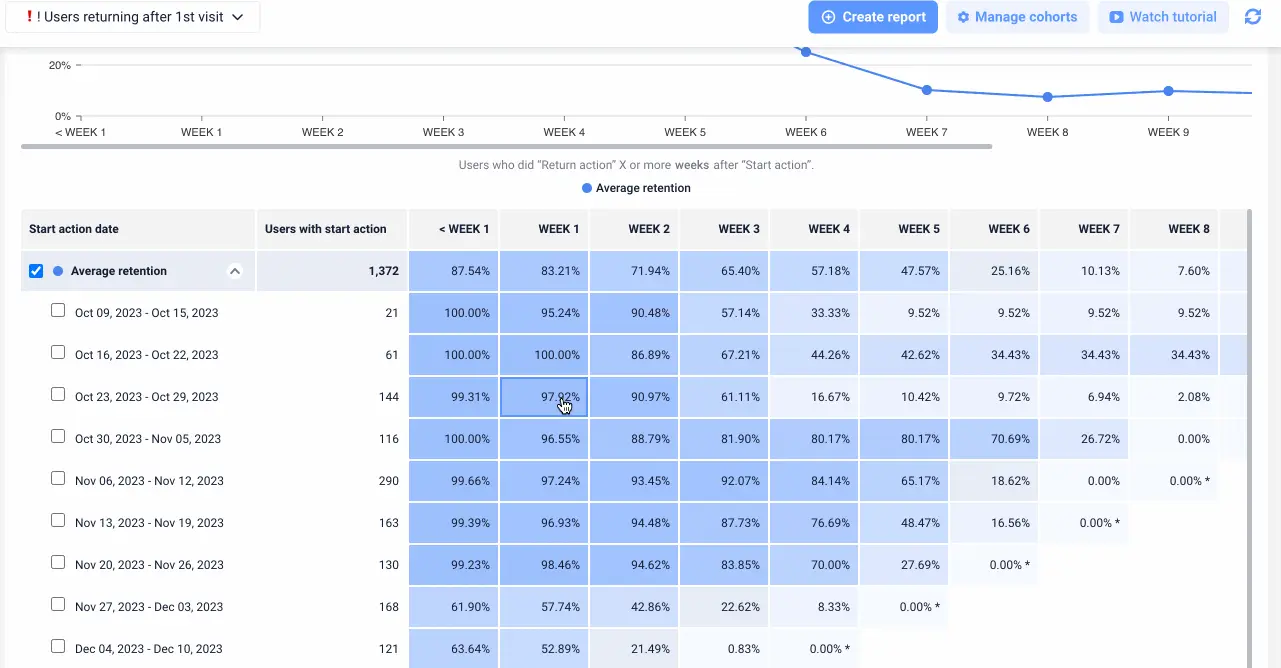
Step 2 - Analyze the retention curve
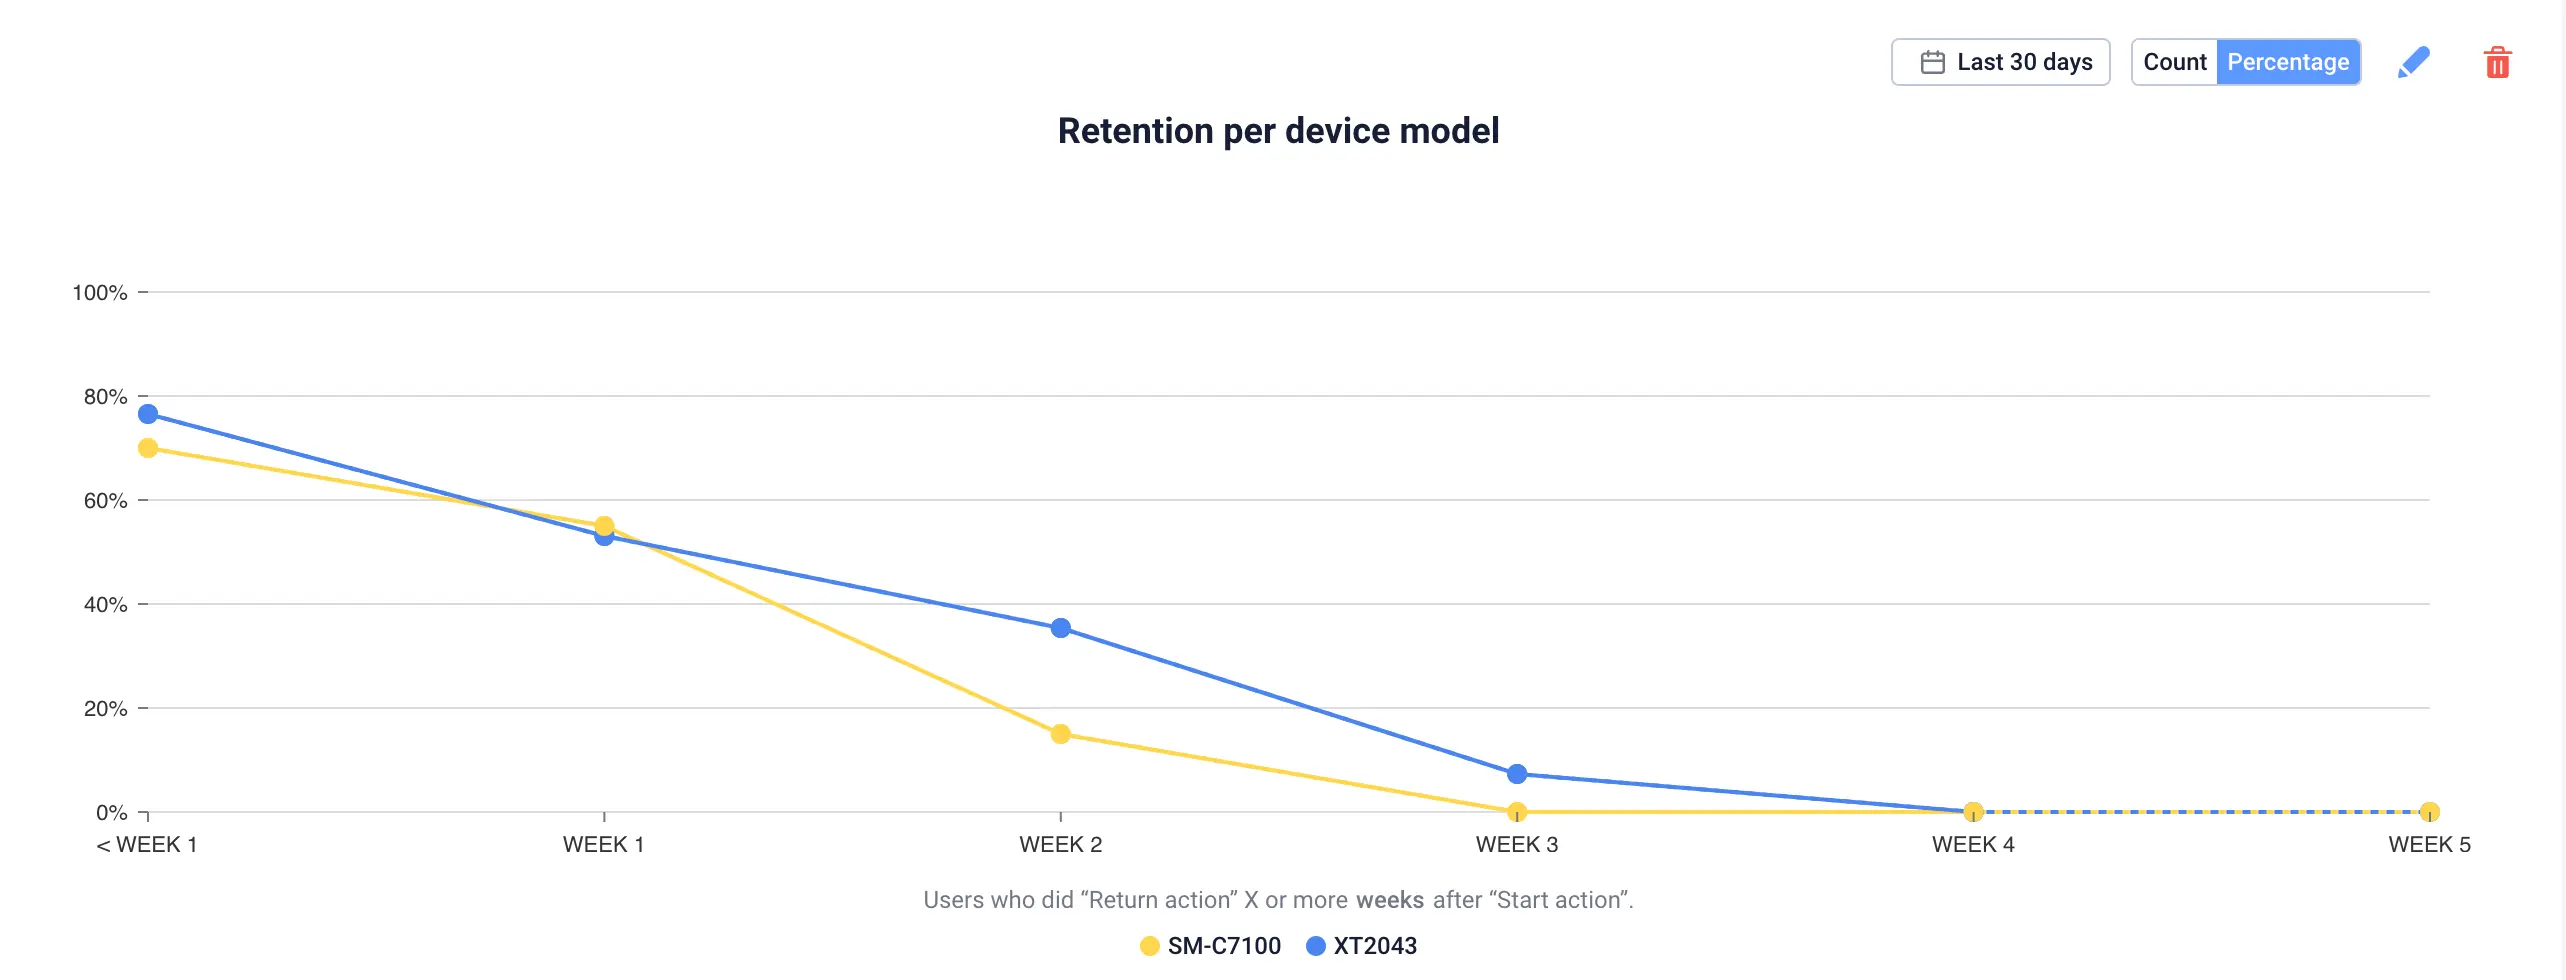
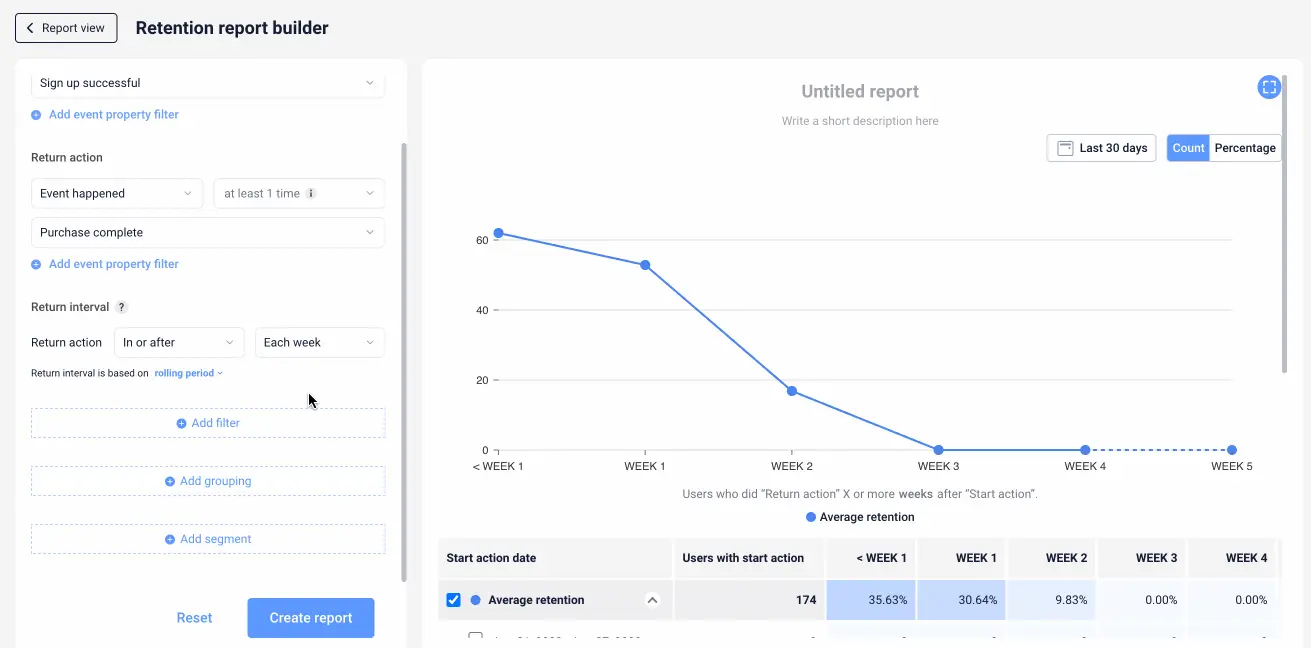
Retention curves visually represent how well an app retains users over time.
By default, a generated report includes a single retention curve showing the average retention rate for the entire selected period. Hovering over the curve reveals the average retention rate per day, week, month, or quarter based on the chosen return interval.


Different types of retention curves include:


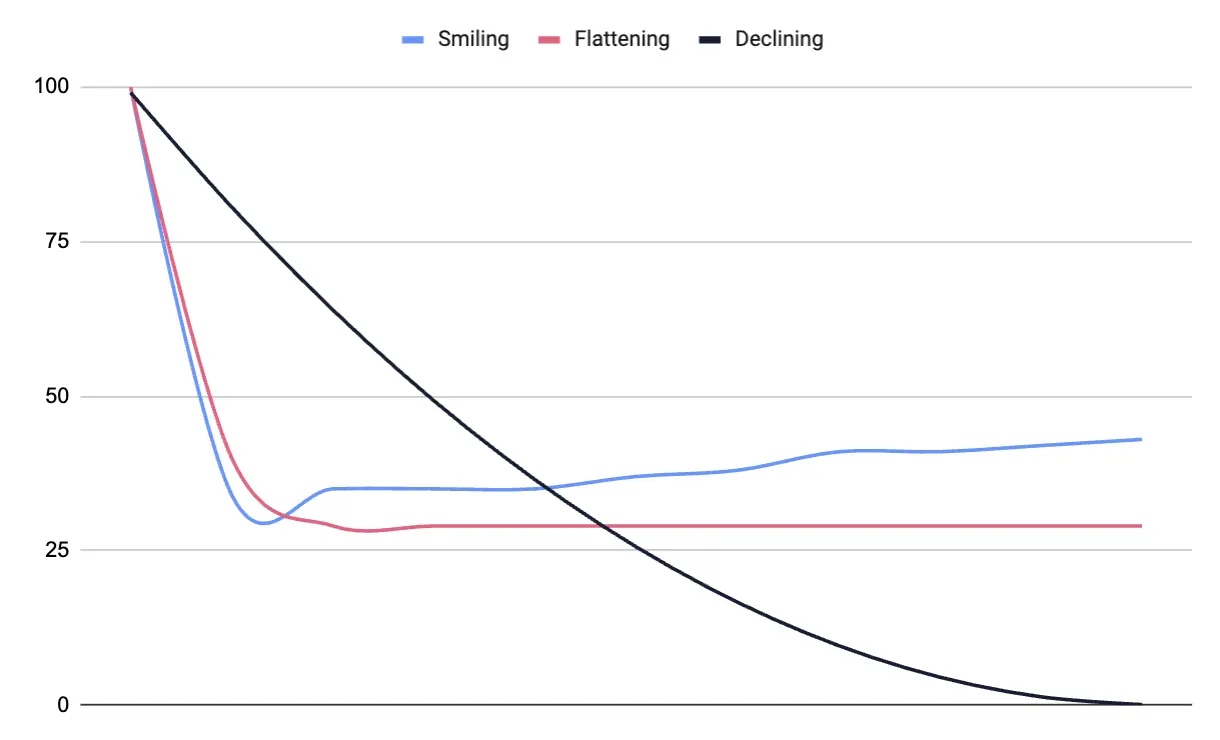
Flattening: A flattening curve indicates ongoing value perception by users over time. Higher flattening points signify better long-term retention.
Declining: A diminishing curve indicated declining user engagement (possibly due to poor user experience or lack of new features). A steep decline can signify a high churn rate.
Smiling Curve: A smiling curve is a great sign—it indicates that users are finding long-term value in your product and that many churned users are returning over time.
Analyzing and comparing the retention curves of specific cohorts can help identify trends and optimize retention strategy. Meanwhile, understanding user behavior in well-retained cohorts versus those that drop off early is essential for improving retention rates.
Step 3 - Analyze the retention table
The retention table offers a detailed breakdown of retention data. Each row represents a cohort of users, grouped by the start action date, and each column denotes the time window from the start event.
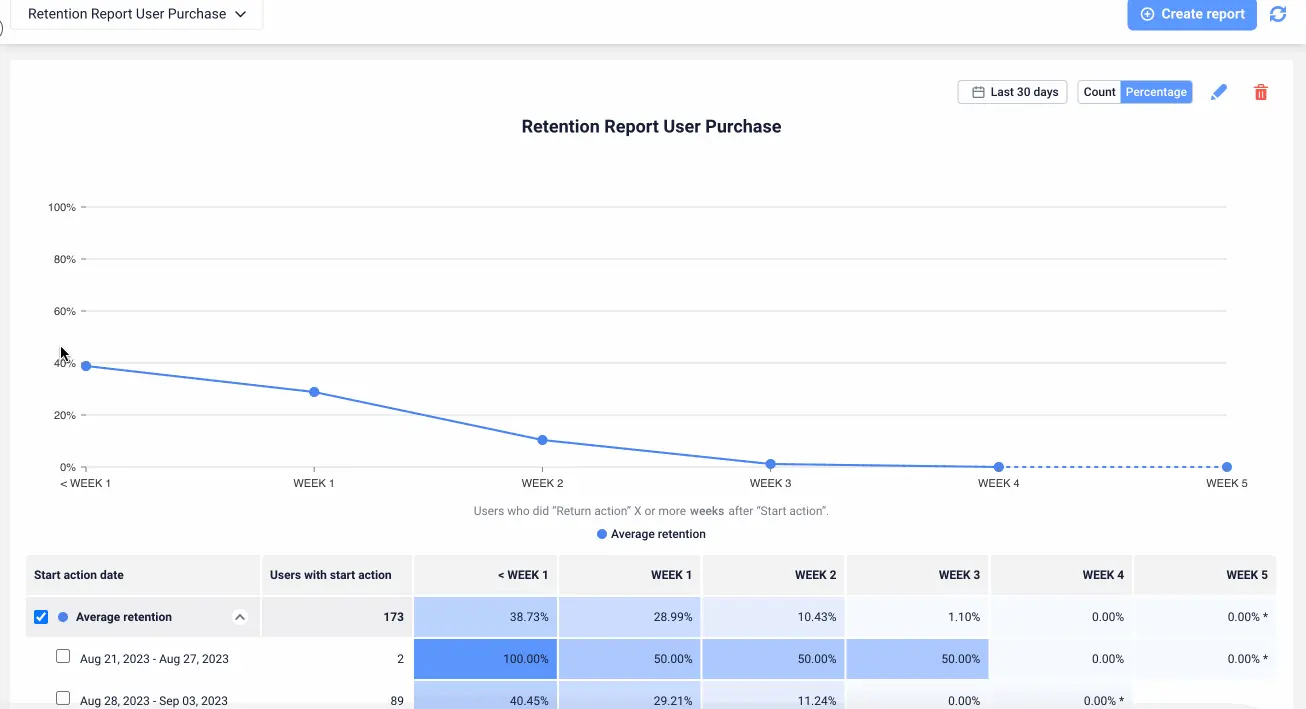
Here’s an example to show you what it looks like:


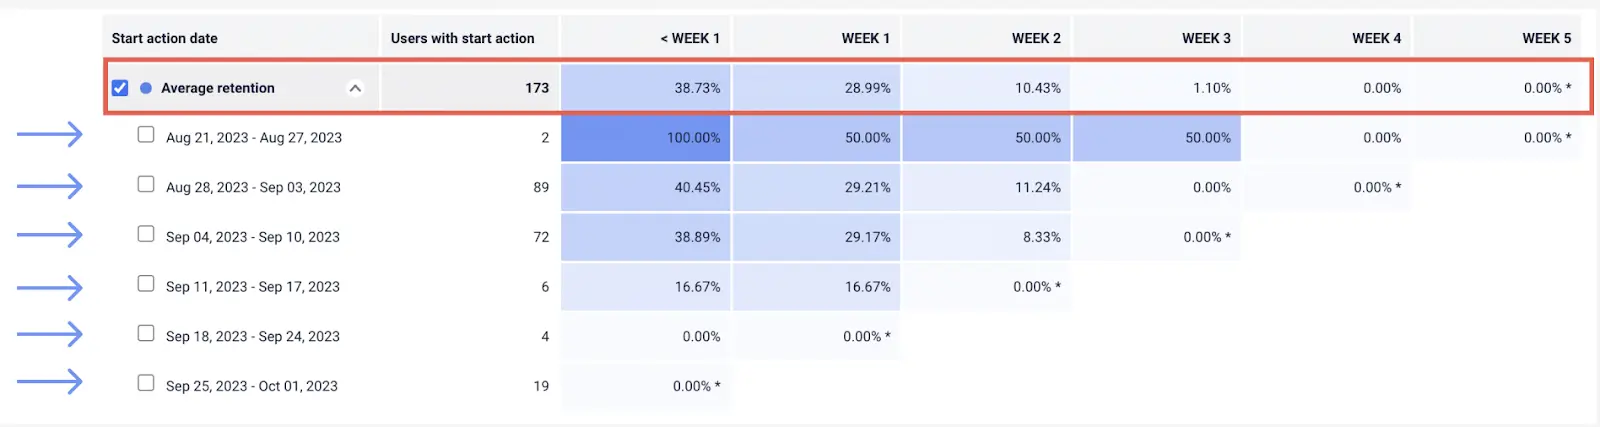
You’ll notice that rows are broken down by week of user activity, while columns show the percentage of users who returned in each subsequent week. For example, looking at the top row will give us our average retention breakdown on a week-by-week basis for all cohorts.
Moving down a row will give us our retention breakdown on a week-by-week basis for only the Aug. 21 – Aug. 27 cohort. The darker a cell, the higher the retention rate for that cohort on that week.
Step 4 - Save & analyze retained and churned cohorts
The cohort table allows for quick identification of performance patterns.


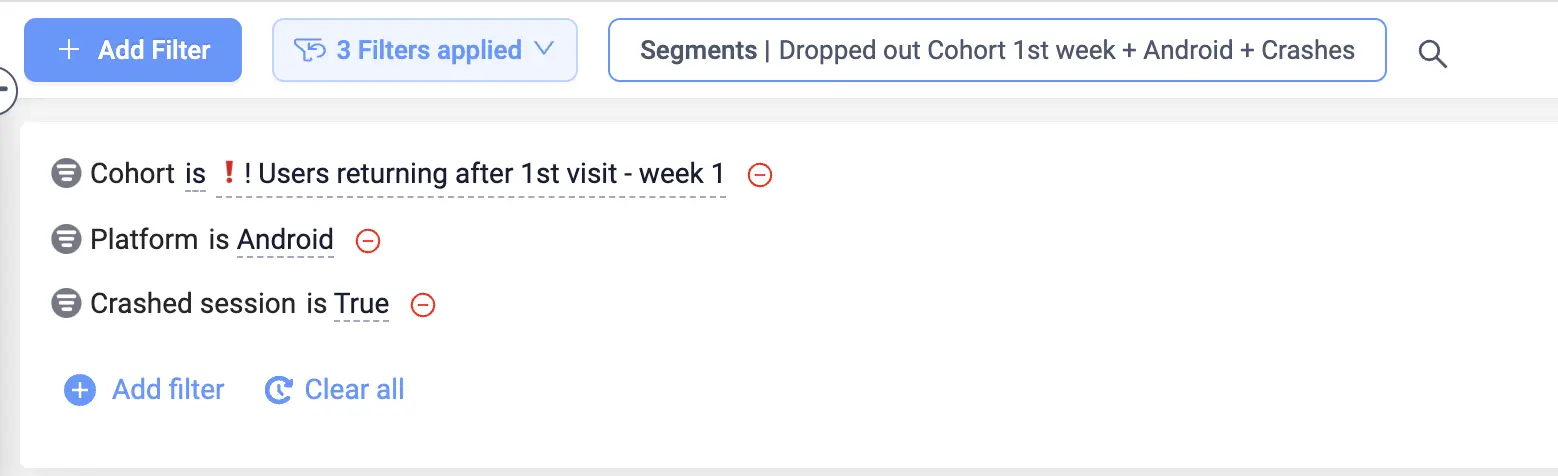
By saving and analyzing specific cohorts, deeper insights can be obtained to improve retention. For example, you can watch sessions of churned users, compare retained and dropped-out cohorts, save churned users, filter by cohorts in various features, and save cohorts for further analysis.
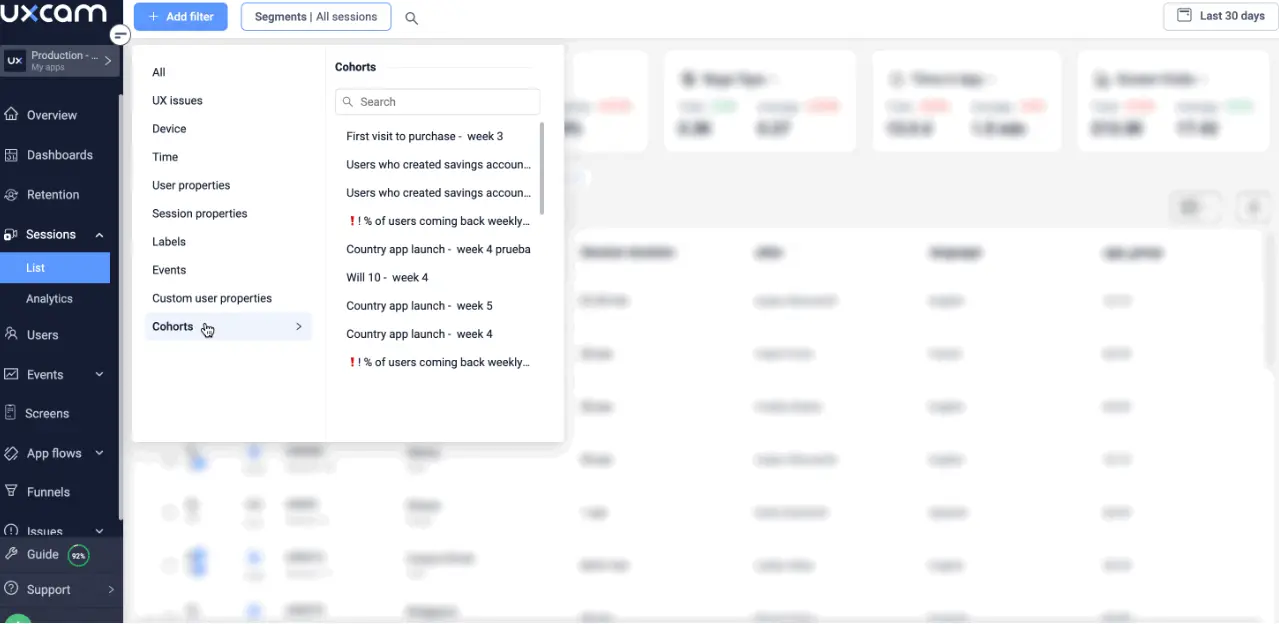
Step 5 - Use cohorts as filters
Cohorts can be applied to watch sessions, analyze funnels, create reports on dashboards, and track user paths in screen flows. Combining cohorts with other filters can provide more nuanced insights into specific user groups.
Cohorts can be saved and applied as filters to analyze user behavior across various features in UXCam.
Cohort filters can be used to watch sessions of specific user groups, analyze funnels like onboarding conversion, and create reports on dashboards.
Applying cohort filters on screen flow helps to understand user paths and guide churned users along successful journeys.
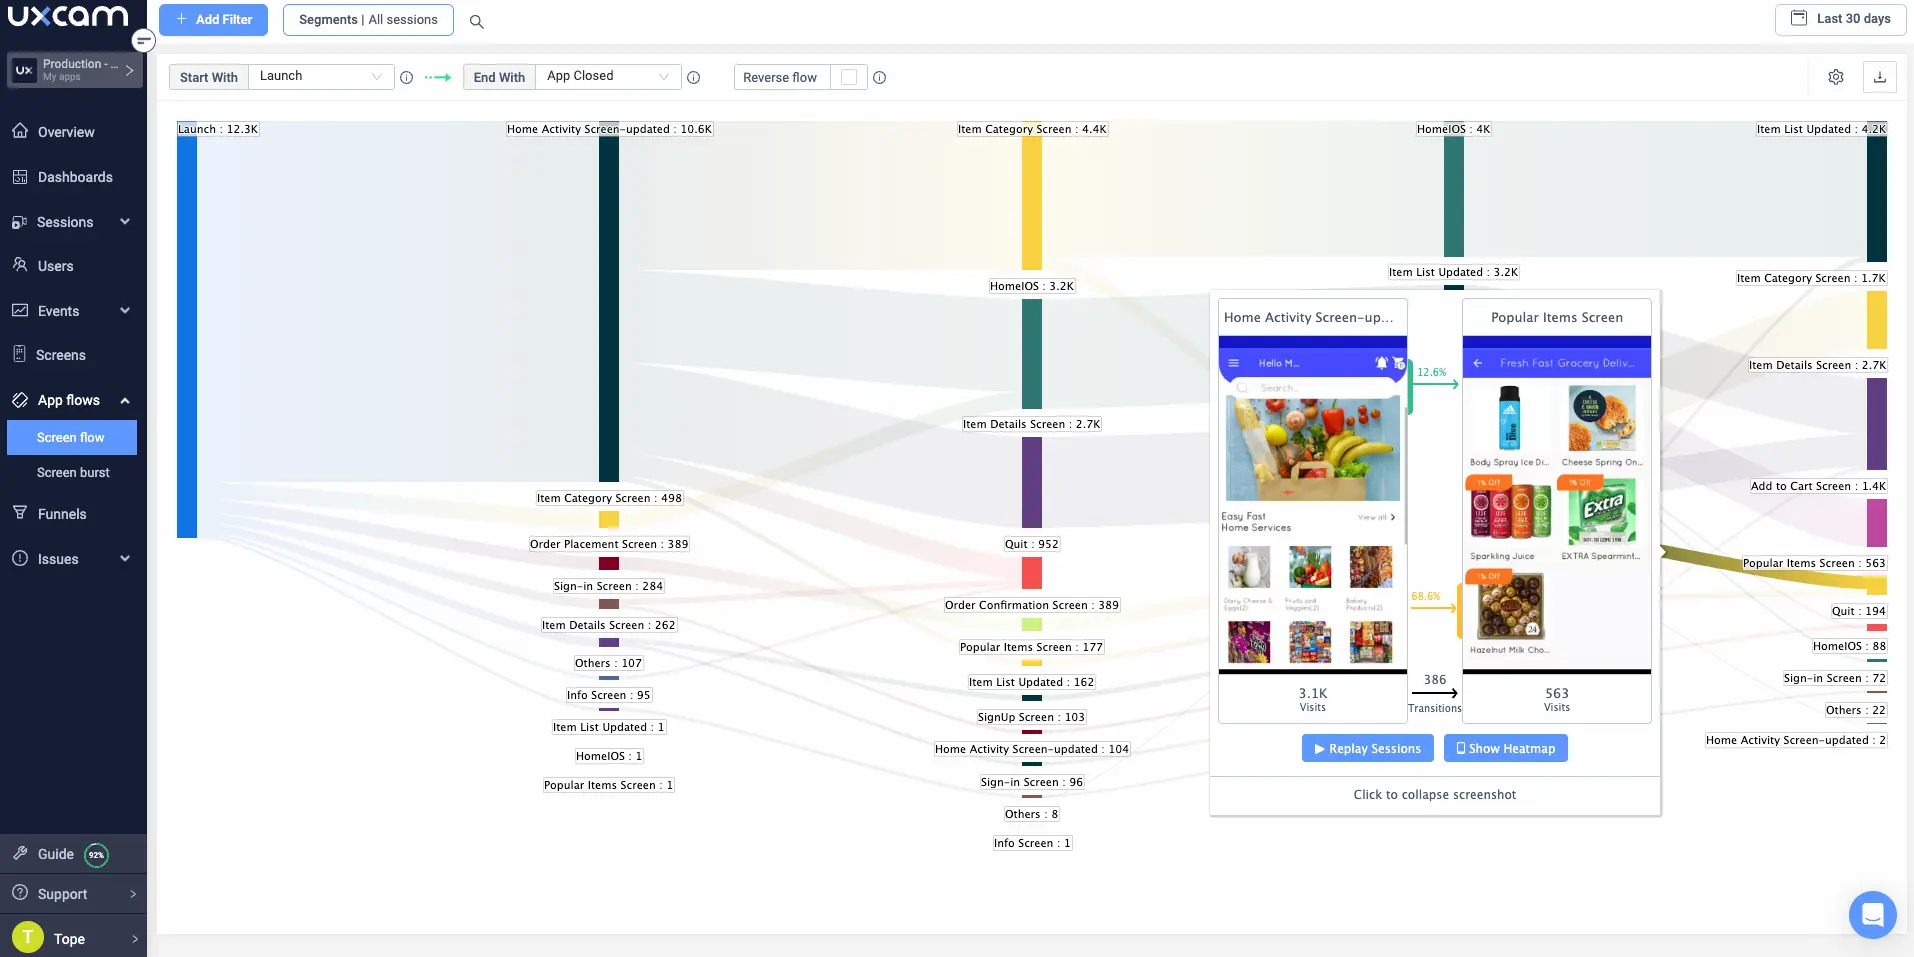
Combining different cohorts and filters allows for in-depth analysis and insights into specific user groups and their interactions with the app.


Conclusion
Analyzing cohort retention, especially with tools like UXCam, can be a game-changer for app developers. By using these insights, developers can make informed decisions, improve user experiences, and ultimately increase user retention rates.
Sign up for free and see how UXCam can transform your mobile app development process.
You might also be interested in these;
How to run an effective churn cohort analysis with UXCam
Behavioral cohort analysis - How to use them to improve UX
Top 9 mobile app retention strategies to enhance stickiness
AUTHOR
Tope Longe
Product Analytics Expert
Ardent technophile exploring the world of mobile app product management at UXCam.


Related articles


Conversion Analysis
React Native Crash Reporting + Best Tools and Techniques
Learn how to improve your mobile app's stability with effective React Native crash reporting. Explore the top techniques and tools for monitoring and managing...
Tope Longe
Product Analytics Expert


Conversion Analysis
Flutter Performance Monitoring - Best Tools and Techniques
In this article, we'll introduce you to the top Flutter performance monitoring tools and demonstrate how UXCam can help you monitor your app's performance with...
Tope Longe
Product Analytics Expert


Conversion Analysis
How to measure, analyze, and reduce app churn
All the user acquisition in the world won't matter if you've got a high churn rate on your app. If you want to know why users are uninstalling or unsubscribing, tools like screen flow, heatmaps, and screen recordings can get users loving — instead of leaving your...
Tope Longe
Product Analytics Expert