Mobile App Retention Guide - What, Why & Best Practices


If you want your mobile app to be successful, getting users to stick around is a must. Second chances aren’t exactly common, and when you’re competing for a limited market share, new users will start to dry up.
Focusing on boosting retention is the answer.
In this UXCam guide, we'll share a few tips on how to increase user retention, along with ways to track and calculate this important metric. So, if you're looking for ways to use UX design to increase your retention rates, read on.
What is mobile app retention?
Mobile app retention is a concept and a metric. It measures how many users come back to an app after their first launch or visit. This tells you how successful your onboarding process is and also gives you an indication of the overall user experience. You want to see a high retention rate, which speaks to the quality of your UX design and the engagement levels of your app.
To measure how well your app holds on to its users, you’ll need to calculate your retention rate for a given period (day, month, quarter, etc.).
How to calculate mobile app retention rate
You only need three pieces of information for this calculation:
Users at the start of a given period.
Users at the end of the given period.
Users gained over a given period.
The reasoning behind the first two pieces of information is probably obvious—but why do you need to know how many users were gained? The answer is that new users don’t count as retained users (yet), since they weren’t present for the entire period. And since they’re present in the end-of-period total, we need to remove them for an accurate calculation.
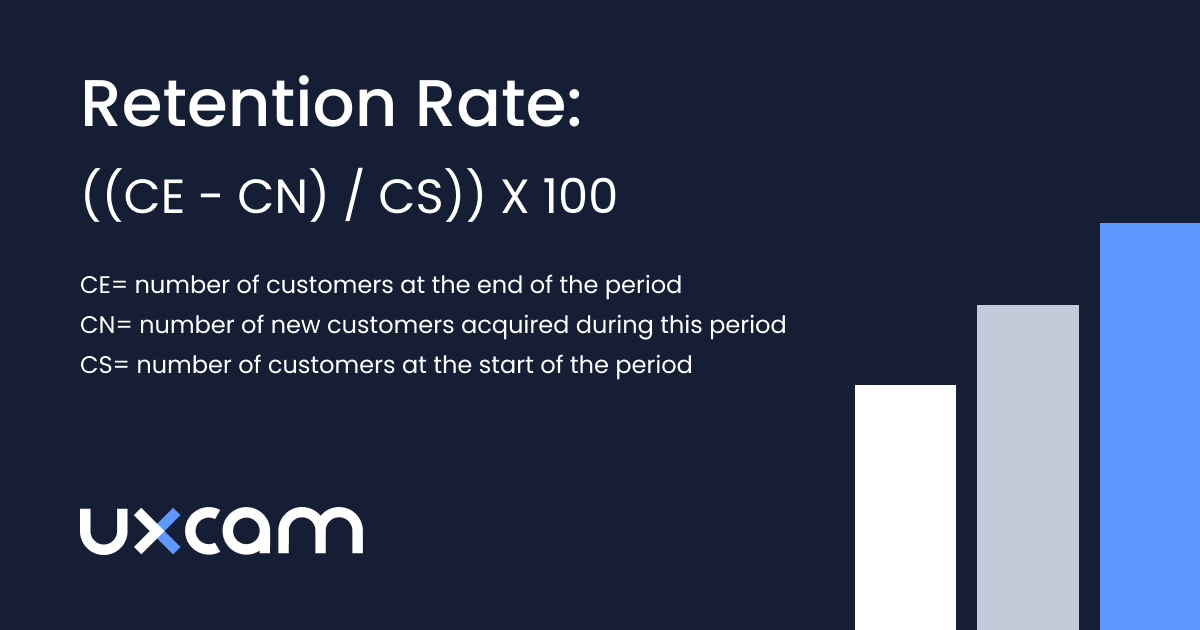
Here’s the formula:
Retention Rate = ((Users at End – Users Gained) / Users at Start) x 100%


Alternatively, you can use an analytics tool like UXCam to skip the manual calculations and track retention rates in real-time through intuitive dashboards.
Example mobile app retention rate calculations
If you started with 500 users and ended the month with 550 users and gained 50 users during that time, your retention rate would be:
((550-50)/500) x 100% = 100%
If you started with 1,000 users and ended the month with 850 users and gained 100 users during that time, your retention rate would be:
((850-100)/1000) x 100% = 75%
Why is it important to track mobile app user retention?
Identify churn patterns
One of the key metrics to measure user loyalty is retention, which shows how often users come back to your app or website after their first visit. A low retention rate means that users are not finding enough value or satisfaction from your product, and they're leaving for other alternatives.
The typical retention rate for the first month after sign-up is 45%, meaning that more than half of the users churn within a month. This rate goes up to 68% after three months, indicating a serious problem with user engagement and retention.
Helps in measuring growth and profitability
To gauge the performance of your mobile app, it is essential to examine metrics related to active users. These metrics include the number of people who use your app daily (DAU) or monthly basis (MAU). These figures provide insights into the stickiness of your app, indicating the level of user satisfaction and their tendency to return for repeated usage.
Some experts say that a good DAU/MAU ratio is between 10% and 20%, but only a few apps can get more than 50%. This ratio tells you how much your users need your app and how often they use it.
Top Mobile app retention metrics to track
As a mobile app product manager or product data analyst, mastering the art of retention is crucial for your app's success. Understanding and measuring user engagement through key metrics allows you to refine your strategies and ensure long-term growth. Here's how you can effectively navigate through the metrics and measurement of mobile app retention:
Retention Rate: This is the percentage of users who return to your app after their first visit. To calculate it, choose a specific time frame (e.g., 30 days) and divide the number of users who return within that period by the total number of users at the start. A higher retention rate indicates a more engaging and valuable app to your users.
![kpis to measure onboarding success - user retention rate]()

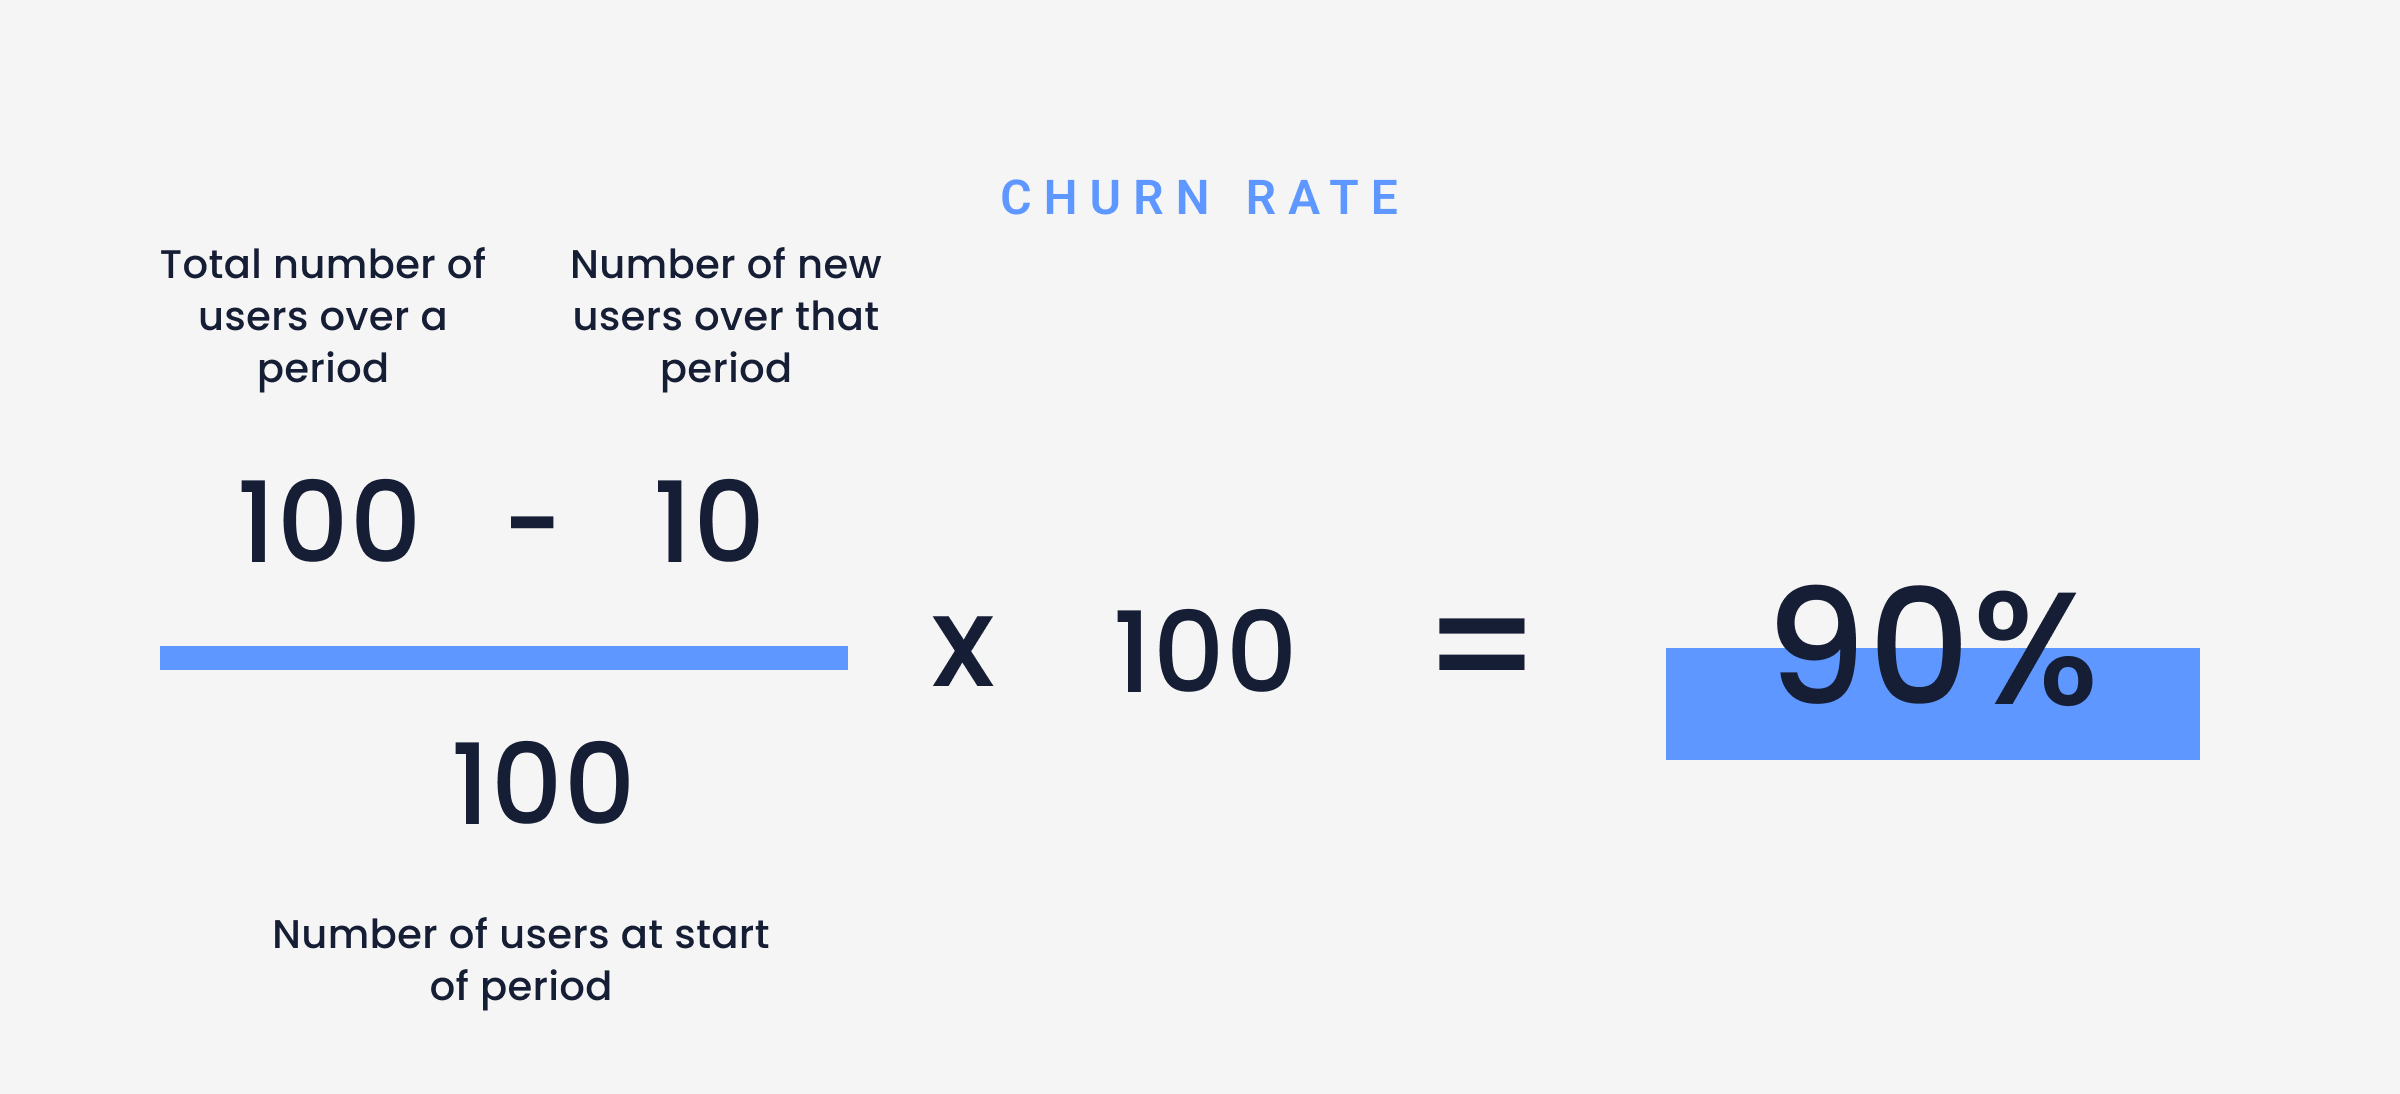
Churn Rate: The flip side of retention is churn - the percentage of users who stop using your app over a certain period. It's calculated by dividing the number of users who have left by the total number at the start of the period. Minimizing churn is as crucial as maximizing retention, as it signifies the health of your user base.
![Churn rate formular]()
Session Length: This metric tracks the average amount of time users spend in your app per session. Longer session lengths can indicate higher engagement and interest.
Session Frequency: How often users open your app within a certain timeframe reflects their engagement level. More frequent sessions suggest a more indispensable app.
User Lifetime Value (LTV): LTV is the total revenue you expect from a typical user over their lifetime of using your app. It helps you understand the long-term value of retaining users and guides your marketing and development budgets.
Daily Active Users (DAU) and Monthly Active Users (MAU): These metrics track the number of unique users who engage with your app daily and monthly, respectively. They provide a snapshot of your app's overall usage and health.
Stickiness Ratio: This is the ratio of DAU to MAU and provides insight into how often users return to your app. A higher stickiness ratio indicates a more engaging app with a loyal user base.
Net Promoter Score (NPS): Though not a direct retention metric, NPS measures user satisfaction and loyalty by asking users how likely they are to recommend your app to others. It can be a good predictor of retention and organic growth.
Revenue Per User: While not strictly a retention metric, tracking the revenue each user brings (through purchases, subscriptions, or ads) can help quantify the value of increasing retention rates.


By regularly monitoring these metrics, you can gain a comprehensive understanding of how users interact with your app, what drives them to stay, and where there might be opportunities for improvement
You can dive deeper into our comprehensive list of top mobile app analytics KPIs.
Understanding user behavior: Your key to retention
Keeping your users hooked isn't a guessing game, it's a data-driven science. To truly win their hearts (and thumbs), you need to understand their behavior like the back of your hand. Here's how UXCam helps you truly understand user behavior in your mobile app:
Finding user engagement patterns
Session Recordings: Watch users live, like a fly on the digital wall! See how they navigate, tap, and interact with your app. Identify friction points, confusing UI elements, or hidden gems they're missing.


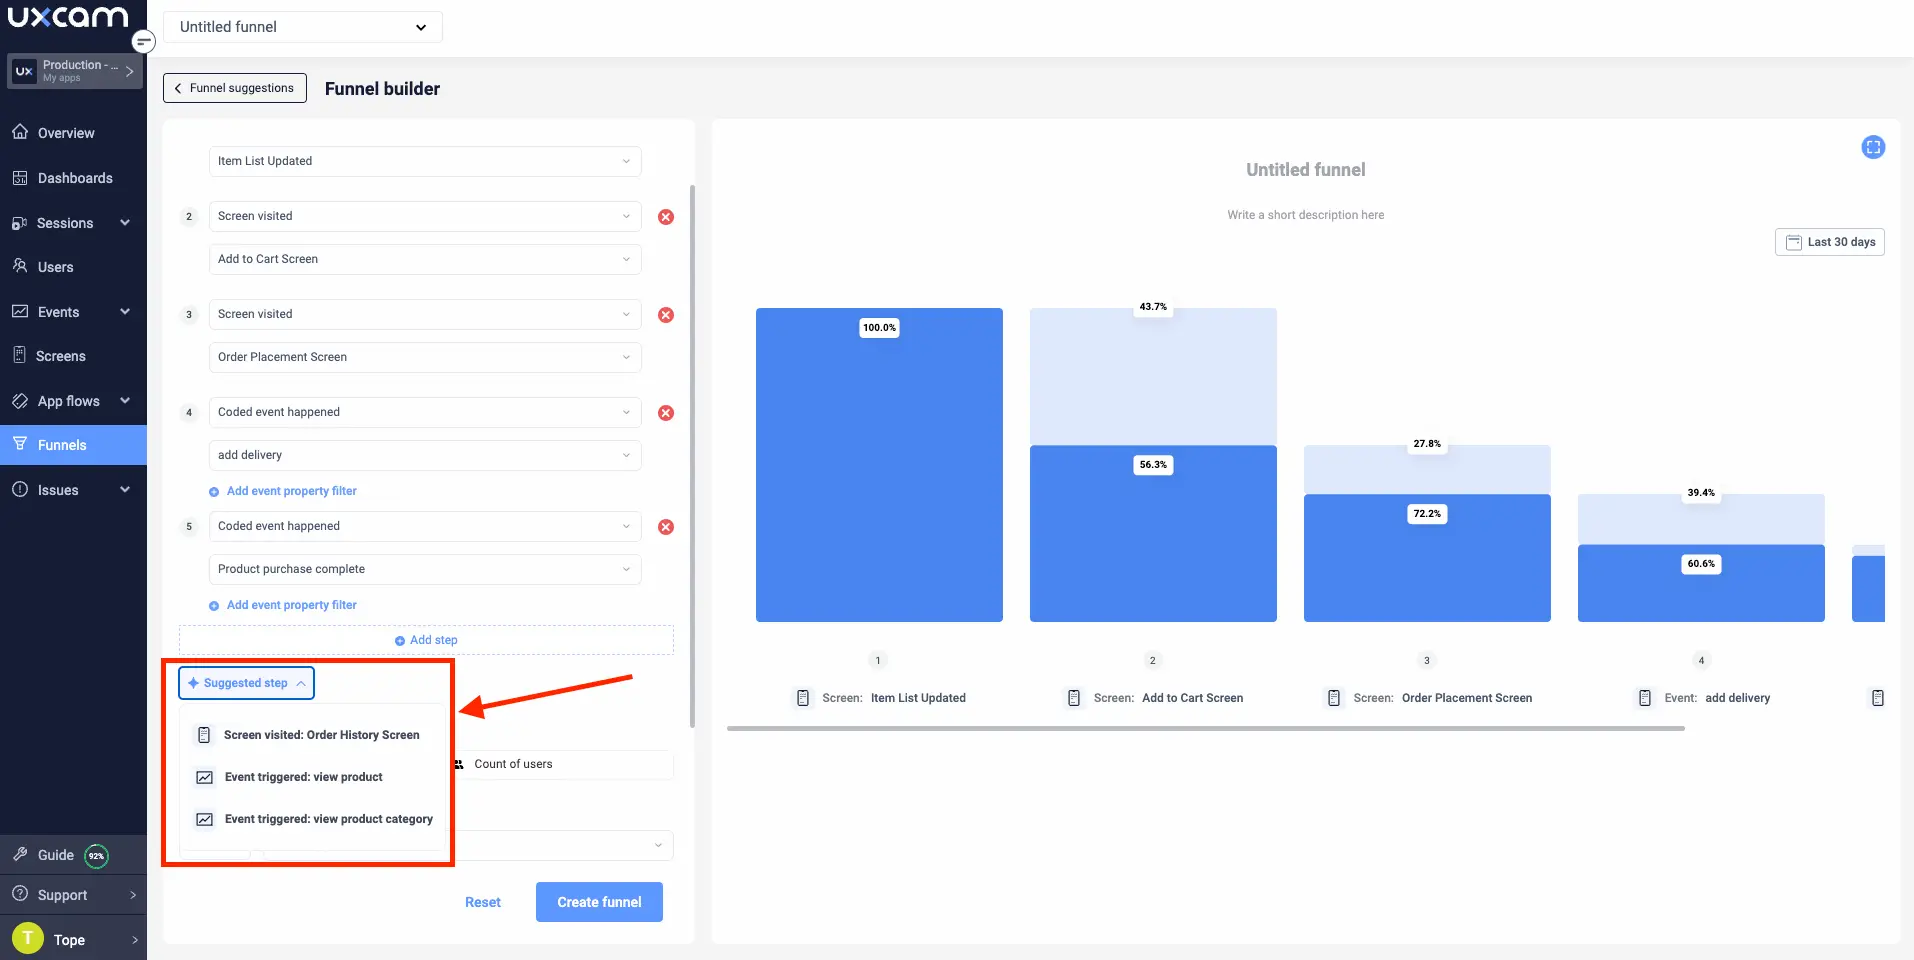
Funnel Analysis: Visualize key user journeys, like onboarding or checkout. See where drop-off happens, revealing roadblocks like overly complex signup forms or confusing payment steps.


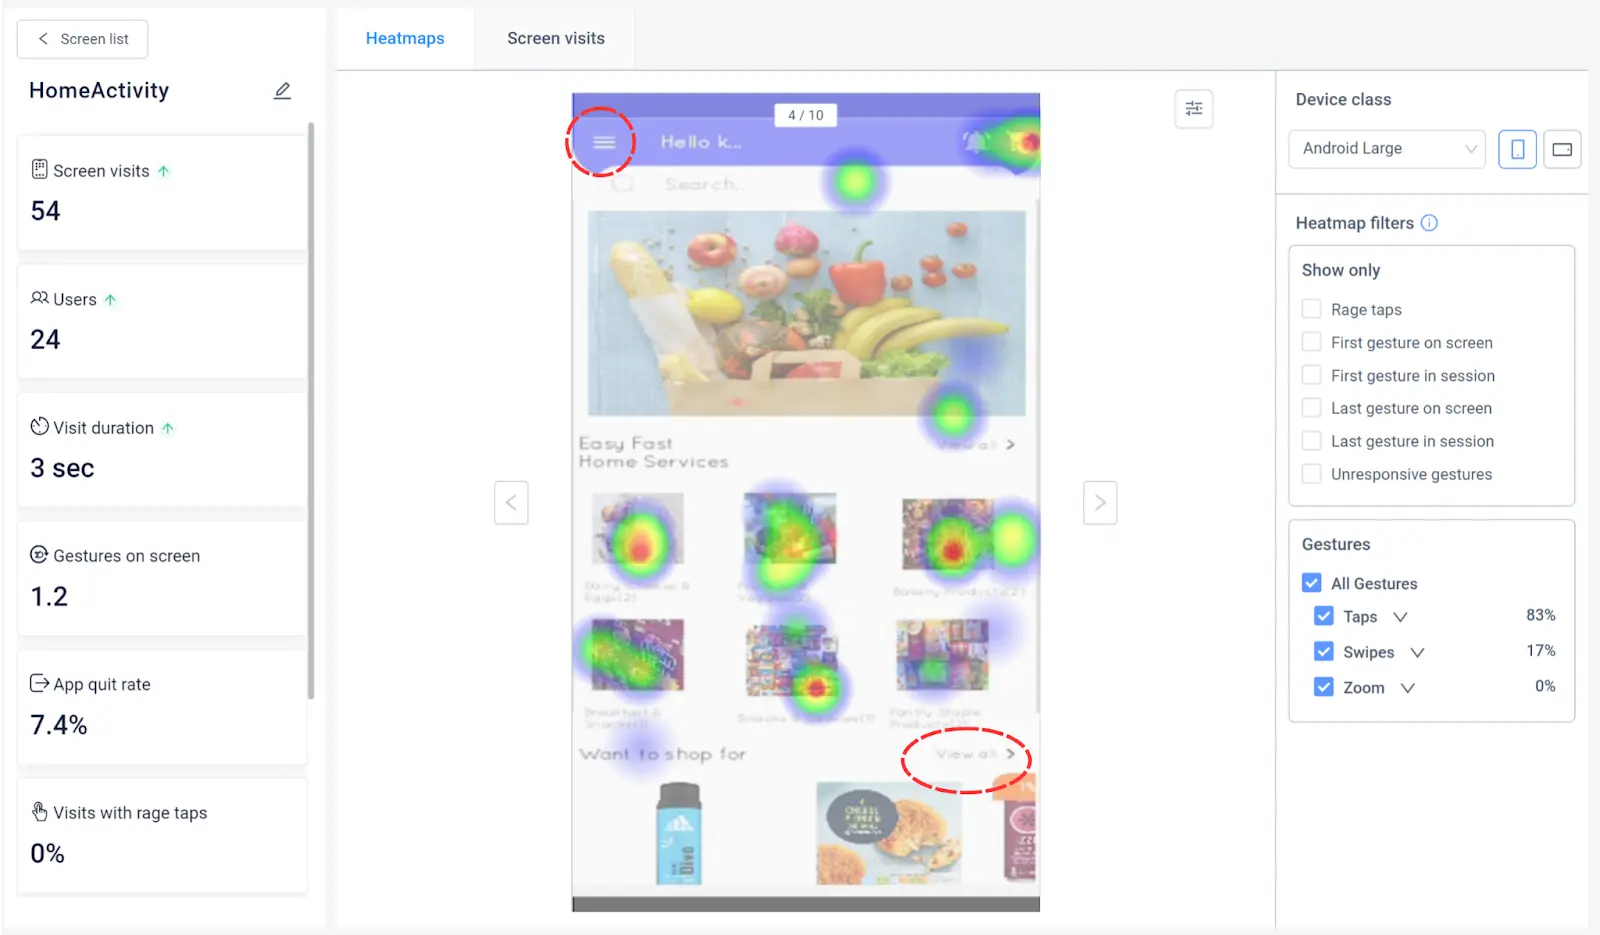
Heatmaps: See where users' attention gravitates. Are they ignoring your call to action? Heatmaps highlight areas of low engagement, guiding you to optimize UI and content placement.


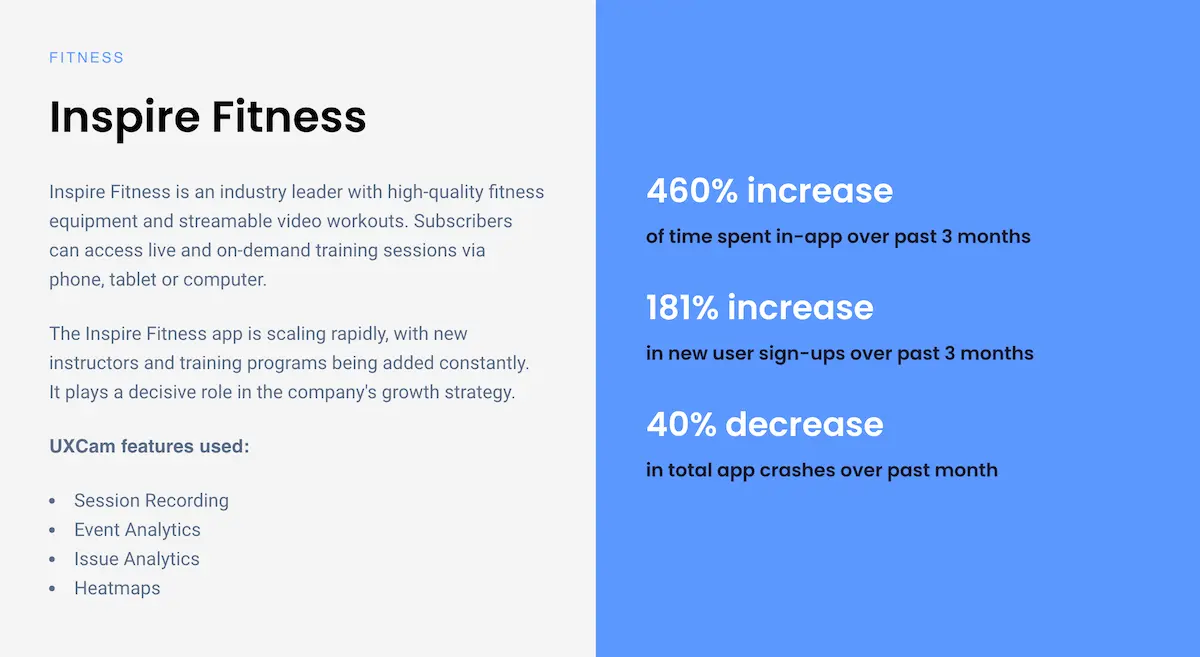
Let's explore a practical case study from Inspired Fitness
The problem: The Inspire Fitness team faced challenges in understanding user retention and engagement due to a lack of user behavior data, impacting their ability to make data-driven decisions about fitness content and app functionality.
The solution: They implemented UXCam to analyze quantitative and qualitative data through session recordings, event analytics, and heatmaps. This allowed for real-time feedback, understanding of user flow, and identification of highly engaged content and instructors.
UXCam features used: Session Recording, Event Analytics, Issue Analytics, and Heatmaps.
The results: Significant increases in key metrics: 181% in new user sign-ups, 415% in app sessions, and 460% in time spent in-app. Additionally, there was a 40% reduction in app crashes and a 56% decrease in rage taps, indicating enhanced user experience and app stability


Identifying key user segments
User Segmentation: Divide your user base into groups based on demographics, behavior, and engagement levels. This lets you tailor your app experience and retention strategies for different user types.


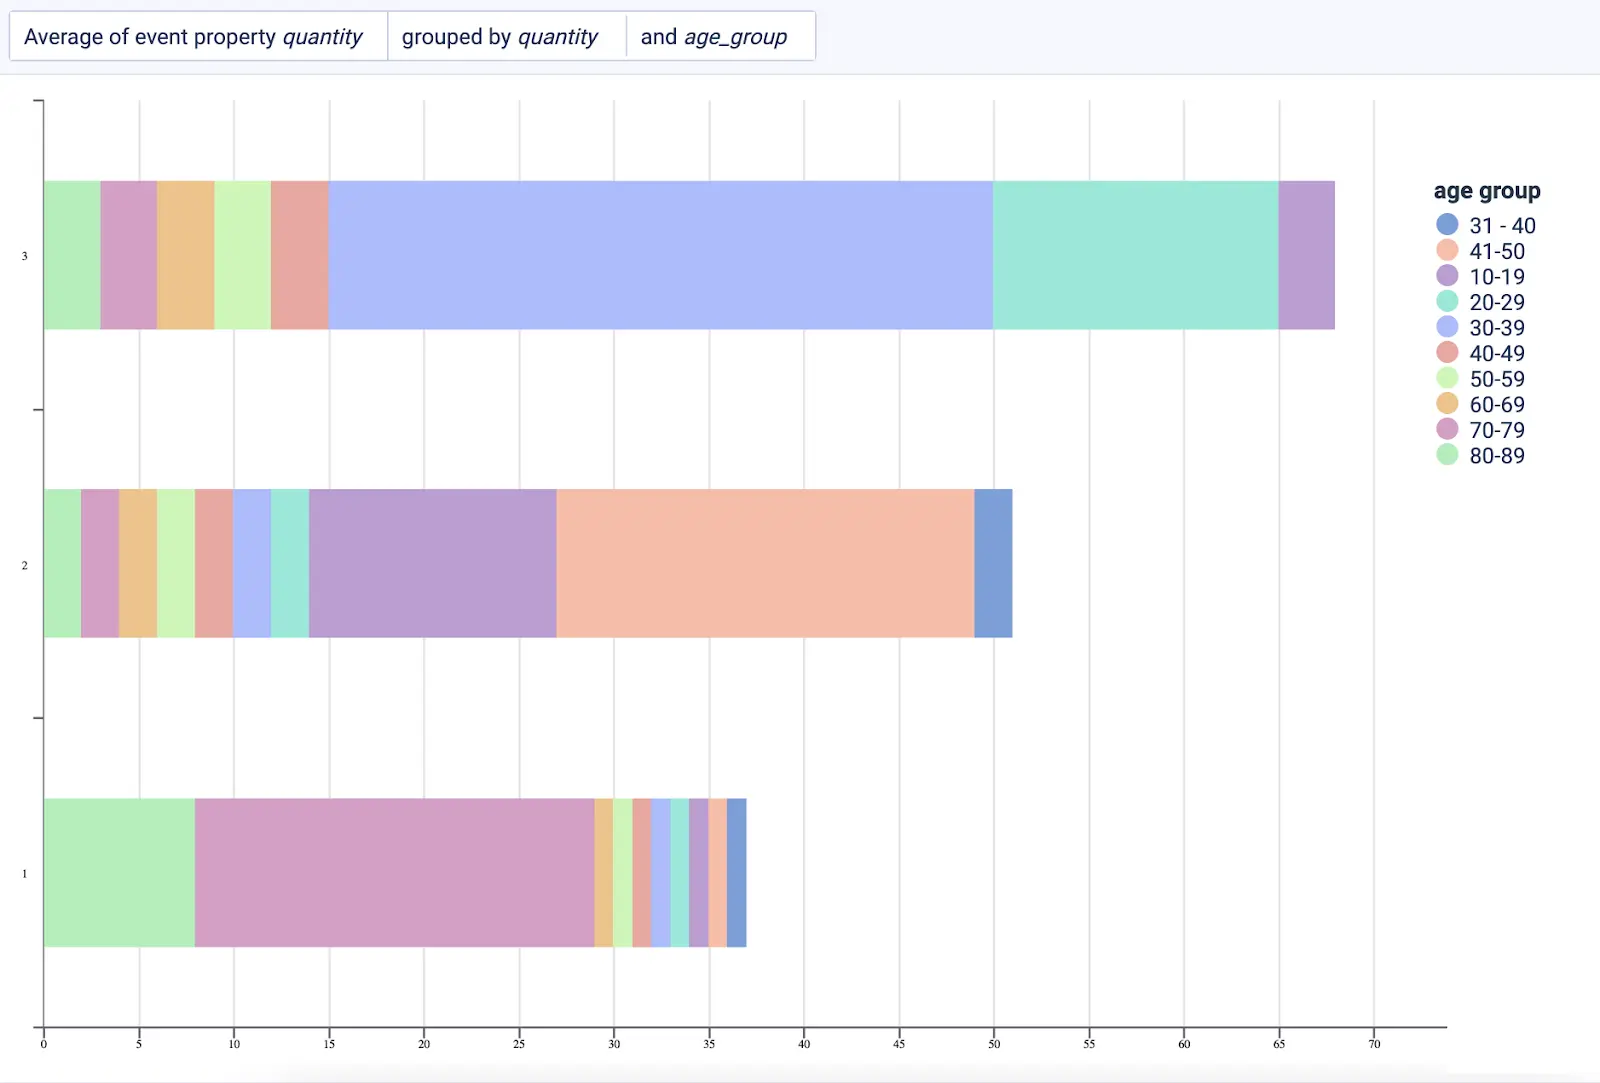
Cohort Analysis: Compare the behavior of different user cohorts over time. See which acquisition channels or feature updates drive higher retention, helping you focus on the strategies that work.


Let's take a look at another case study from Costa Coffee
The problem: Costa Coffee was losing thousands of customers weekly during the app registration process for their loyalty program, with a 30% drop-off rate between downloading the app and registering.
Solution: They utilized UXCam to identify and understand the main issues. By tracking custom events, adding funnels and retention cohorts analysis, they discovered that 15% of new users dropped off after entering invalid passwords and proposed design changes to rectify this.
UXCam features used: Cohort Analytics, Session Recording, Funnel Analytics, and Event Analytics.
The results: Identified the major issue causing sign-up drop-offs, leading to an overhaul of the registration process and forming a comprehensive strategy to increase loyalty program sign-ups and associated revenue
Behavioral Triggers and User Lifecycle
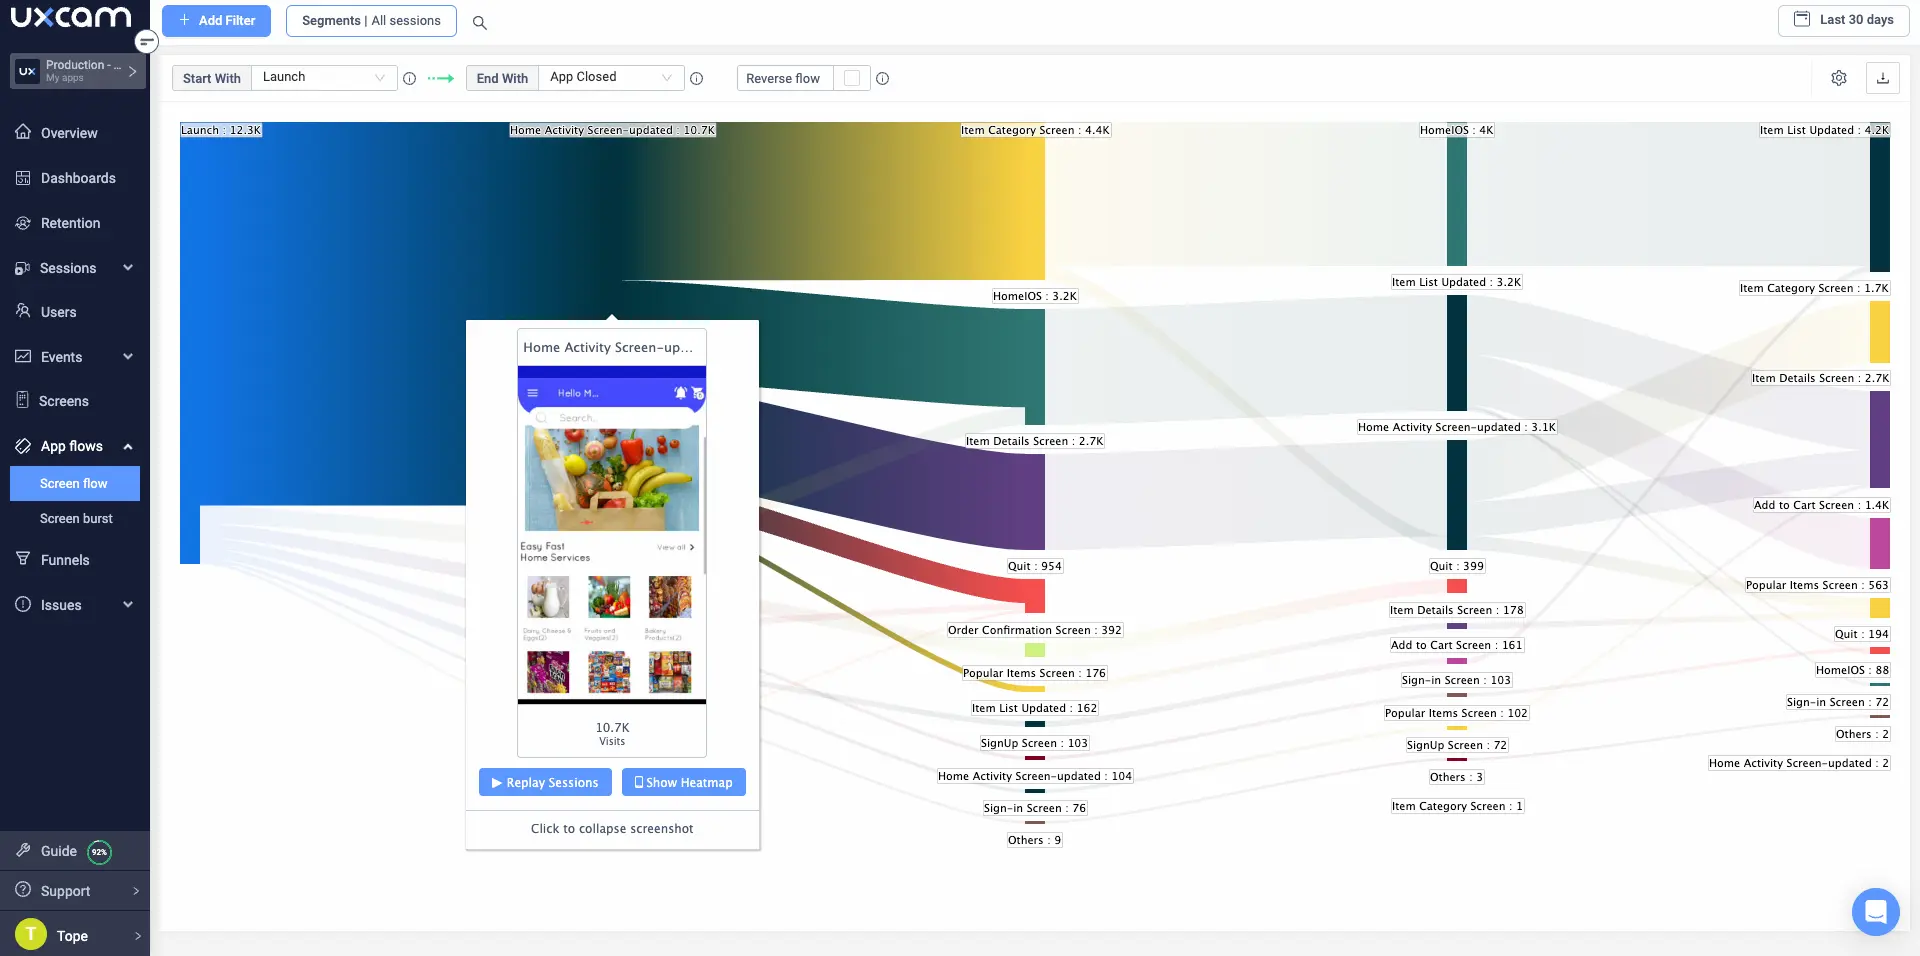
User Flows: Map out typical user journeys, highlighting key decision points and potential churn risks. This helps you identify opportunities for personalized interventions and re-engagement campaigns.


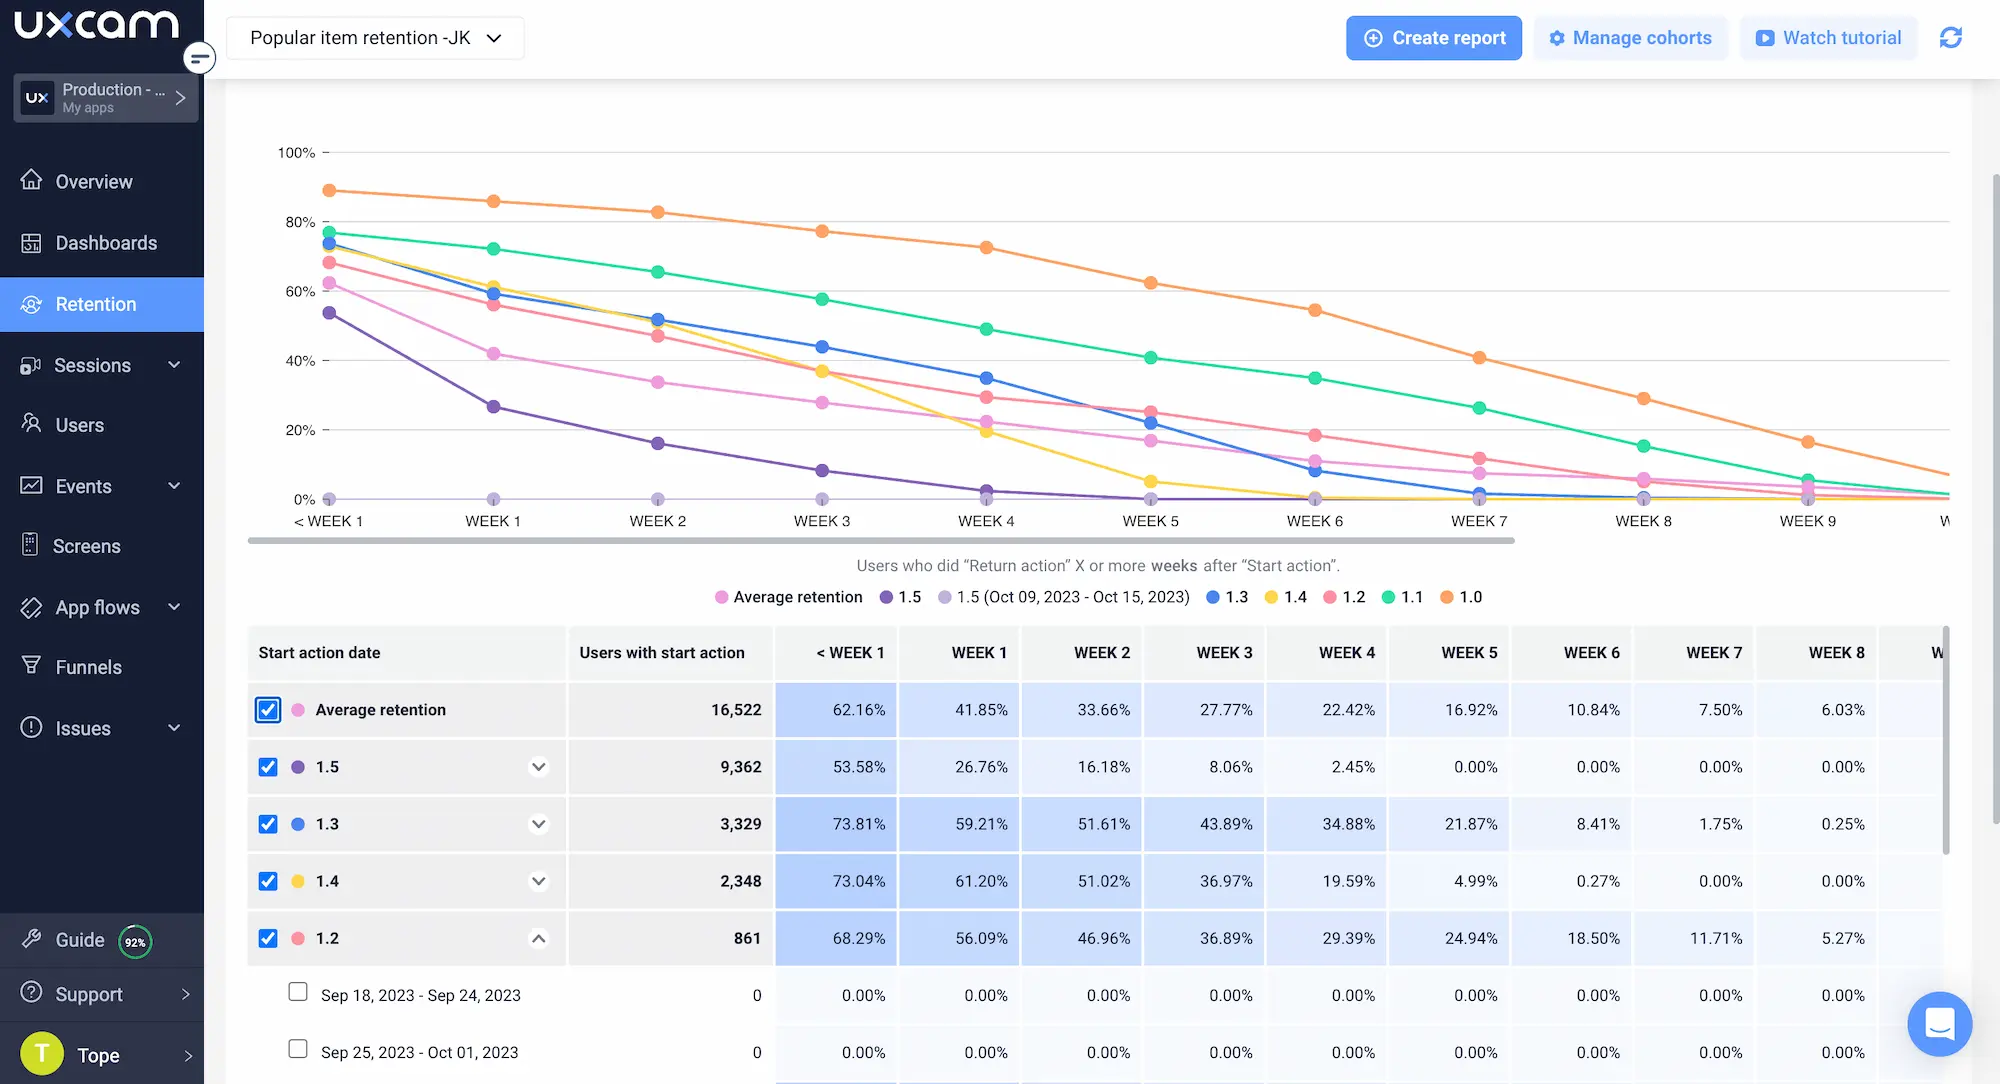
Retention Reports: Track key metrics like DAU, MAU, and churn rate. Monitor trends over time to see how your retention efforts are impacting user behavior.


You can also use retention reports alongside user segmentation to identify churn risks within specific groups. For example, if "Weekend Warriors" are showing signs of disengagement, you can craft targeted push notifications or offer them a special challenge to reignite their interest.
Conclusion
App retention is a super important metric for gauging your app's success and keeping your users happy. There are plenty of practical strategies to boost app retention, like making the onboarding process smooth, sending push notifications, adding some gamification elements, and so much more.
By using these strategies, you can decrease churn, enhance engagement, and drive revenue. If you're interested in learning more about improving app retention, sign up for free at UXCam. Gain access to powerful analytics and insights to better understand your users and provide an exceptional app experience.
Sign up for UXCam for free today and start improving your mobile app user retention.
You might also be interested in these;
Mobile app retention benchmarks by industries
6 Best customer retention software and tools for growth
Funnel analysis examples: How to improve app conversions
AUTHOR
Tope Longe
Product Analytics Expert
Ardent technophile exploring the world of mobile app product management at UXCam.


Related articles

Mobile app analytics
12 Mobile App Analytics Metrics That Actually Matter in 2026
Mobile app analytics metrics are the quantitative signals product teams use to measure performance, engagement, and...


Silvanus Alt, PhD
Founder & CEO | UXCam


Mobile app analytics
Mobile App Retention Benchmarks by Industry (2026)
Mobile app retention benchmarks for 2026, broken down by industry. Day-1, day-7, day-30 retention rates for fintech, ecommerce, social, gaming, and more,...
Silvanus Alt, PhD
Founder & CEO | UXCam


Mobile app analytics
Sentry vs Datadog: Features, Pricing, and Which One Fits Your Production Stack
Sentry vs Datadog compared head-to-head on features, pricing, and the production stacks each one...
Silvanus Alt, PhD
Founder & CEO | UXCam