7 Ways to increase FinTech app account activation

You’ve got the attention of potential users and piqued their interest about your fintech app. They may have even downloaded it and started poking around.
That’s a great start, but getting people to download your app is one thing. Getting them to actually sign-up and stick around to be a paying customer is another thing entirely.
This is especially true for banking or trading apps which present additional challenges to people activating their accounts due to the additional security required to connect bank accounts and verify users identities.
According to a survey by the app marketing business Liftoff, only around 20% of app installers really join up, and only about 11% of them actually activate their accounts.
Here are seven tips you can use to overcome those challenges and increase the percentage of people who activate their accounts on your fintech app.
What is account activation?
Account activation is when your users complete a specific action that you’ve identified as key activation points - actions where the user starts experiencing value from your product.
For consumer-facing apps in the fintech space, activation points are events such as connecting their bank accounts, applying for a loan, or performing a financial transaction. For B2B focused Fintechs, usually subscription products, that point could be when your users create a paid subscription.
Chances are you have multiple activation points for your app. There are the initial points that show someone has an interest in using your product, such as described above. As well as additional activation points that show when users adopt a new feature, unlock functionality that they didn’t have access to before, or when they move from free to a paid plan.
Ultimately, these activation points lead users to discover additional value from your app, and as leading indicators, you’ll need to keep close tabs on your app's activation rate. To collect the data to measure this KPI, you need to define what activities make up an “aha moment.” You can identify those activation points by figuring out what your most successful user cohort accomplished before they subscribed.
This measure gives you a sign of how well your onboarding process directs users to perform the activation event.


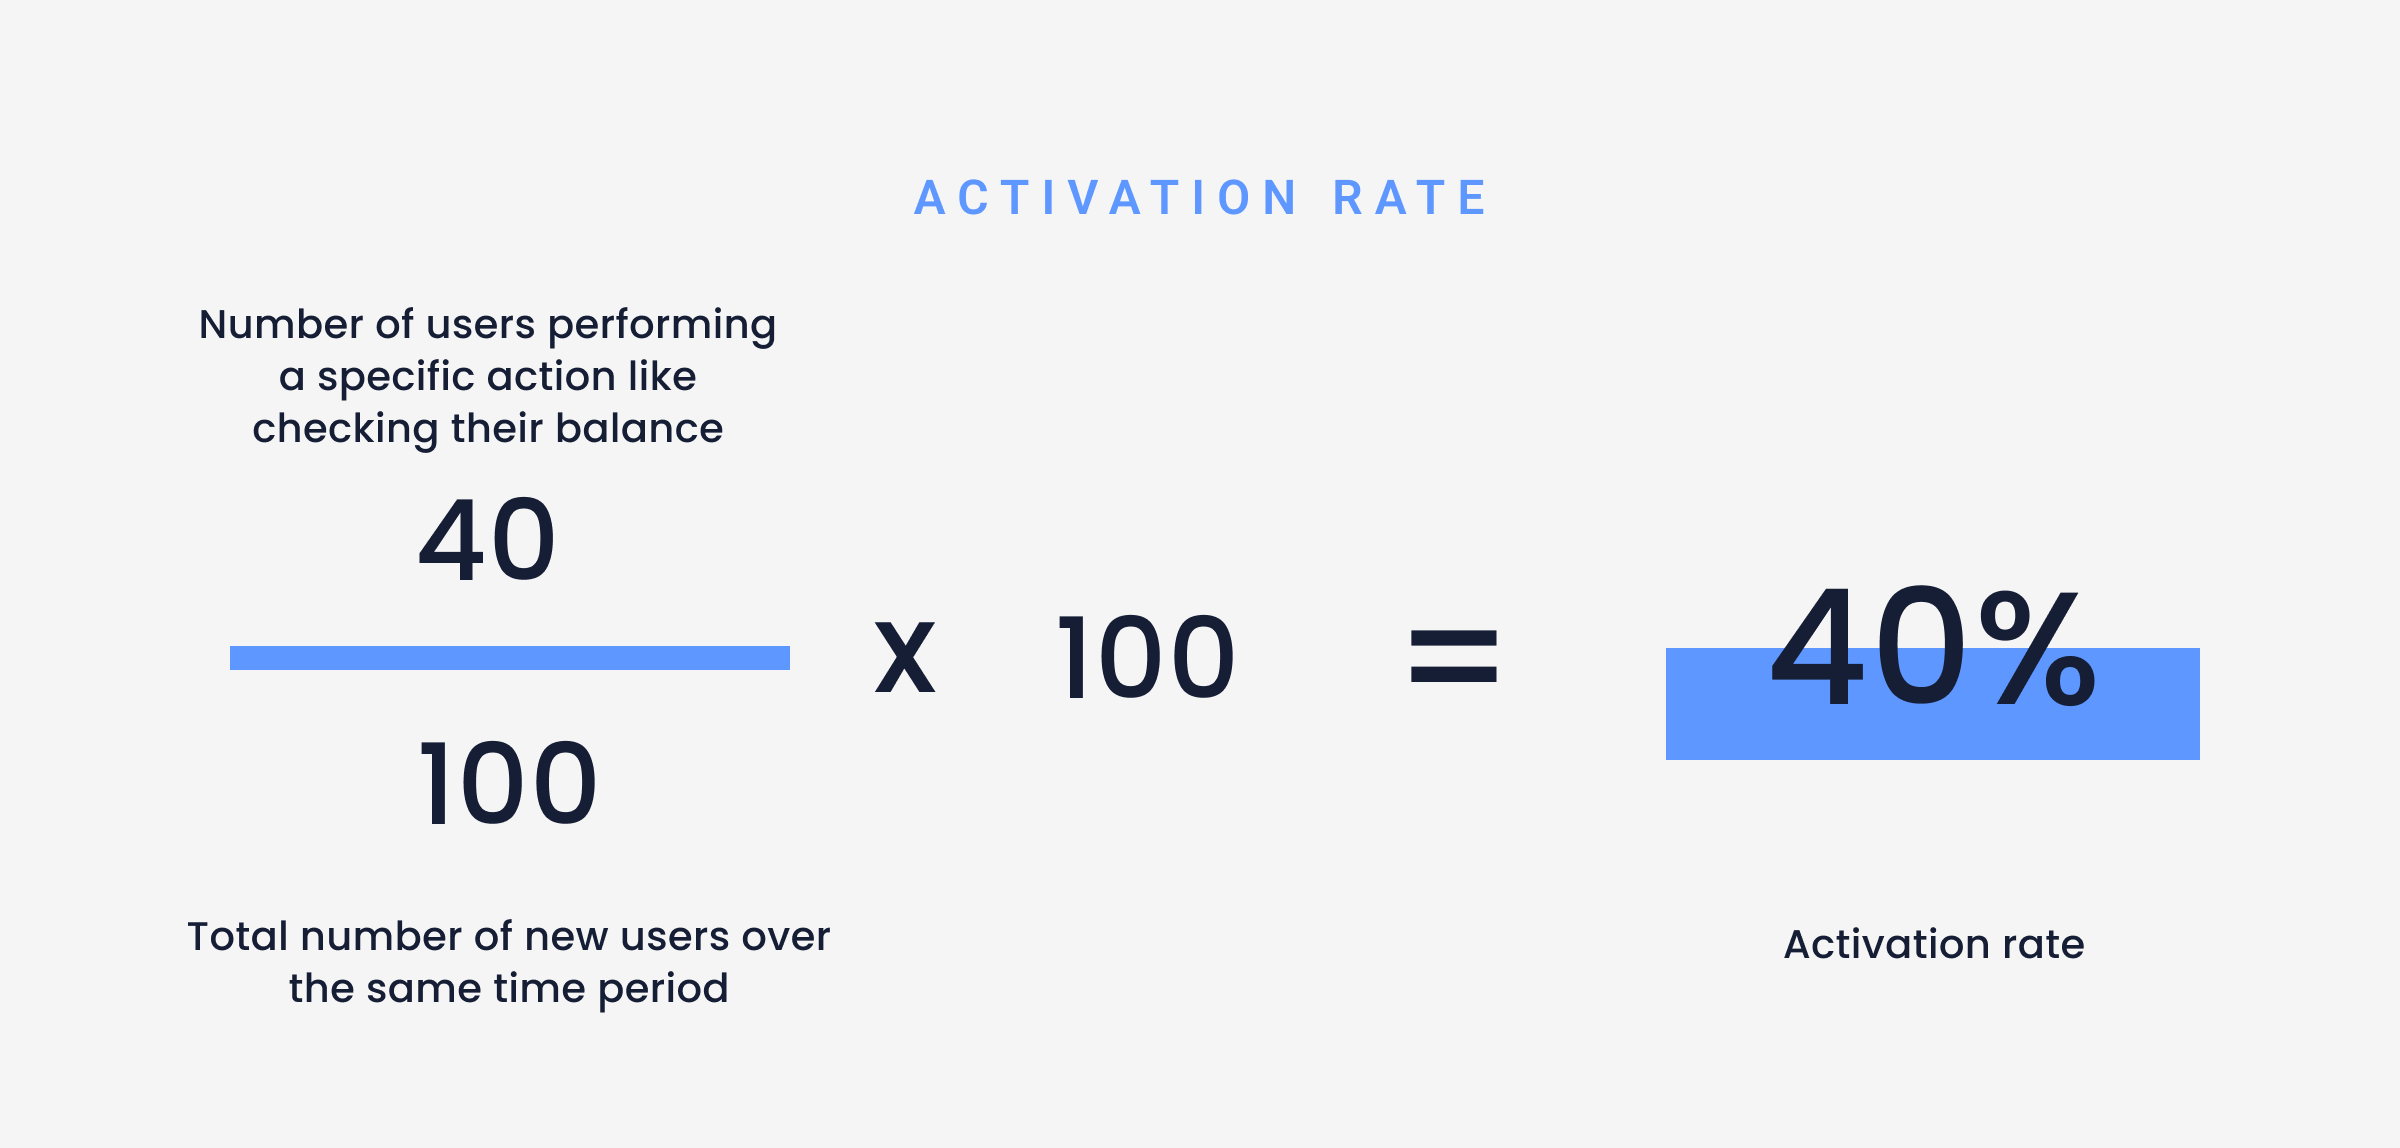
Formula to measure activation rates
For a more in-depth look into more KPIs to measure specifically for onboarding, read our dedicated article 12 KPIs to measure and improve your FinTech app onboarding strategy
Simplify the KYC process
The easier and quicker the sign-up process, the more likely users are to complete it and activate their account. During the KYC process, collect only the information you truly need to allow people to use your app and make it easy for them to use it securely.
It’s valuable to see the actions and behaviors of your users during the onboarding process, and just afterwards. If your users don’t immediately start using your product after they complete the signup process you may have a friction point that needs improvement.
Track each stage of the KYC process with funnels and session recordings in UXCam to identify common pain points and hypothesize the cause of onboarding abandonment.
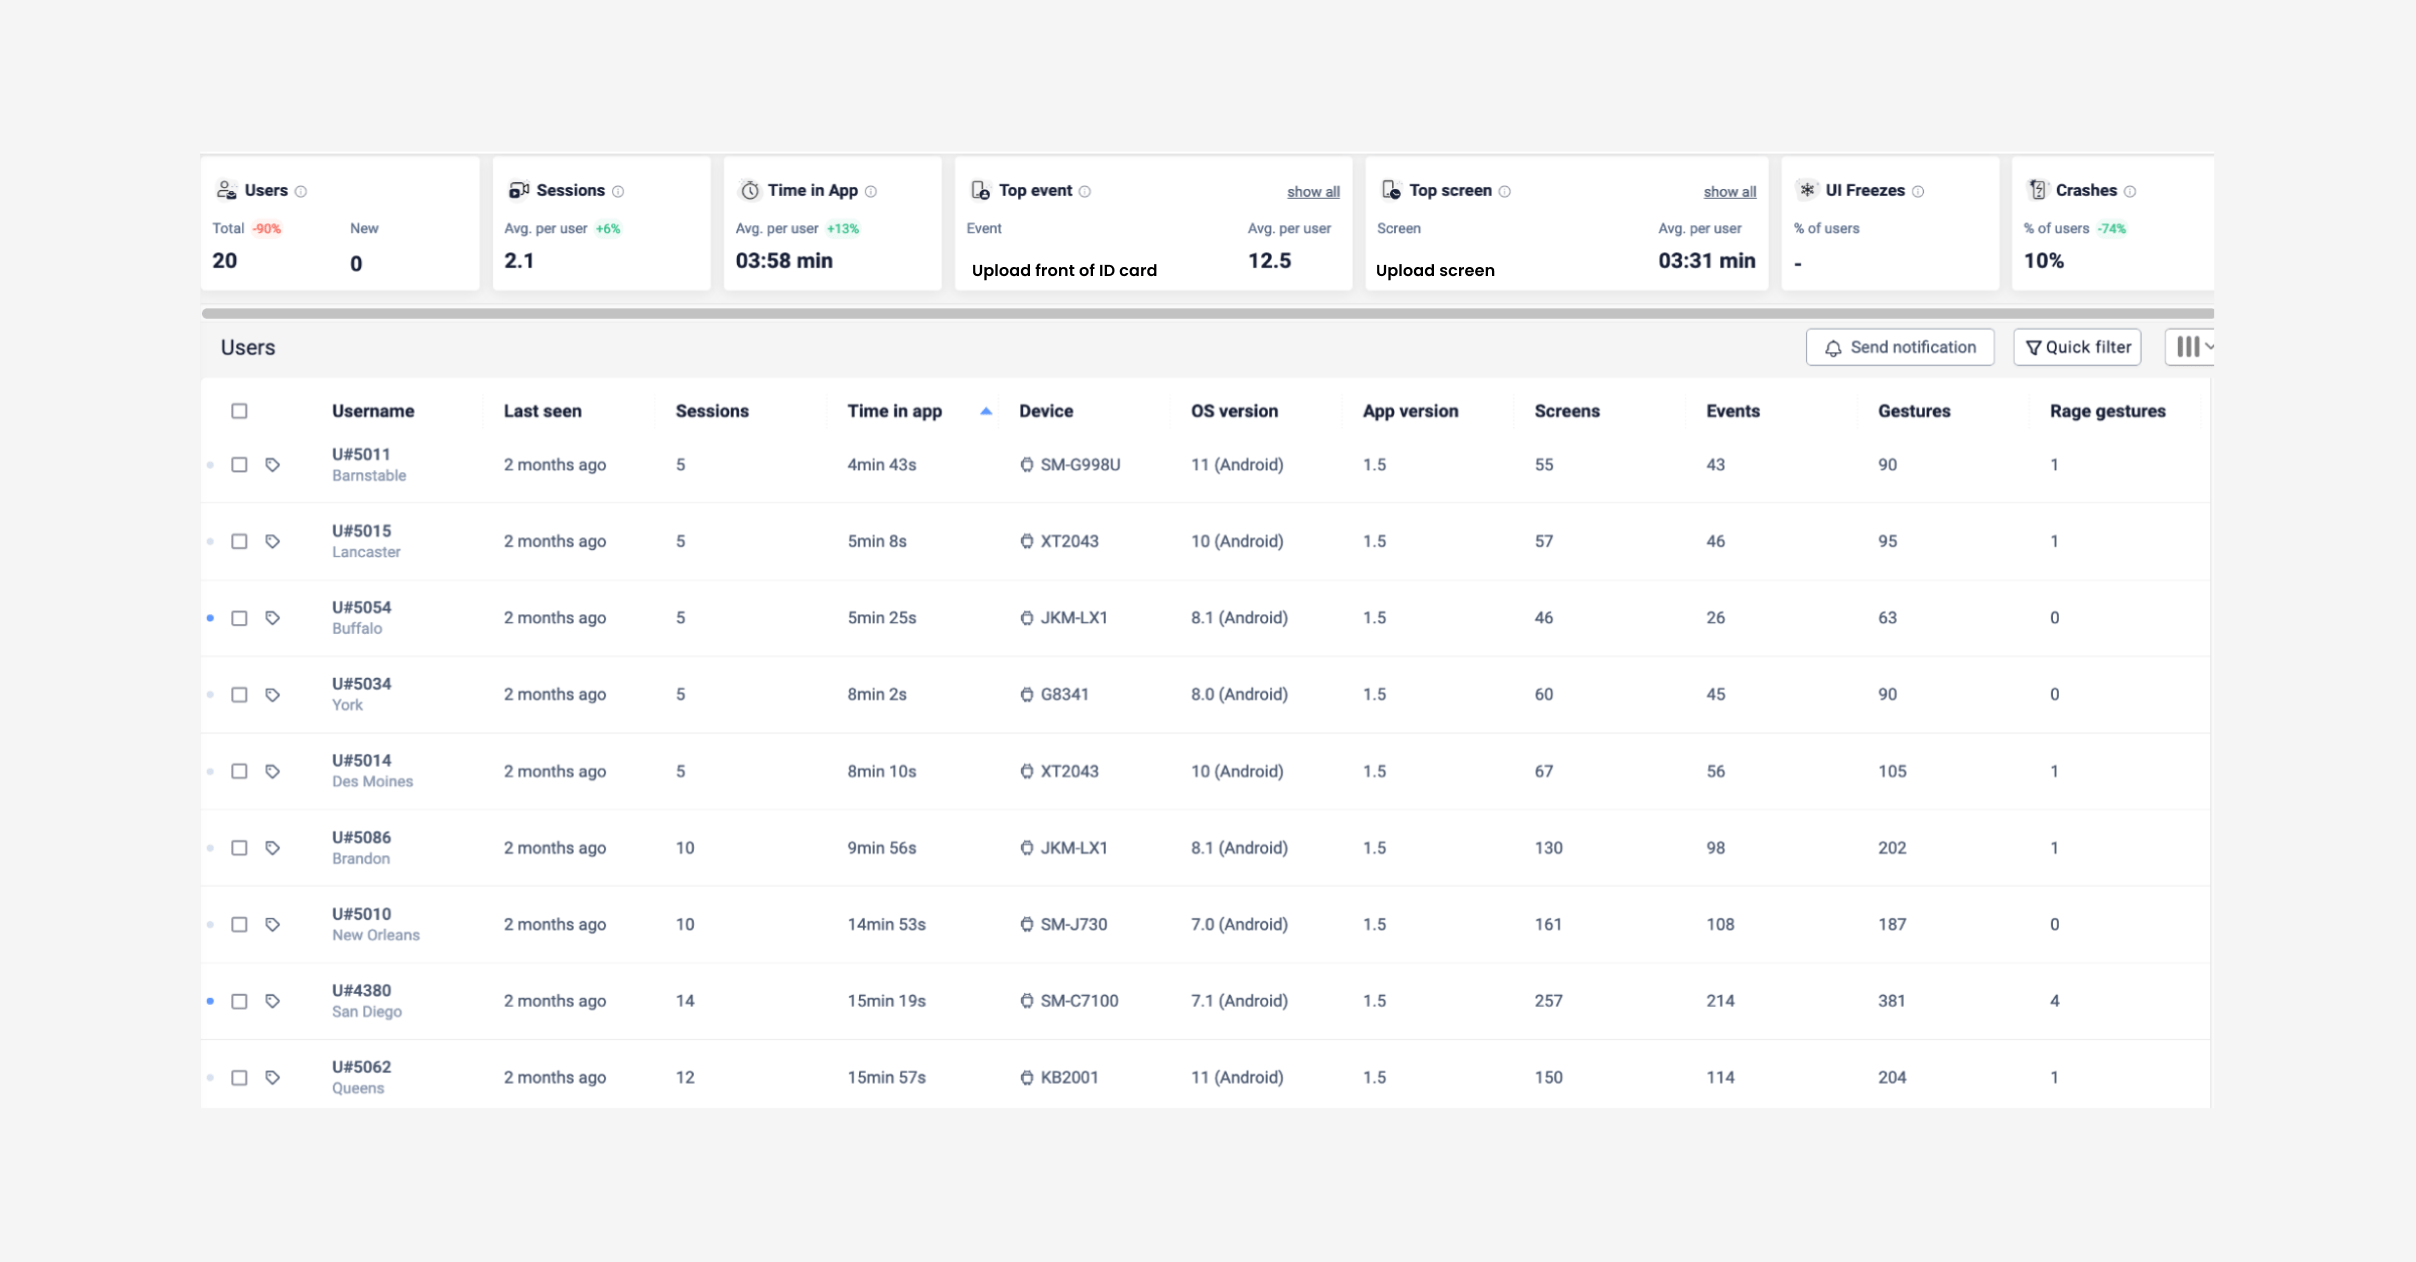
Analyzing your onboarding screens will show you how many users are dropping off and at which stages. Set up a customizable dashboard for your KYC onboarding process to access the data easily and monitor it over time.
UXCam automatically captures screen names, cutting out the time it takes to manually set up events before creating a funnel. With each KYC screen name added, for example, upload ID card, email address verification, and completed KYC process, you can begin to analyze the data as it comes in.
You can also use funnels to track error events that you’re interested in measuring, like upload errors, or ID scanning issues.


Caption: Example of an onboarding flow funnel in UXCam
By clicking through the red column of the funnel (see example above) you’ll be able to pull up all the sessions from those users who dropped off to analyze the behaviors and hypothesize the reasons and possible solutions.


Example of sessions list for uploads in UXCam
You can also filter those users who dropped off during onboarding further for sessions including interactions such as:
Sessions can also be filtered by device data so you can look from different dimensions at how your KYC process performs across different platforms:
Screen size
App version
Android or iOS
Saving these users in a segment will save time when coming back to reevaluate your KYC process later, and keep track of the progress of your updates over time.
For a more detailed, specific look into the KYC process, read through our article: Reduce KYC abandonment in 3 steps
Optimize the onboarding process
Fintech apps require information such as addresses, social security numbers, and bank account information in order to perform financial transactions accurately and securely. This need for extra data drives a natural tension between small amounts of data and the proper data to provide a viable solution.
In order to walk that delicate balance, you need to streamline your onboarding flow as much as possible.
Diana Stepanova, Operations Director at Monitask, a remote business productivity toolkit, suggests using a few ways to make onboarding “frictionless.” Besides minimizing the number of fields and steps necessary for users to complete the sign-up process, she suggested using pre-fill options whenever possible, and ensuring a smooth customer experience on both desktop and mobile devices. After Diana’s team implemented this tactic, they “saw a dramatic increase in terms of the number of user account activations.”
Another way to make the onboarding process easier for users to complete is by including a progress bar so they can visually see exactly how many steps they still have to go, and can estimate when they’ll be finished. This encourages more engagement and helps with activation rates.
Measuring the success of the onboarding process
Measuring and tracking the changes to your onboarding process will increase the likelihood that users will activate their accounts and get to the end of the process because you’ll have a better understanding of their frustrations and expectations.
By taking a look at each onboarding screen in heatmaps, under Screens in UXCam, you’ll be able to measure:
Unresponsive taps, rage gestures
First and last touches
By filtering heatmaps for frustration indicators like rage taps and last touches, you’ll be able to see exactly where and what users are struggling with during the onboarding process.


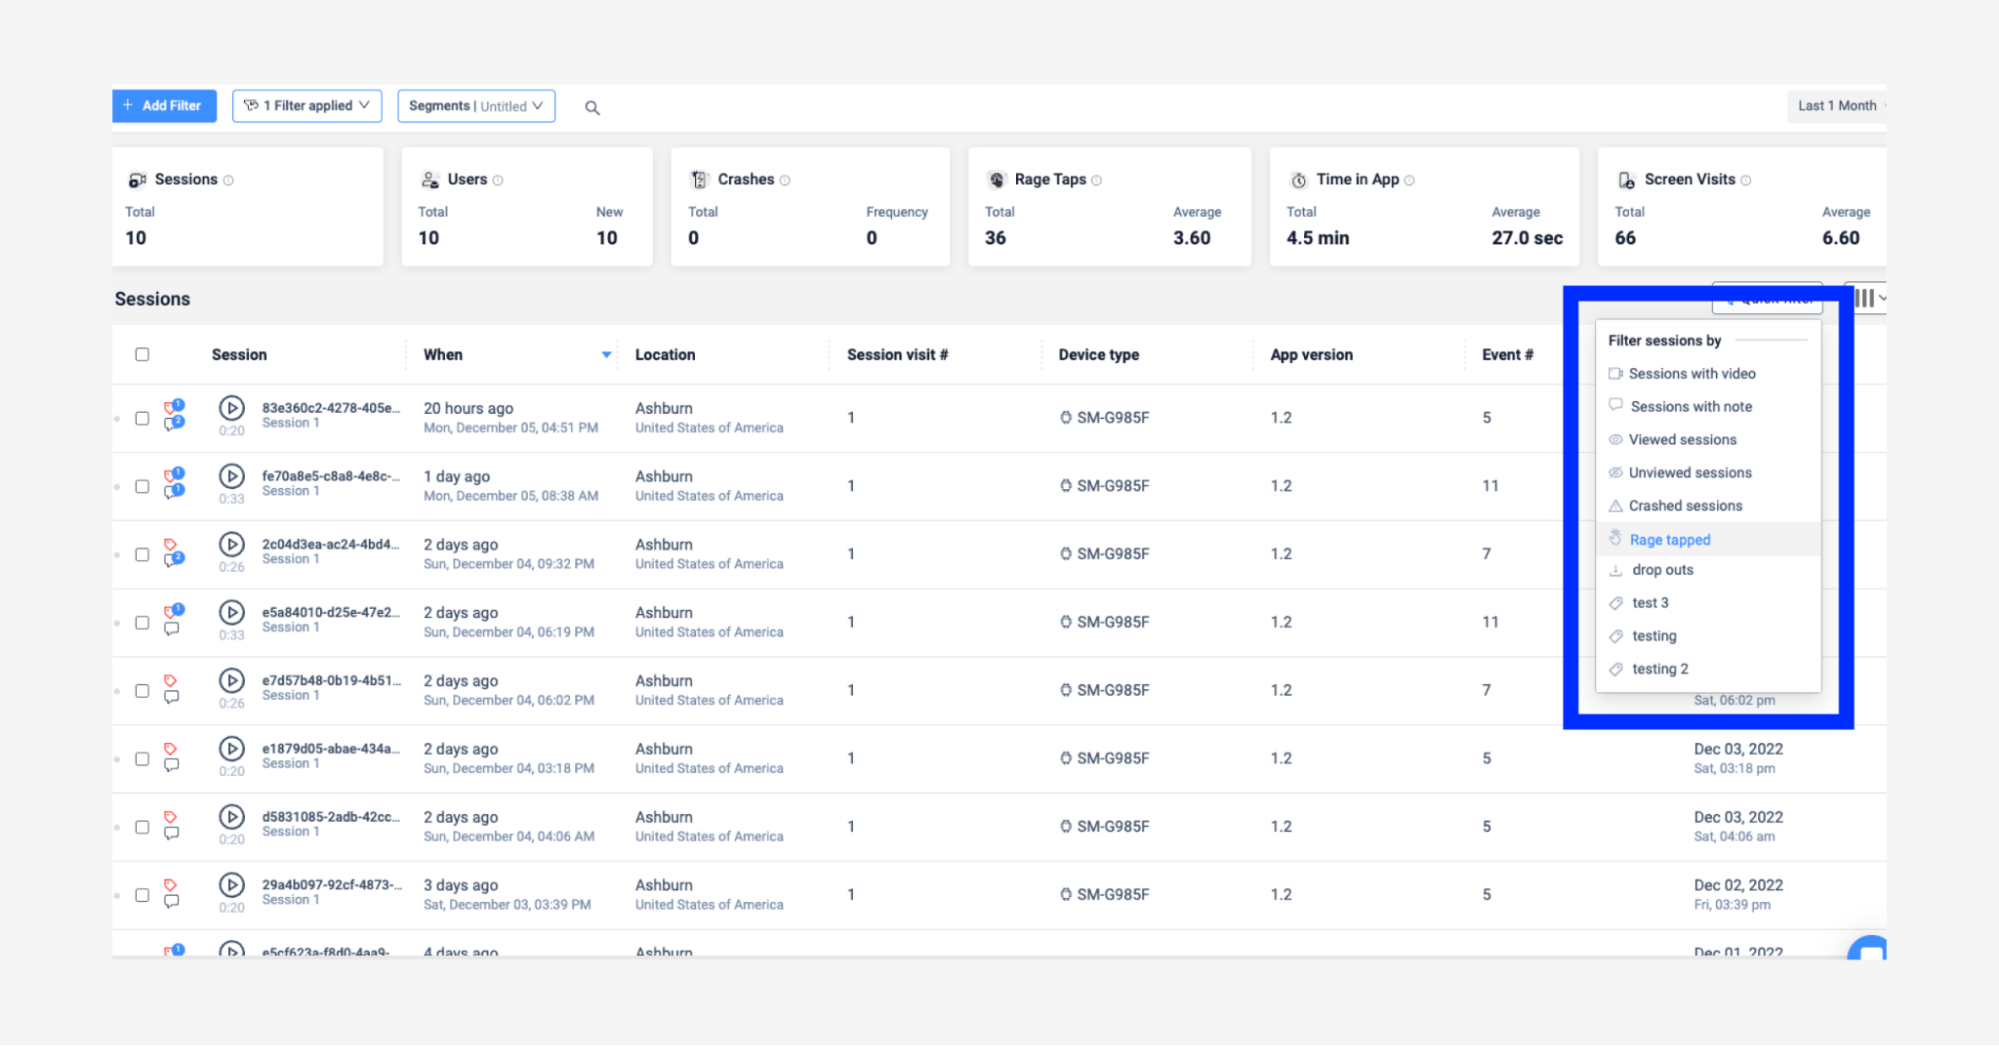
Example of session filters in UXCam
Some issues throughout your onboarding process that you can uncover with heatmaps are:
Unresponsive or broken elements
Identify user frustrations in the onboarding UI
Which screens in your onboarding process have the highest quit rate


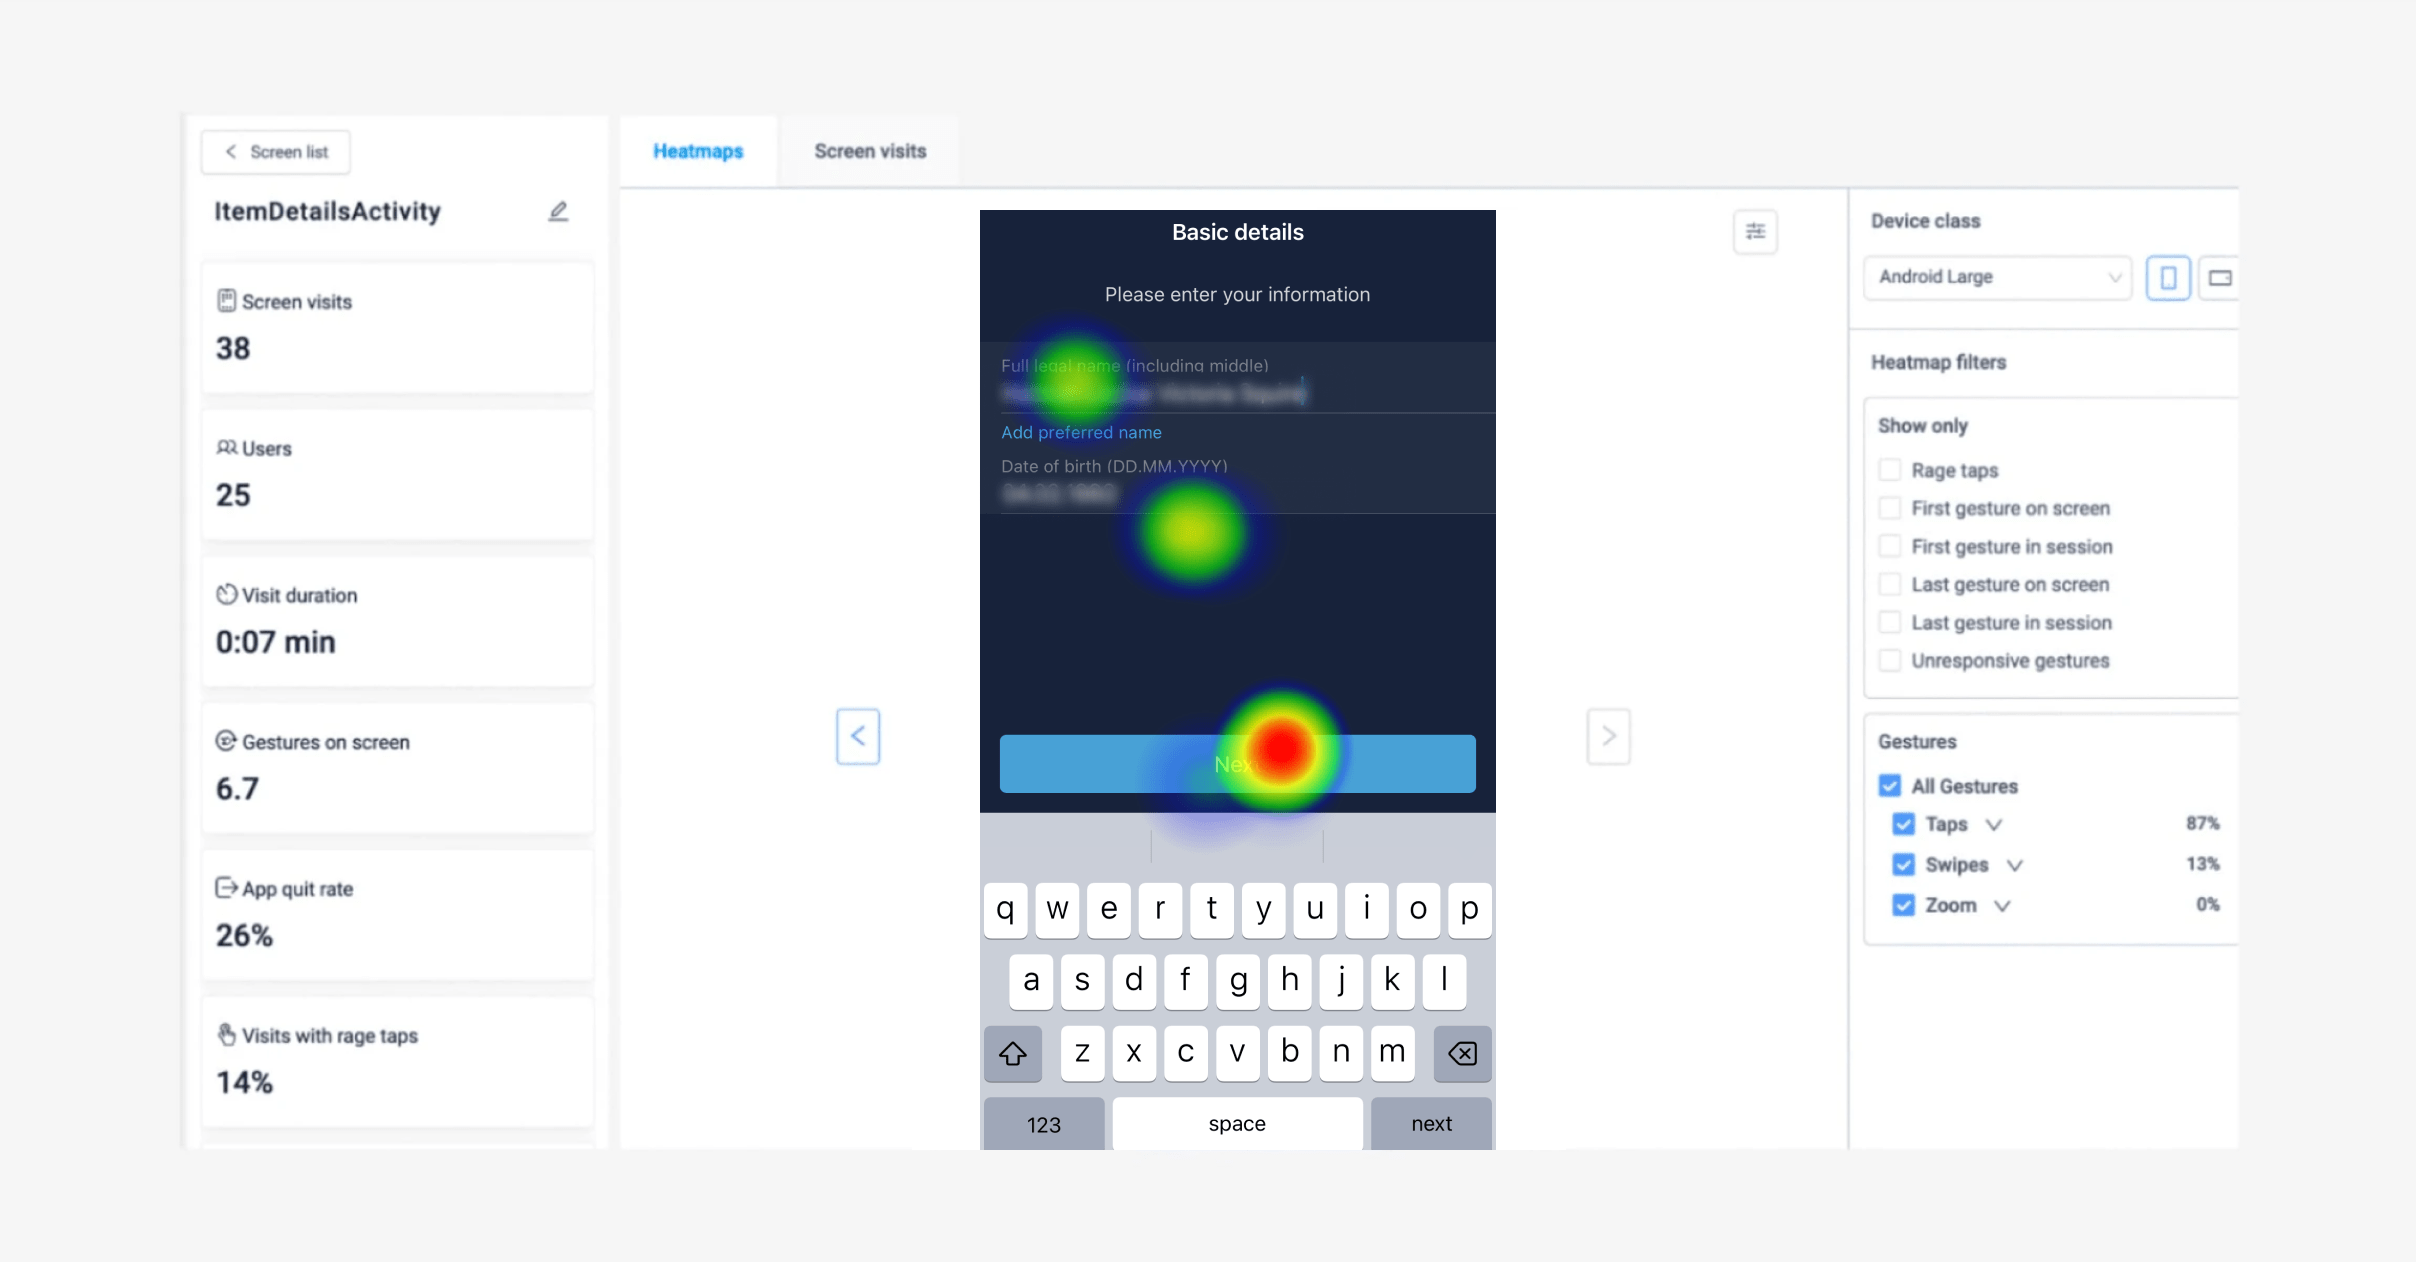
Example of heatmaps in UXCam
You can save user segments with specific actions like the ones above. This will allow you a look into the habits of your users over time, from which you can take the right steps to improve your onboarding experience in a user-focused way.
When analyzing data through heatmaps or session replay, take a large enough sample. We would recommend that at least 2,000 users should have created an account and started the onboarding process. Doing so will allow agile teams to make reliable judgments on user behaviors and make stronger recommendations for solutions.
Some examples of custom events to track to make up this sample size are:
Email successfully registered
Password successfully set
ID card successfully uploaded
You can also compare heatmaps across different app versions, device types, and user segments. Making use of this will give a clear overview of how your onboarding process performs, looks, and behaves across all screen sizes and different operating systems.
Here are some examples we’ve come across of great onboarding experiences. Take a look, you may find some tricks you can apply to your onboarding process. Or download our user-focused app onboarding guide.
Product tours
User activation doesn’t just stop at the onboarding process, you need to guide your users to their “aha!” moments where they realize how valuable the app is to their everyday lives.
No matter how intuitive you make your KYC and onboarding flows, you’ll still need to provide occasional guidance for your users. Hopefully, you won’t have to explain everything, but there will be some aspects of your product that need some further explanation. This is especially true for fintech apps, as the majority of first-time users won’t understand some features like buying crypto.
You can create a product tour that introduces the entire app, or specific features of the app, to new users and encourages them to engage with it.


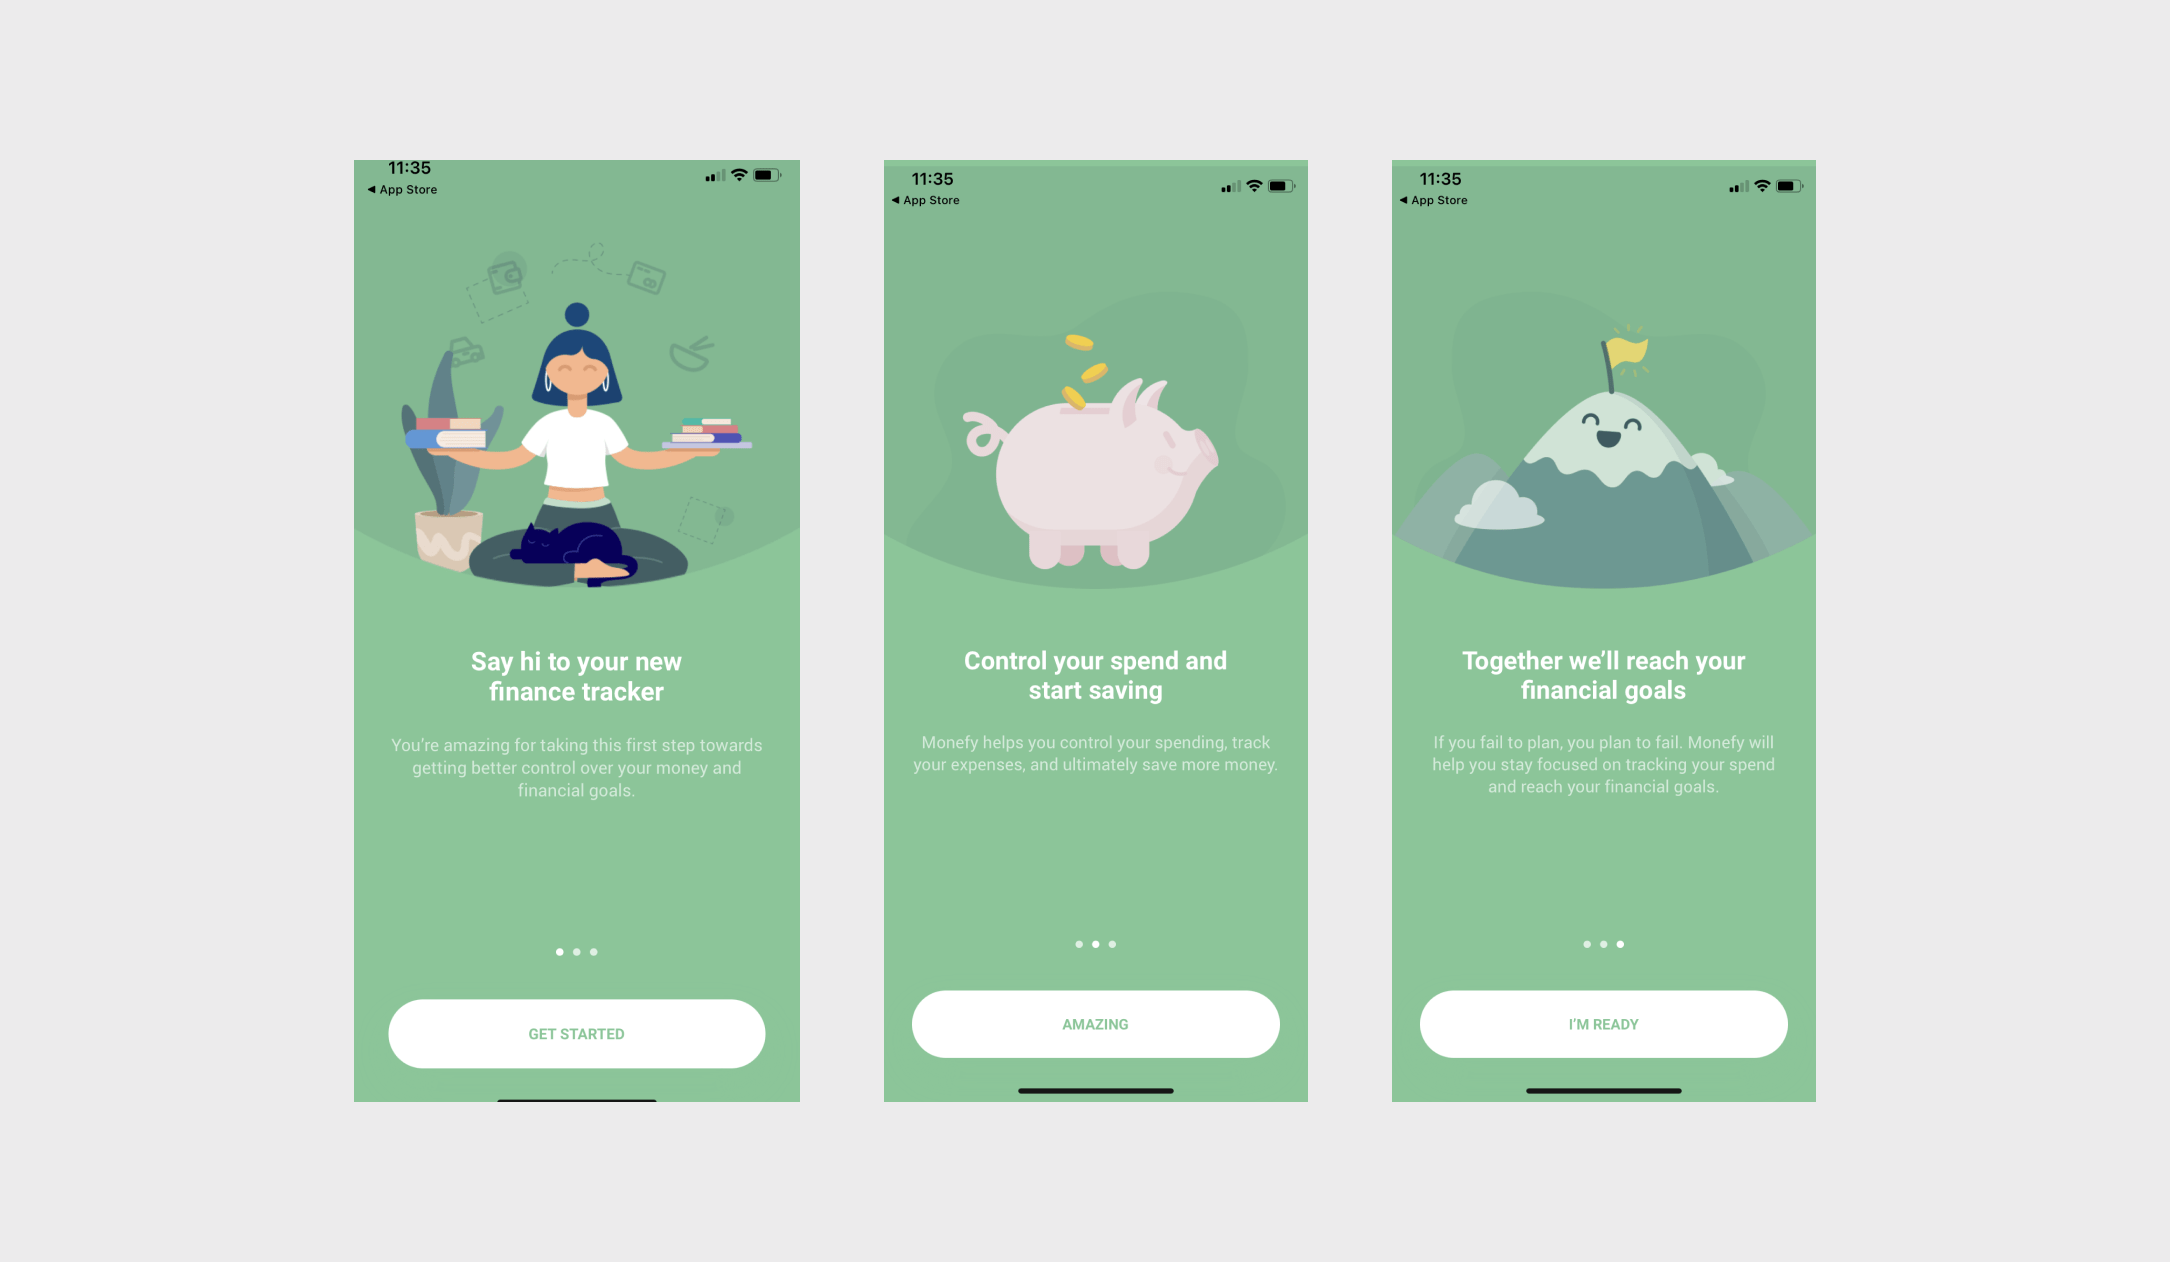
Monefy’s welcome pages
As you create the product tour, make sure it’s helpful, but not too overwhelming. Use the product tour to show users where to focus their efforts to discover your product’s value.
Provide educational content
Because you can’t cover everything with a product tour, you’ll also want to provide user guides and educational materials that provide information about using specific aspects of your product.
It’s not only important to show users how to use a feature by providing walkthroughs but to explain industry jargon so users can make informed decisions with their own money. Incorporating educational content into your fintech app will improve the level of trust your users have in your app and increase account activation and engagement rates.
Let’s say the majority of users have limited knowledge of buying crypto currencies. If they open the crypto feature of a traditional banking app, and it gives no context as to how to trade, and the risks they are more likely to drop off that screen and go back to the homepage, possibly never returning to figure out how to buy crypto themselves.
Coinbase has a cool feature that rewards learning about crypto. Their “Learning rewards” feature on the homepage of their app, encourages users to watch videos on specific coins and then quizzes users afterwards. The reward? Crypto itself.


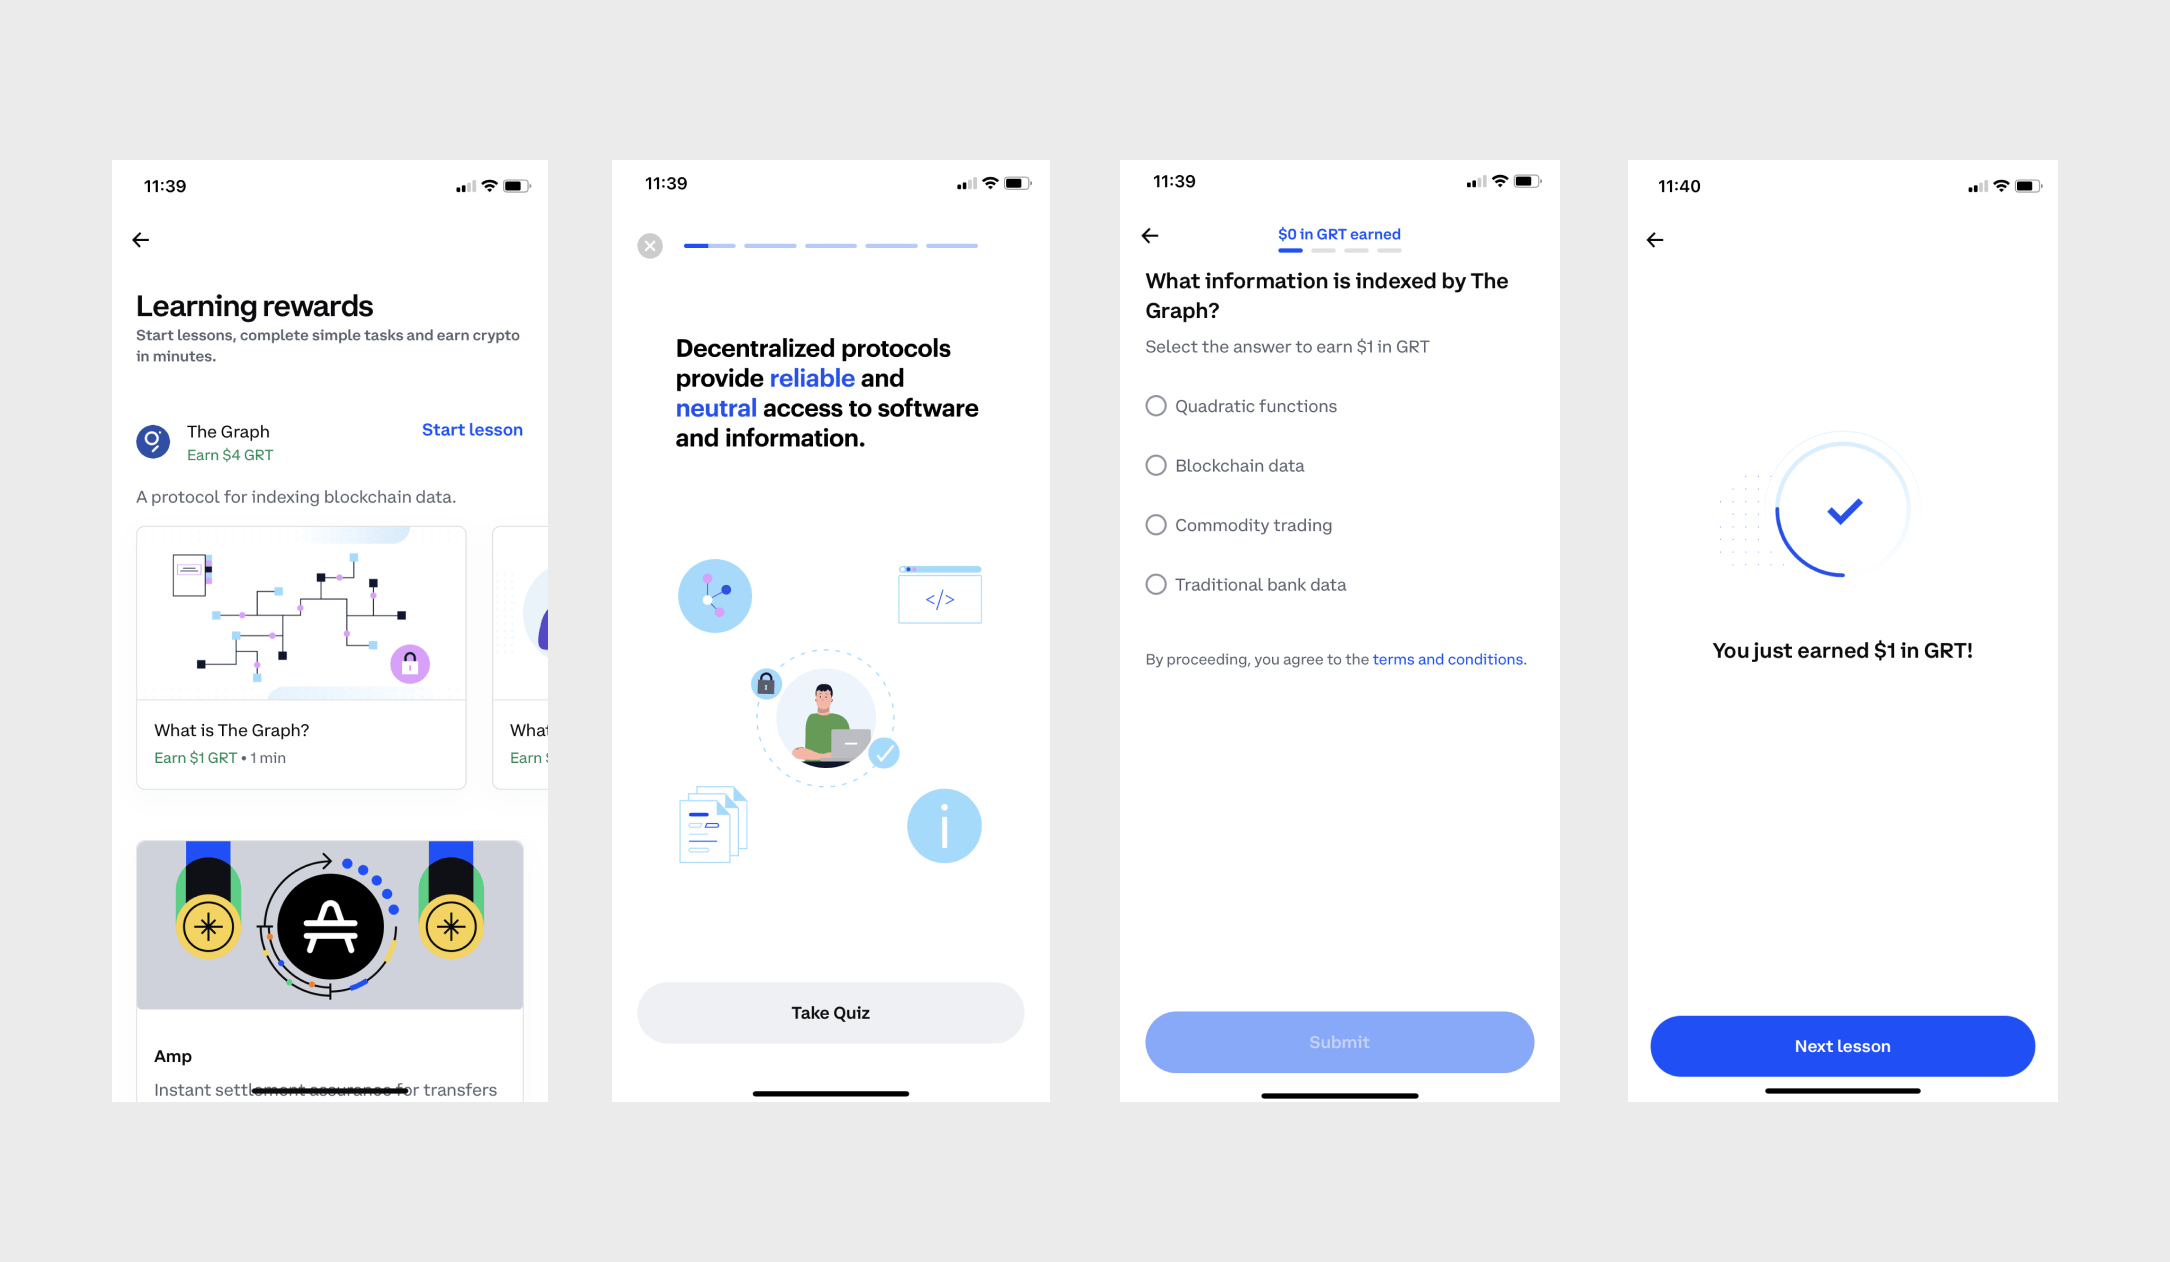
Coinbase’s learn rewards feature encourages users to understand more about coins before purchasing
If you’re trying to encourage users to try out new features or about the industry itself, and have educated them on the benefits, you’ll want to measure the success of your efforts.
With UXCam you can measure how many users are engaging with a feature, compared to how many were before providing the educational content.


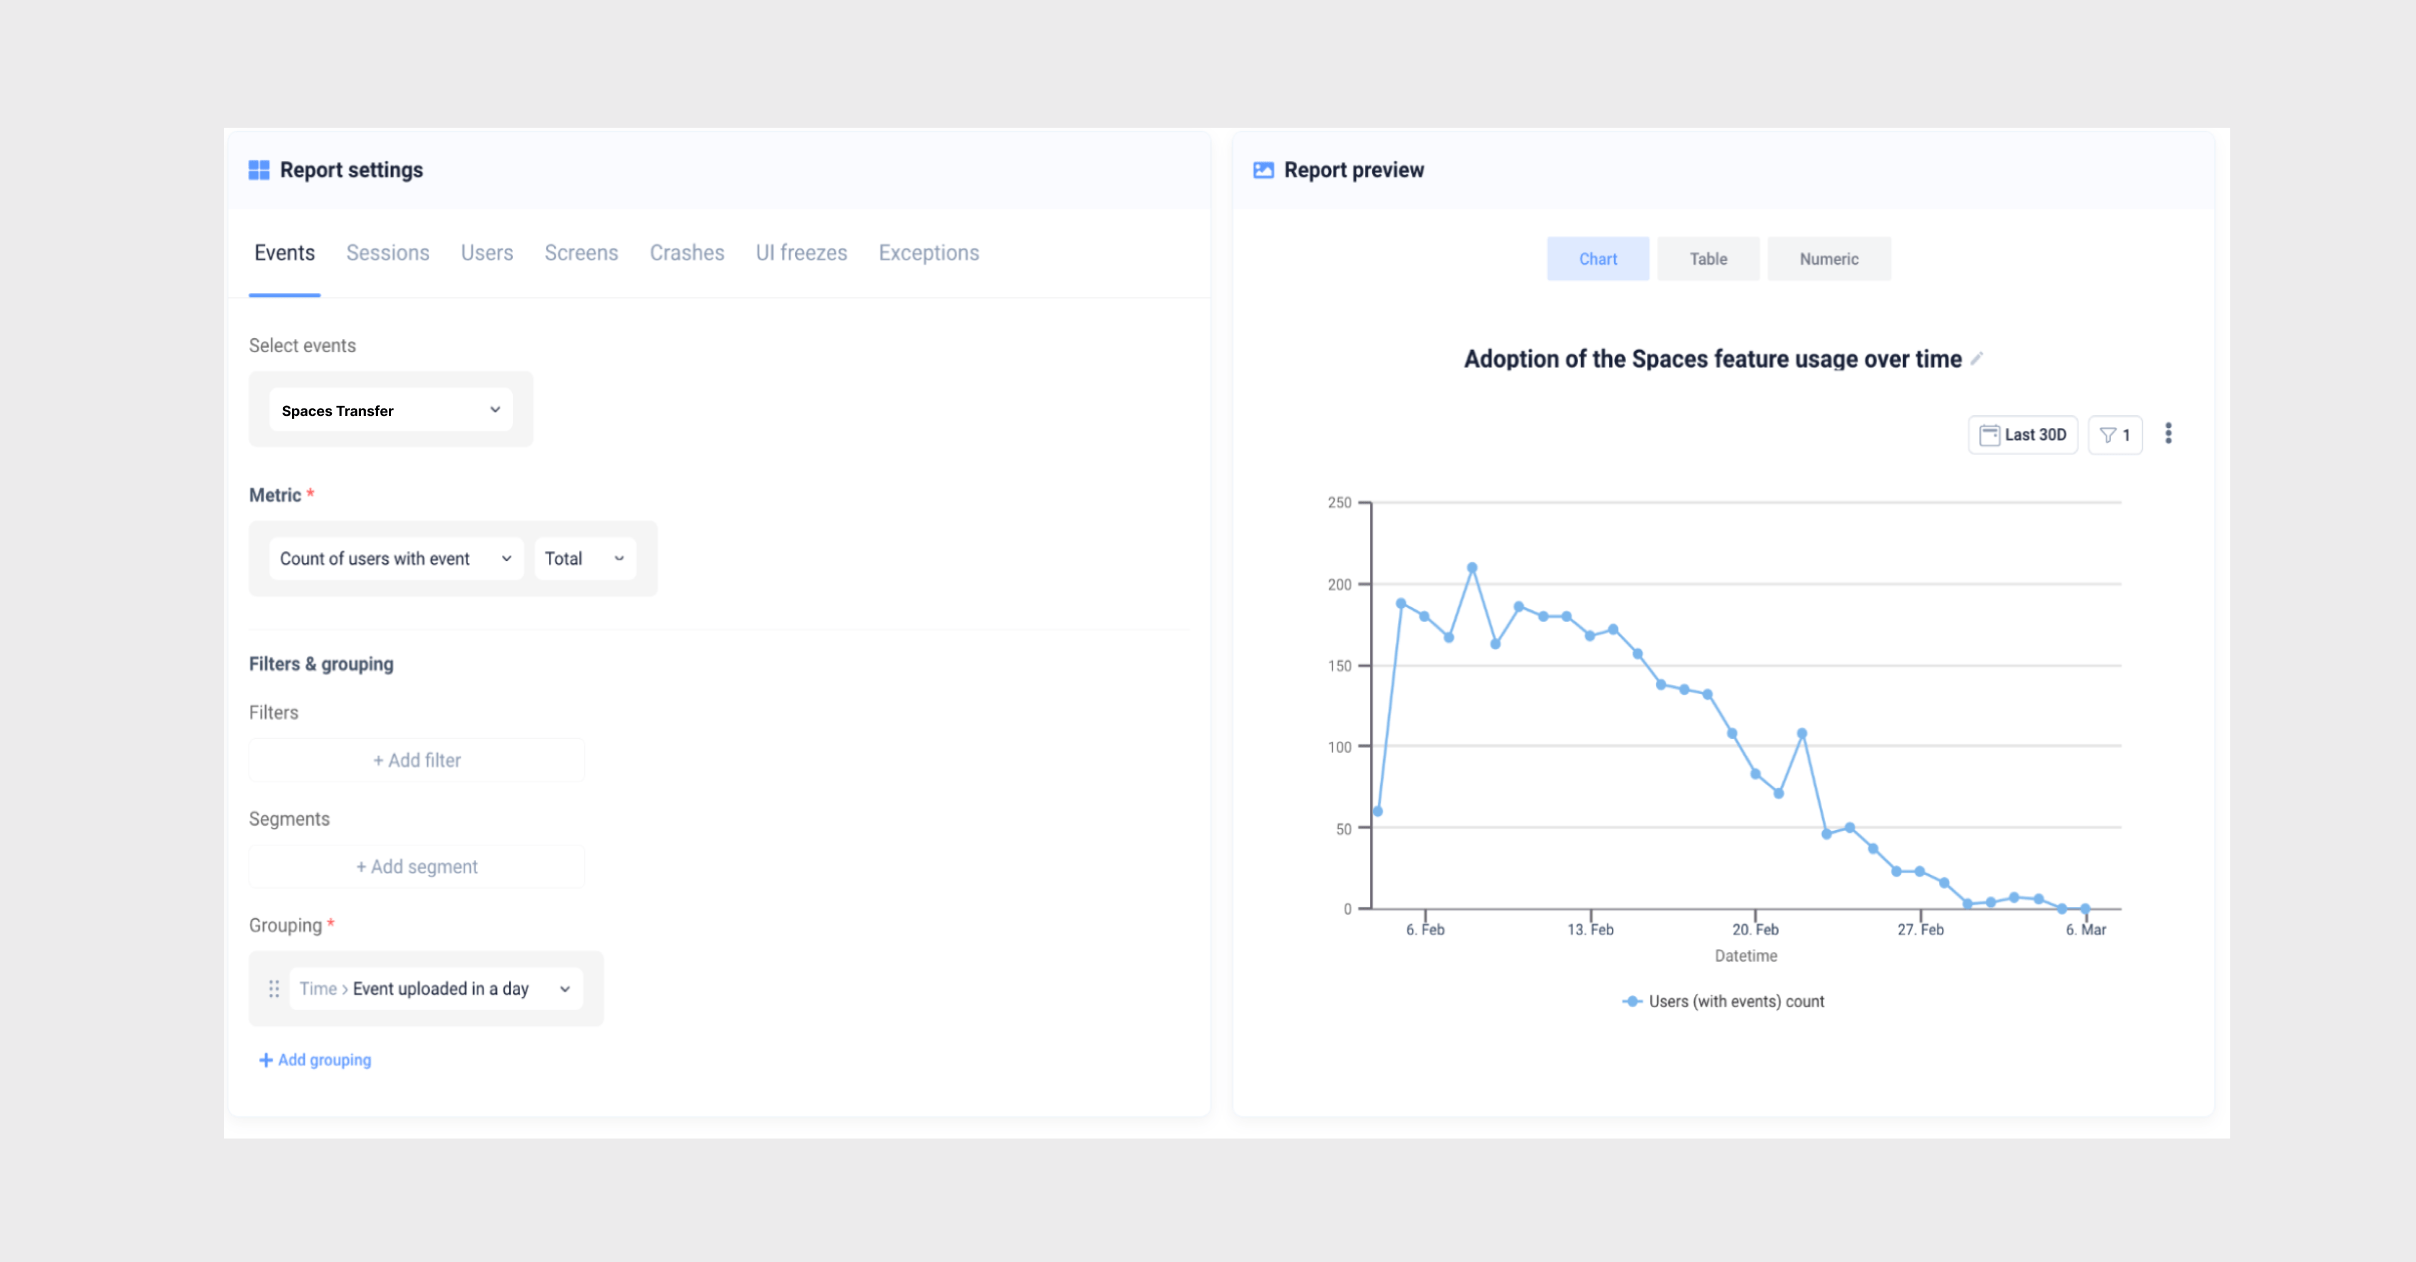
Parameters of feature adoption metrics in UXCam
Measuring feature adoption is a good way to understand which areas of your app users might need help with so you can put together some educational materials and work towards increasing that account activation.
Measuring this KPI will also come in useful when redesigning certain elements of your features later as you’ll have a good understanding of how users are reacting to the changes for further iterations.
For more in depth KPIs to measure specifically for feature adoption, read this article.
Free with a premium mode
When talking about apps in the personal finance or trading space users need a little more convincing to download and become a frequent user simply because it’s a private and sensitive part of their lives.
To successfully increase account activation, you’re going to have to make it easy for people to see it in action and even try out.
Most fintech apps are free for users, generating revenue through showing ads, collecting affiliate or transaction fees, or through charging for premium accounts.
Take for example Mint, the personal finance and budgeting app that allows users to track all their finances in one place for free. Mint makes money from serving up offers from its financial partners and collects affiliate fees when people sign up for those offers.
The more accounts that users connect to in Mint, and the more goals and budgets users create, the more information Mint has about its users to target the offers it provides.
Free trials
There are some fintech apps that chose to forego the ad or affiliate model to generate revenue and instead charge a subscription. They’re banking on (no pun intended) users who are willing to pay a subscription fee to avoid ads and keep their data private.
Free trials give users a chance to test the app and experience its benefits before committing to a paid subscription.
An example of a subscription based personal finance app is YNAB (short for You Need a Budget). Offering a 34 day free trial before users need to start a subscription.
The advantage to this approach is by experiencing the full breadth of your product potential customers are more likely to experience their aha moment which helps them see the value they’ll get from your product.
The downside to this approach is that your free trial period may not provide potential customers with enough time to experience the true value your product can offer them. Especially if they’re just “dabbling” with your product.
If this is the case, you can always identify those users that try to use your product and offer them the opportunity to extend their free trial.
UXCam will automatically segments users into groups of:
Loyal users
New users
Returning users
Users slipping away


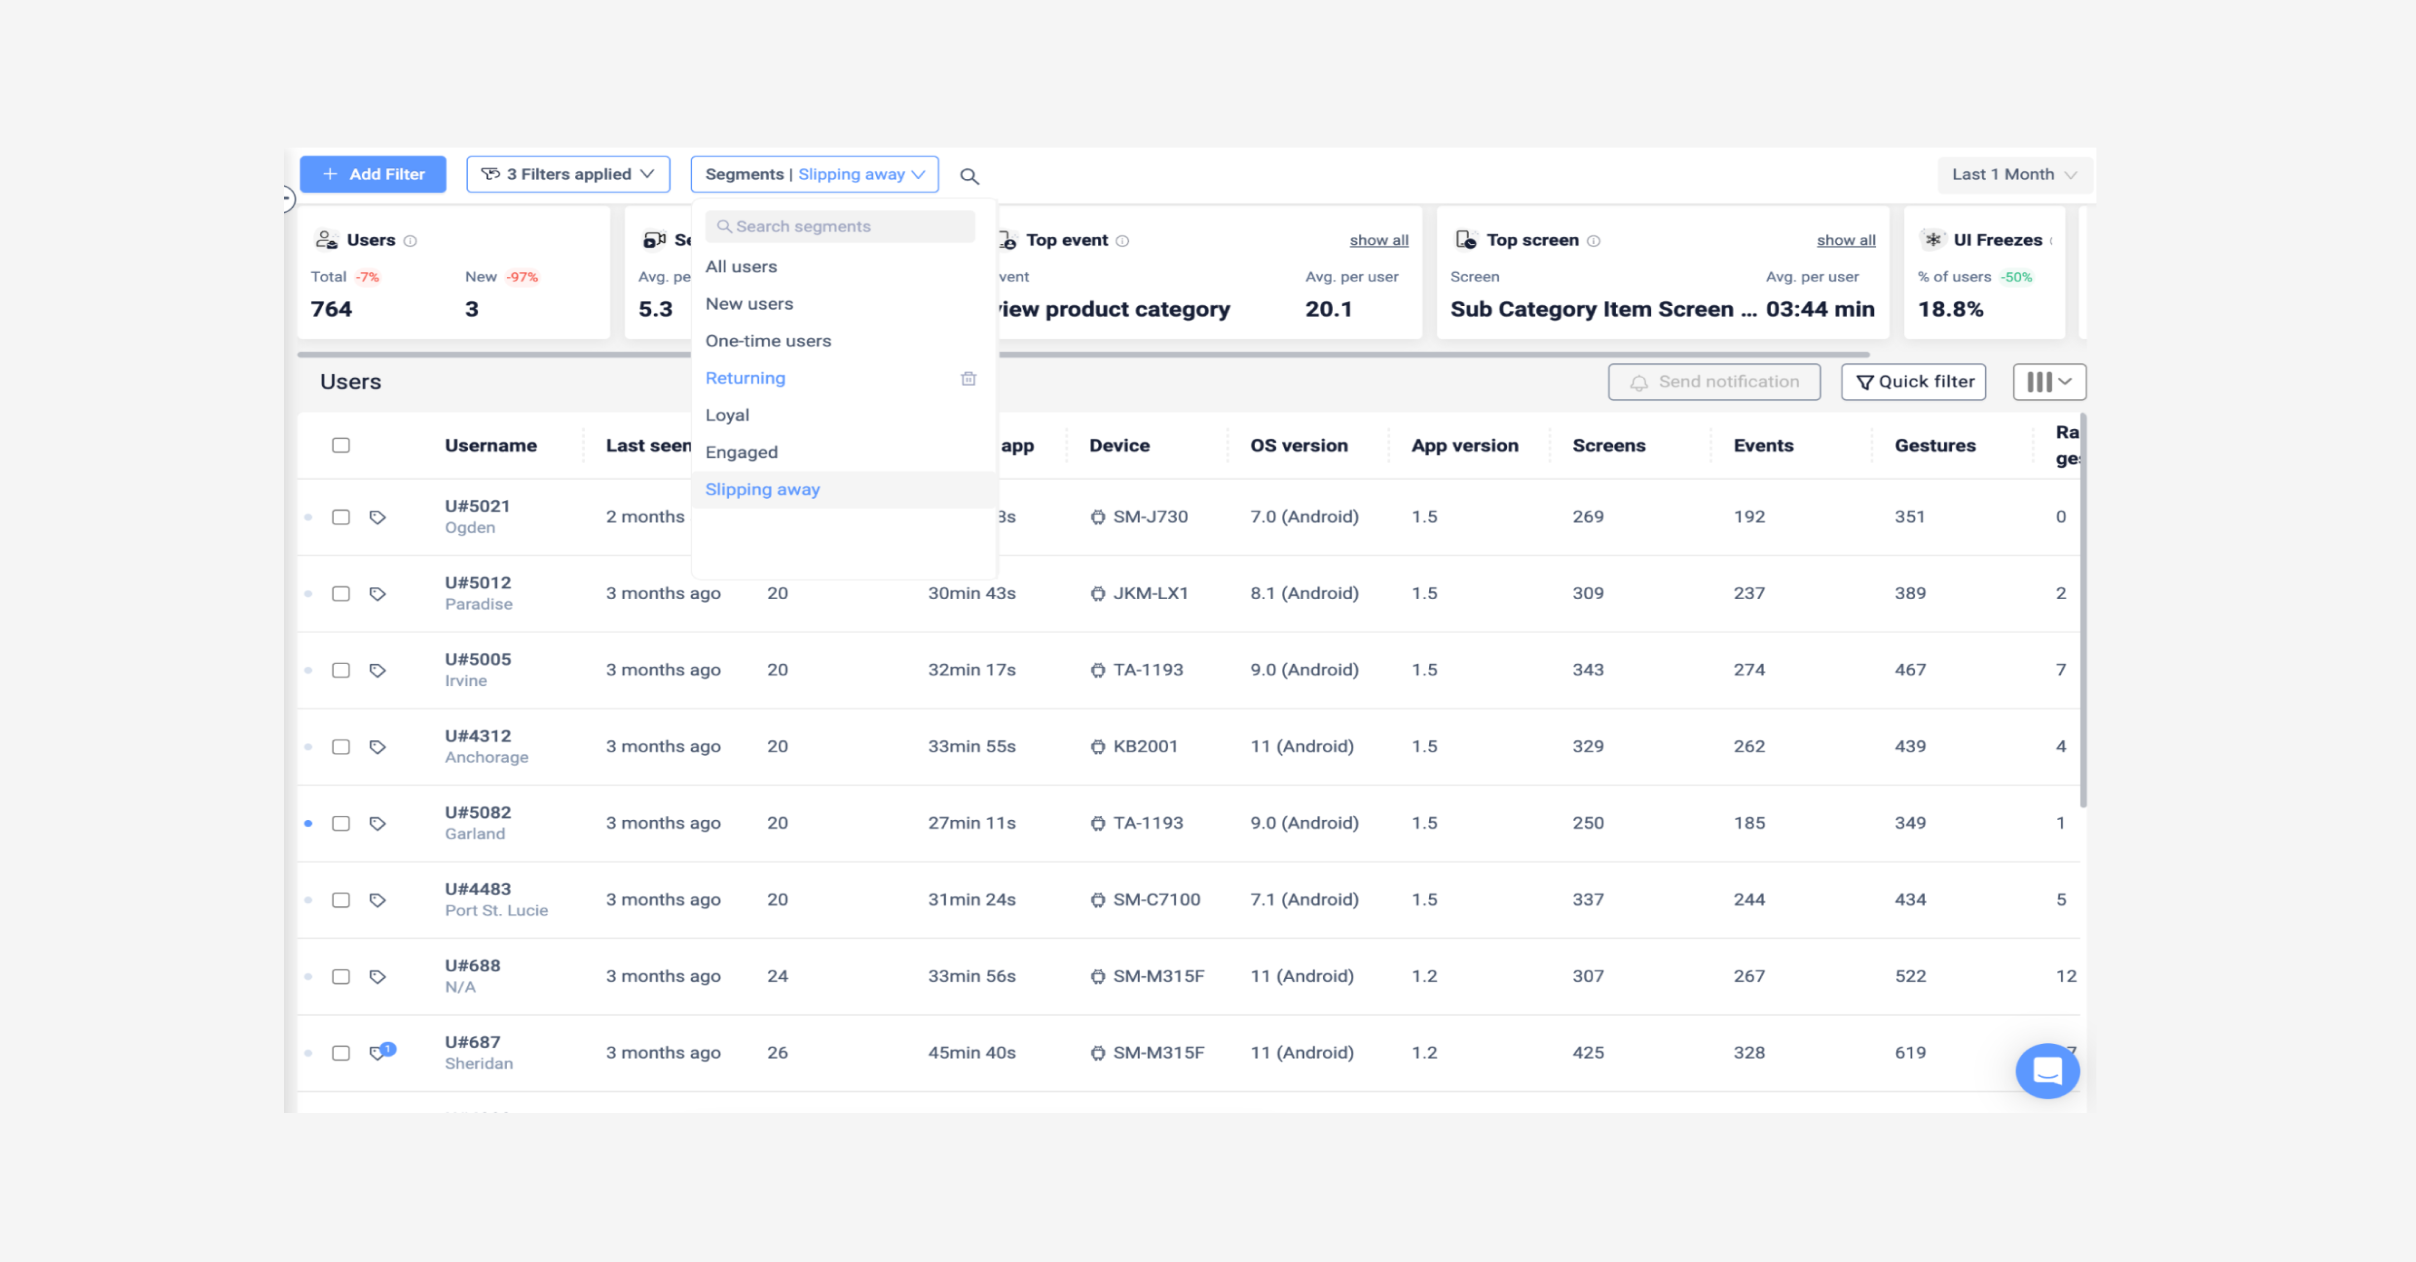
User group filter in UXCam
This way you can filter easily for those users ‘slipping away’, watch their corresponding sessions, and strategize an approach for re-engagement.
Personalize communication techniques
Getting users signed up and setup in your app aren’t the only steps to activation. You need to communicate regularly with them to encourage them to continue using your product, or start using it again.
Communicating with people outside the app, often via email and push notifications, is a great way to stay connected with new and existing users.
You can supplement your user onboarding with welcome emails once a user has completed the process, while you can use push notifications to nudge users into completing a flow that they’ve begun but not completed.
These communications can help spur people who have signed up but have not engaged with your product as much as you’d like to get engaged with the product, leading to stronger account activation rates.
With all these communications, the more you can personalize them, the stronger a connection you’ll build with a user.
You can also send out regular communication to existing users to let them know about new features and product updates. When you create these updates, think about how you can get people to read them. These types of communications can be via email or in app messages.
If you want to encourage unengaged users to explore a new feature on your app, track custom events to determine user sets that don’t trigger an activation event shortly. Then you can nudge them using a push notification.


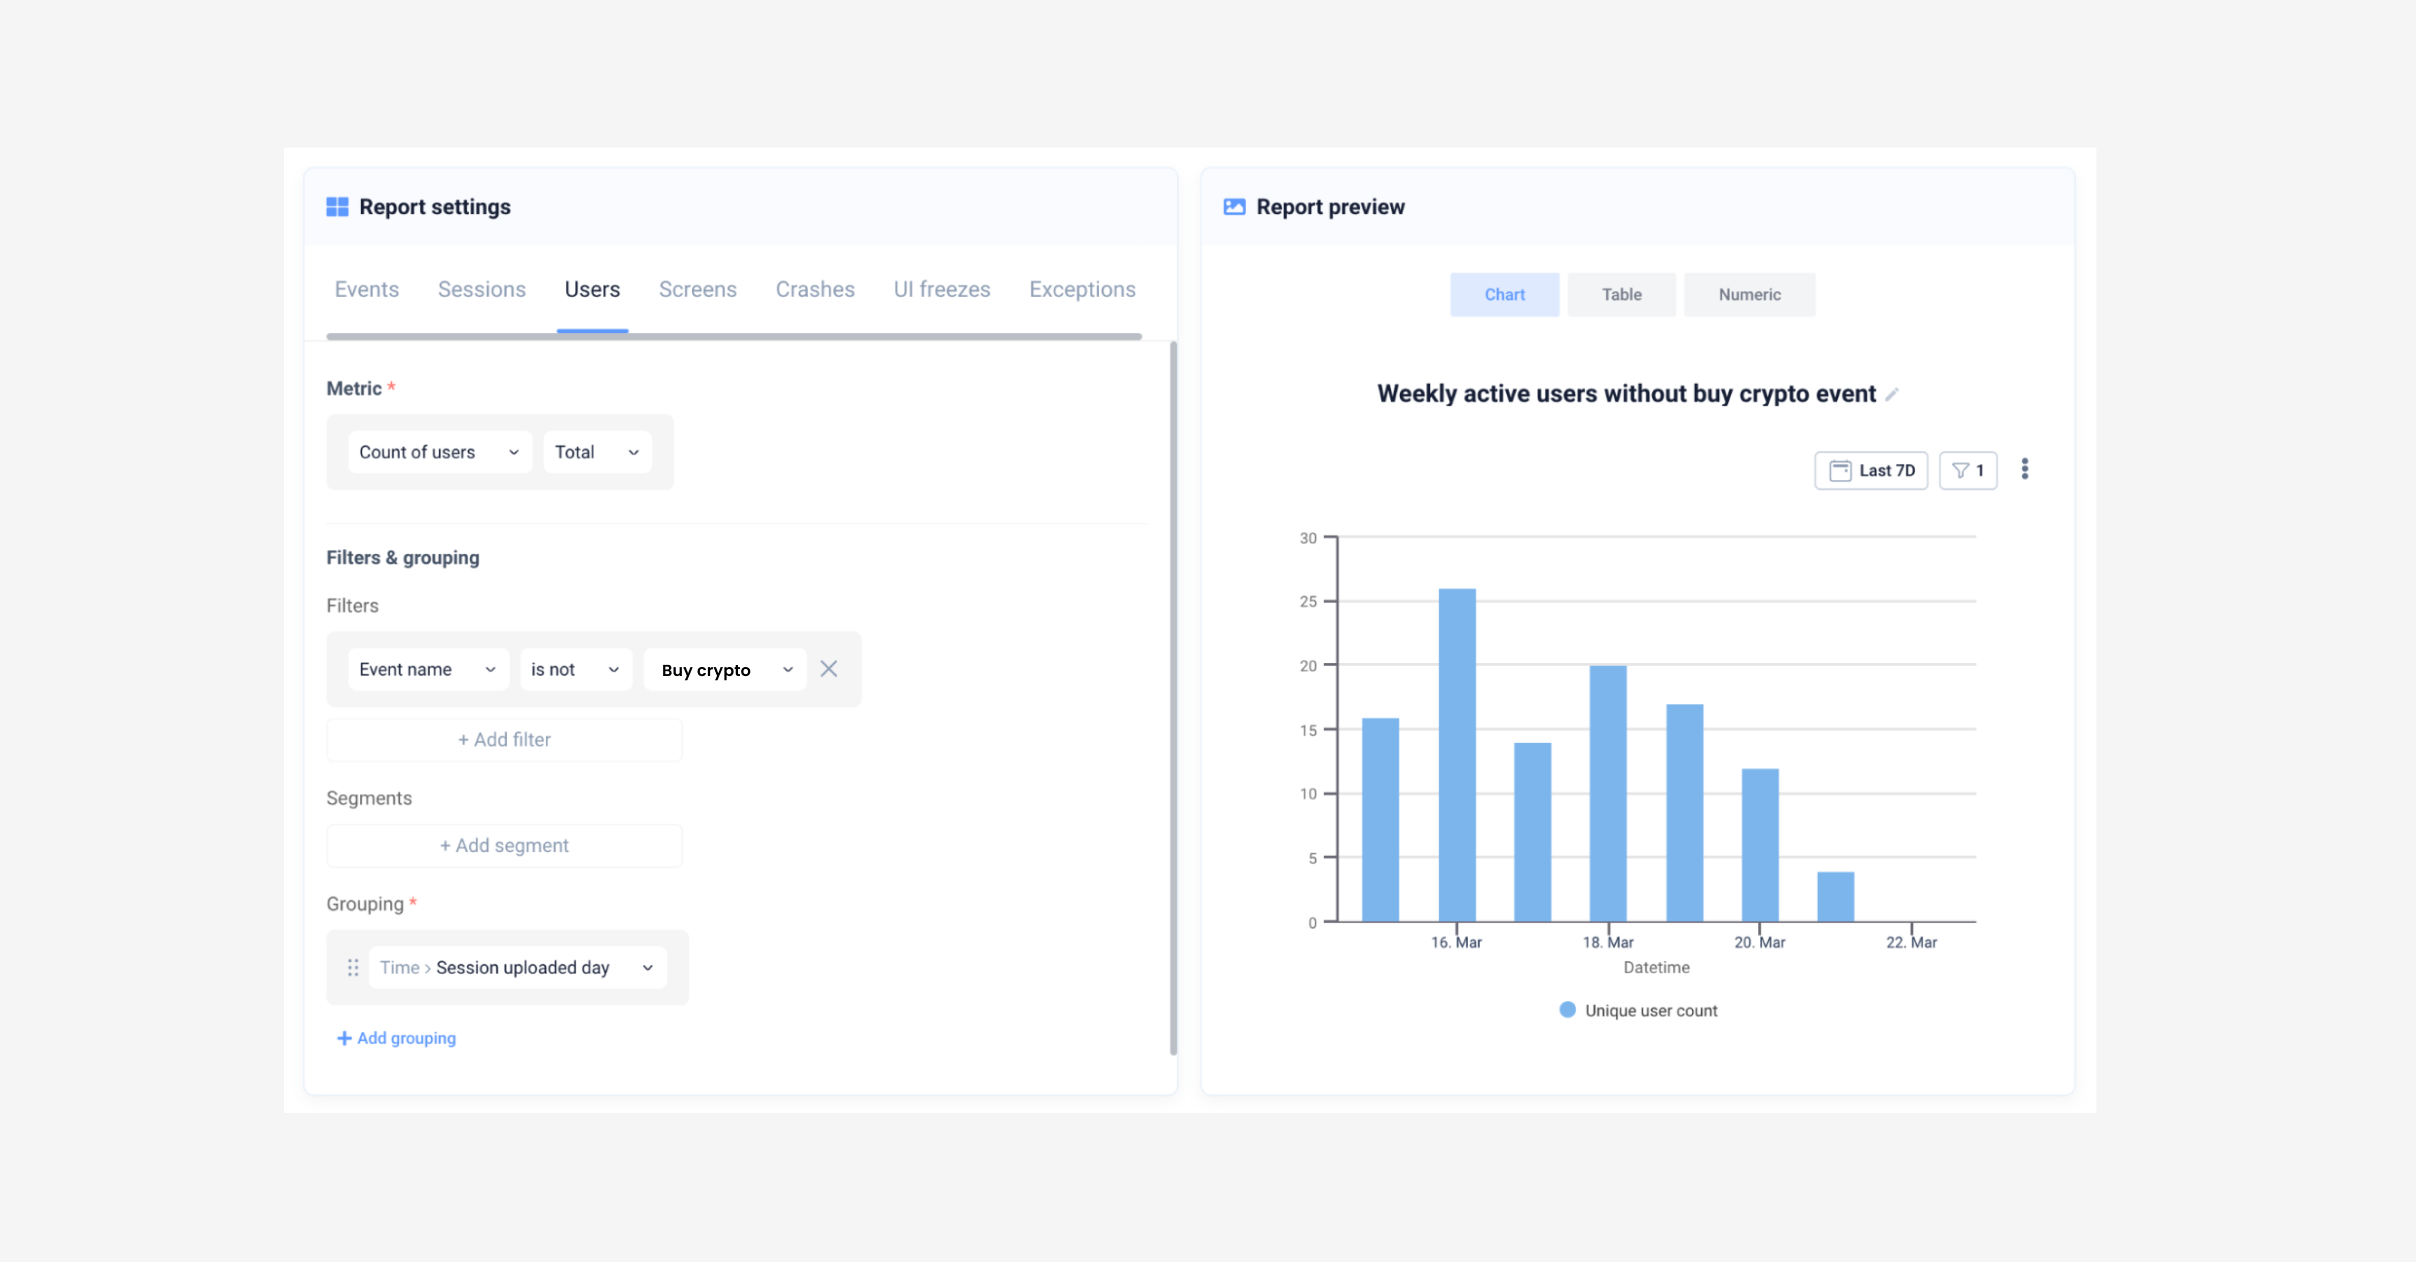
Parameters for measuring users not engaging with crypto feature
Users won’t all need the same communications, so UXCam automatically segments your users into sets of returning users, loyal users, new users, and users slipping away. So you can send more personalized messaging for each cohort and then track the results with your mobile app analytics tool.
As you can see, there are a variety of ways to increase account activation. Most of those techniques involve a deep understanding of both your potential and existing users - how they use your app and where they run into obstacles that prevent them from activating.
UXCam provides a variety of ways to build a better understanding of how people use your app and make their way through it. Some of those features include:
Journey analysis helps you identify unusual in-app journeys, find bottlenecks, and see how different user groups behave in your app.
Funnel analytics shows you where users drop off and helps you identify hidden trends.
When you identify trends from the previous two tools, you can dig into session replays to get specific examples of the behaviors you identified.
If you suspect people are not activating because of app crashes, you can use crash analytics to stay on top of crashes and bugs.
Related articles:
8 low-effort high-impact fintech mobile app improvements
AUTHOR
Kent McDonald
Kent writes about and practices software product management. He has product development experience in various industries, including retail, fintech, agriculture, financial services, health insurance, nonprofit, and automotive. When not writing or product managing, he's #ubersherpa for his family, listens to jazz and podcasts (but not necessarily podcasts about jazz), and collects national parks.


Related articles


Product best practices
12 Apps with Great User Onboarding (2026 Examples)
The 12 mobile app onboarding flows I'd study if I were designing one today, with specific callouts for what each does well, common mistakes, and the...


Silvanus Alt, PhD
Founder & CEO | UXCam


Product best practices
Why creating a data-driven culture has less to do with data than you think
Kishan Gupta, CEO, shares 5 tips and techniques for fostering a data-driven culture based on his own experiences building and leading...


Kishan Gupta
Co-Founder of UXCam


Product best practices
Finance apps have a customer support problem, here's how to fix it
Learn about the customer support problem in finance apps and practical solutions to fix it in our latest blog post, and improve user satisfaction and...


Jane Leung
Product Analytics Expert