Back to blog
6 MIN READ
5 Important Product Health Metrics and How to Track Them
PUBLISHED
18 April, 2024

Product Analytics Expert
Looking for how to measure product health?
Product health metrics are the vital signs of a product’s performance, comparable to how medical vital signs reflect the state of a human body’s health.
These metrics are key performance indicators (KPIs) that provide insights into how users interact with a product, pinpoint areas that require enhancement, and guide data-driven decisions to improve UX and cultivate growth.
In this article, we explore the role of product health metrics for mobile apps. We’ll discuss their role in measuring adoption, engagement, and retention, how to calculate them, and how product teams use our platform to track and analyze them.
Helpful summary
Overview: This article introduces product health metrics, including five metrics for mobile apps. You’ll learn how to calculate them and how product teams use our platform to track and analyze them.
Why this is important: Understanding and tracking product health metrics are crucial for product-focused teams. These metrics provide actionable insights into user behavior, product performance, and areas requiring optimization.
Action points: Focus on our essential five: conversion rate, session length, depth rate, feature adoption rate, churn rate, and user retention rate.
Further research: Check out our blog for more product metric info and mobile app analytic insights from industry experts.
Why listen to us
We have a proven track record of helping businesses understand and analyze their app’s health with features like session replay, retention analysis, and crash analytics.
What are product health metrics?
Product health metrics are key performance indicators (KPIs) that measure a product’s performance, success, and overall robustness throughout its lifecycle. These metrics are crucial for understanding how users interact with a product, identifying areas for improvement, and making data-driven decisions to enhance UX and drive growth.
Here are the three main areas with metric examples, that product health metrics can broadly be categorized into:
Adoption: New user growth and conversion rate.
Engagement: Active users (DAU/WAU/MAU) and session duration.
Retention: Churn rate and Net Promotor Score.
5 important product health metrics to track
Conversion rate
Session length and depth rate
Feature adoption
Churn rate
User retention rate
Conversion rate
The conversion rate measures how effective your app is in turning potential users into active users or achieving other key objectives, like signing up for a service or making a purchase.
How to calculate:
Conversion rate = (Number of conversions/Total number of visitors) X 100
Session length and depth rate
Session length and depth provide insights into how long users spend in the app and how deeply they engage with the content or features during a session. Longer session lengths and greater depth of engagement can indicate higher user interest and satisfaction.
Session length is calculated by measuring the time between the user’s arrival on the site or app and their last activity before leaving or before the session times out.
How to calculate:
Average session length rate = (Total duration of all sessions/Number of sessions)
Session depth is the number of pages or screens viewed during a single session. It is an indicator of how deeply a user is engaged.
How to calculate:
Average session depth rate = (Total pages or screens viewed/Total sessions)
Feature adoption
Feature adoption measures the percentage of users who start using a new feature after its introduction. It helps in understanding how well new features are being received by the user base.
How to calculate:
Feature adoption rate = (Number of users using the feature/Total number of active users) X 100
Churn rate
The churn rate helps you understand the rate at which customers stop using your product. Tracking churn allows you to identify what keeps users engaged or causes them to leave, enabling strategies to increase user retention and satisfaction.
How to calculate:
Churn rate = (Lost customers/Total customers at the start of period) x 100
User retention rate
User retention rate is a metric that calculates the percentage of users who continue using your product or service over a given time. It's an important indicator of how well your product or service maintains its user base, and is important for understanding your business's long-term success and sustainability.
How to calculate:
User retention rate = (Number of users at the end of the period/Number of users at the start of the period) X 100
How to track and analyze product health metrics with UXCam
Overall, our platform is instrumental in understanding product health metrics. Next, we’ll mention how product teams use some of our features to track and analyze them.
1. Conversion rate
A higher conversion rate implies a lower customer acquisition cost (CAC) and indicates that the app successfully converts users at various stages of their journey. On the other hand, low conversion rates can be a sign of several reasons, like ineffective engagement, confusing navigation, or frustration caused by poor performance.
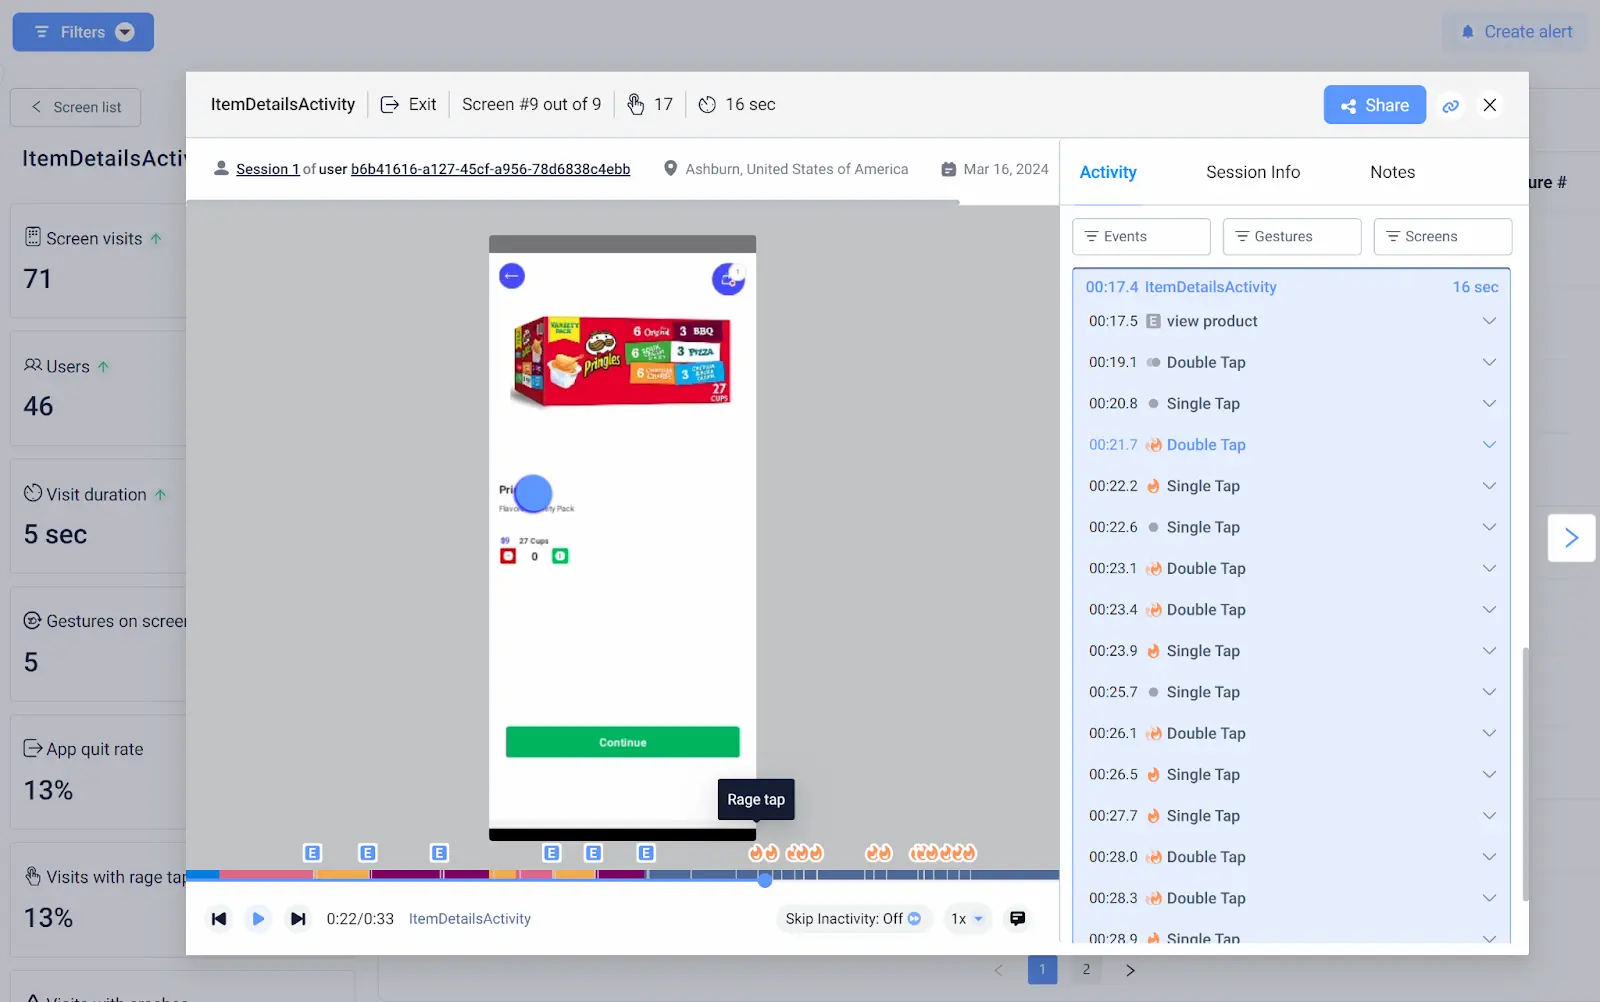
UXCam will help you get to the root cause with functionality like our session replay. This feature lets you see recordings of user sessions for insights into natural app interaction. Identifying bottlenecks and friction points that may be affecting the conversion process.
Our funnel analytics enables teams to create multistep funnels and gain a detailed analysis of how users move through different stages of the app. This analysis identifies obstacles or friction points that users encounter that may lead to abandonment before completing the desired action.
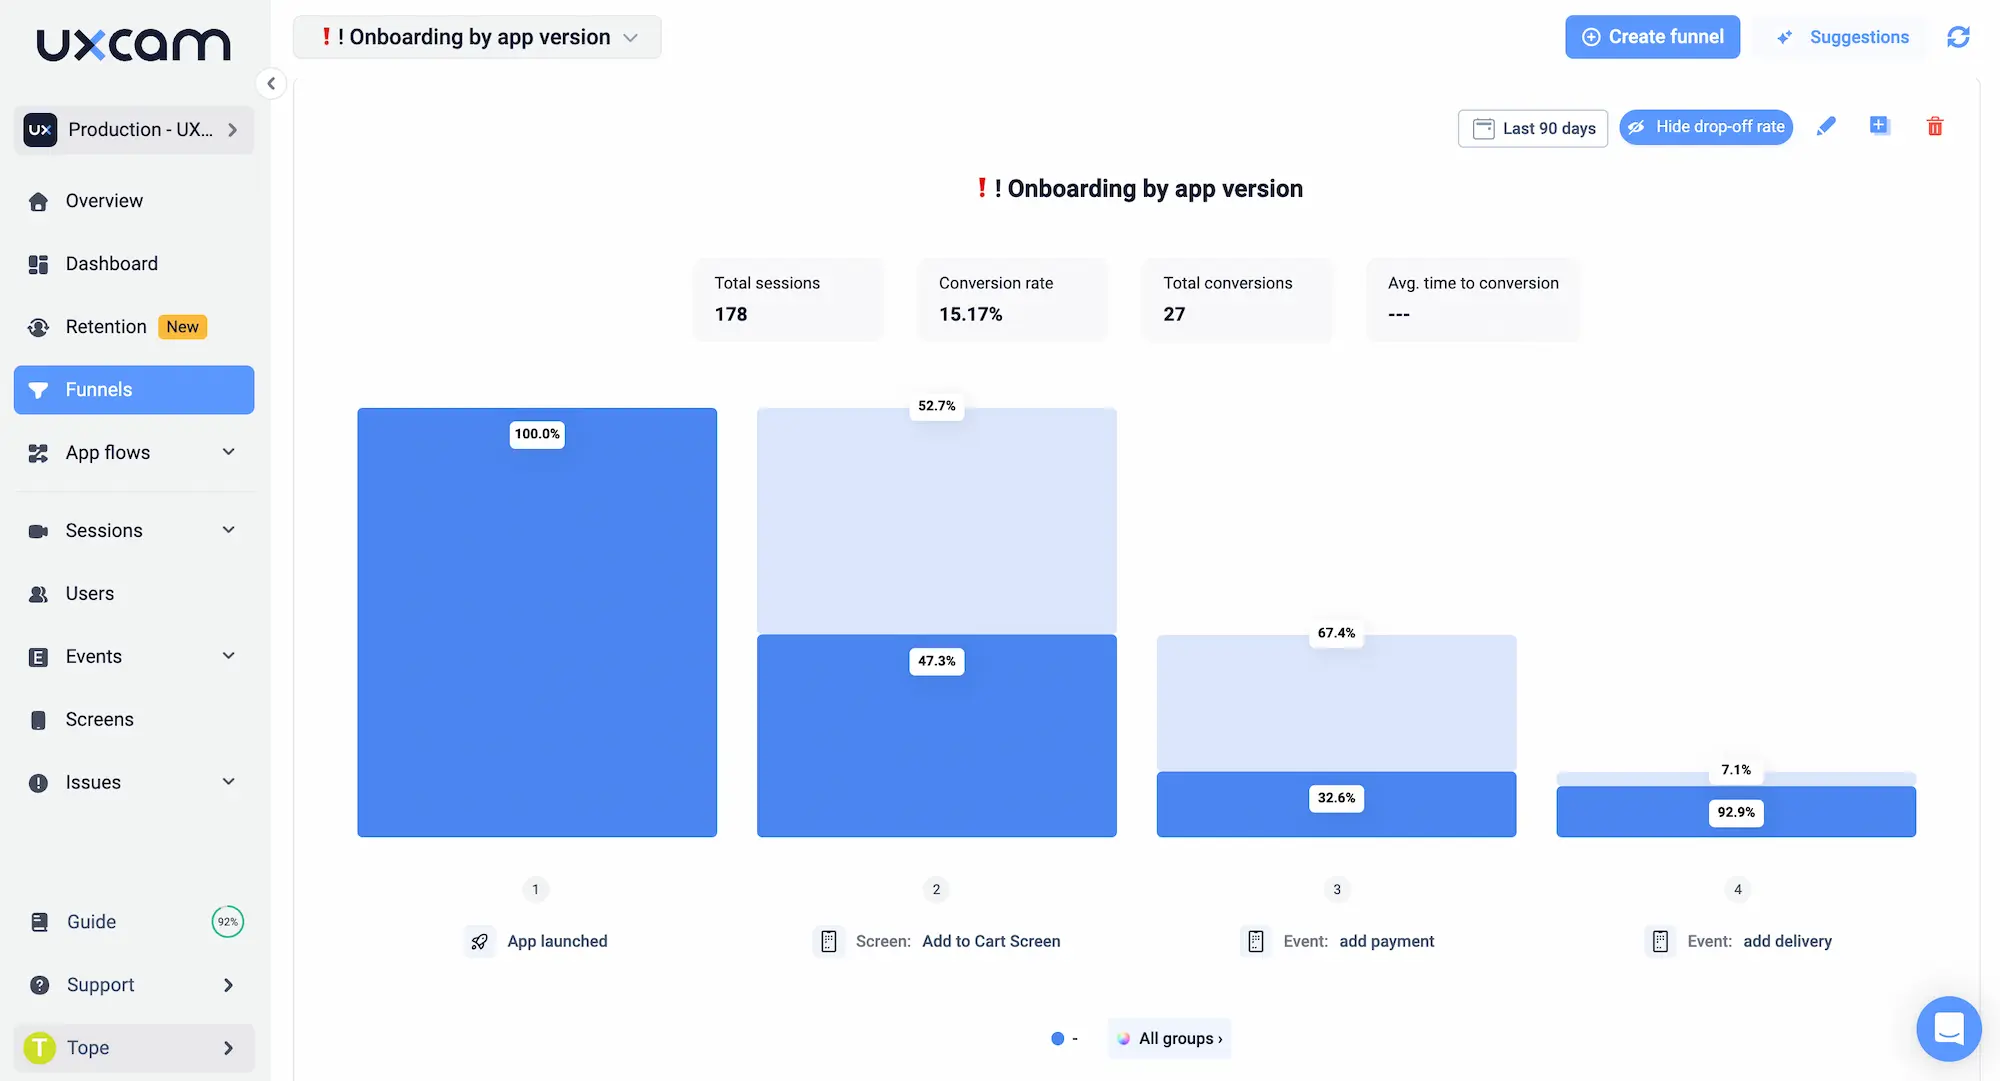
Understanding and addressing the reasons behind user drop-offs helps retain users and encourage drop-offs to come back.
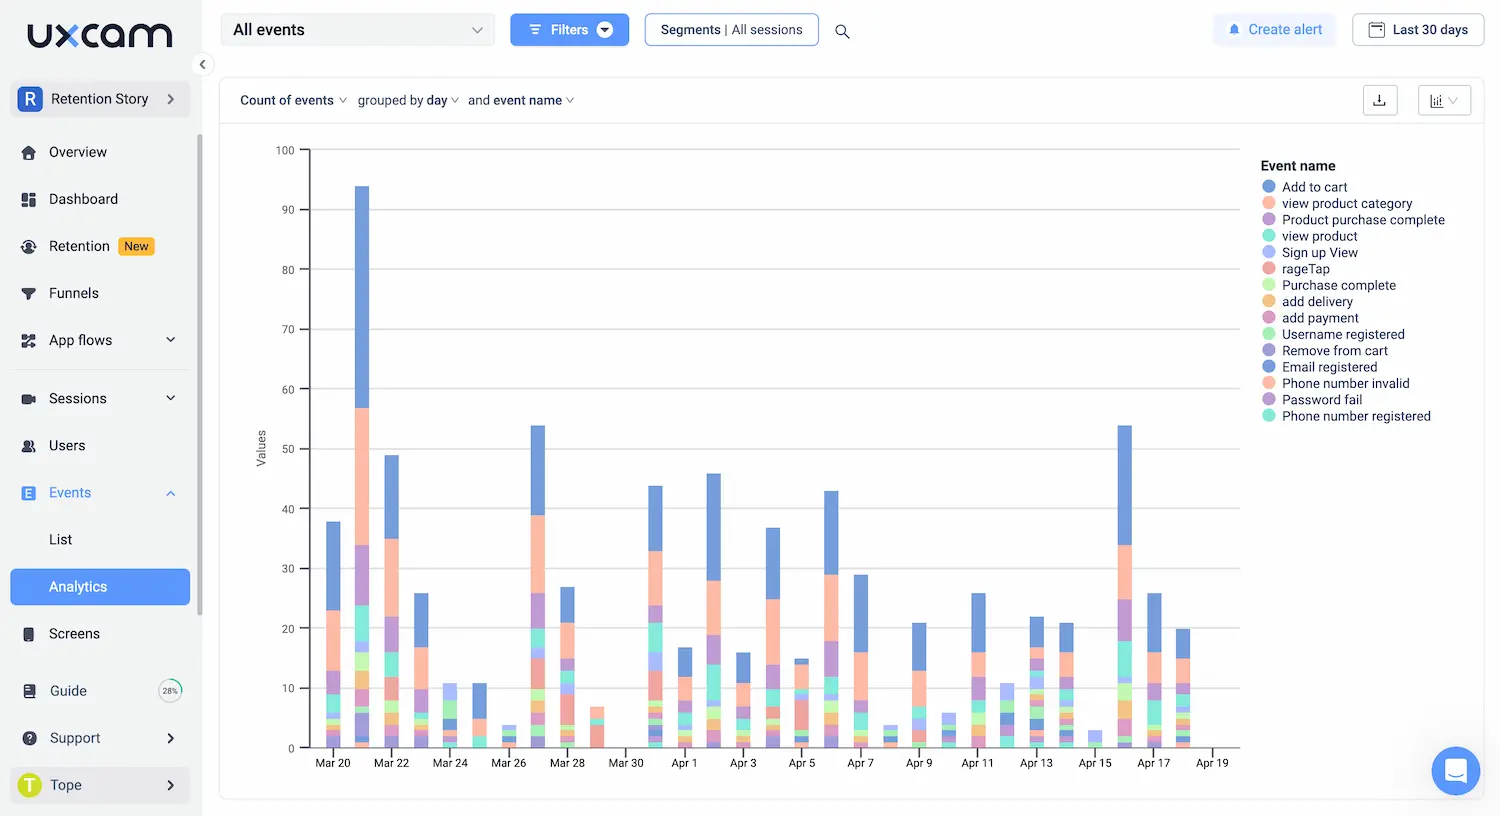
Product teams use custom events to set up and monitor specific user actions that directly correlate with conversion goals. They analyze these events to understand which actions led to conversions and optimize accordingly.
You can also watch session replays of users who trigger custom events but don’t convert for context and insights into why users may drop off at specific points.
2. Session length and depth rate
Our user journey analysis feature provides a comprehensive view of how users navigate the app and interact with its features.
It contributes to the understanding of session length and depth metrics by:
Visualizing progress: See how far the user progresses through the app before ending their session.
Identify drop-offs: See where users commonly disengage, impacting session length and depth.
Create multi-step funnels: These funnels represent the user journey, provide more insight into the user’s experience, and help understand the complexity of user interactions related to session depth.
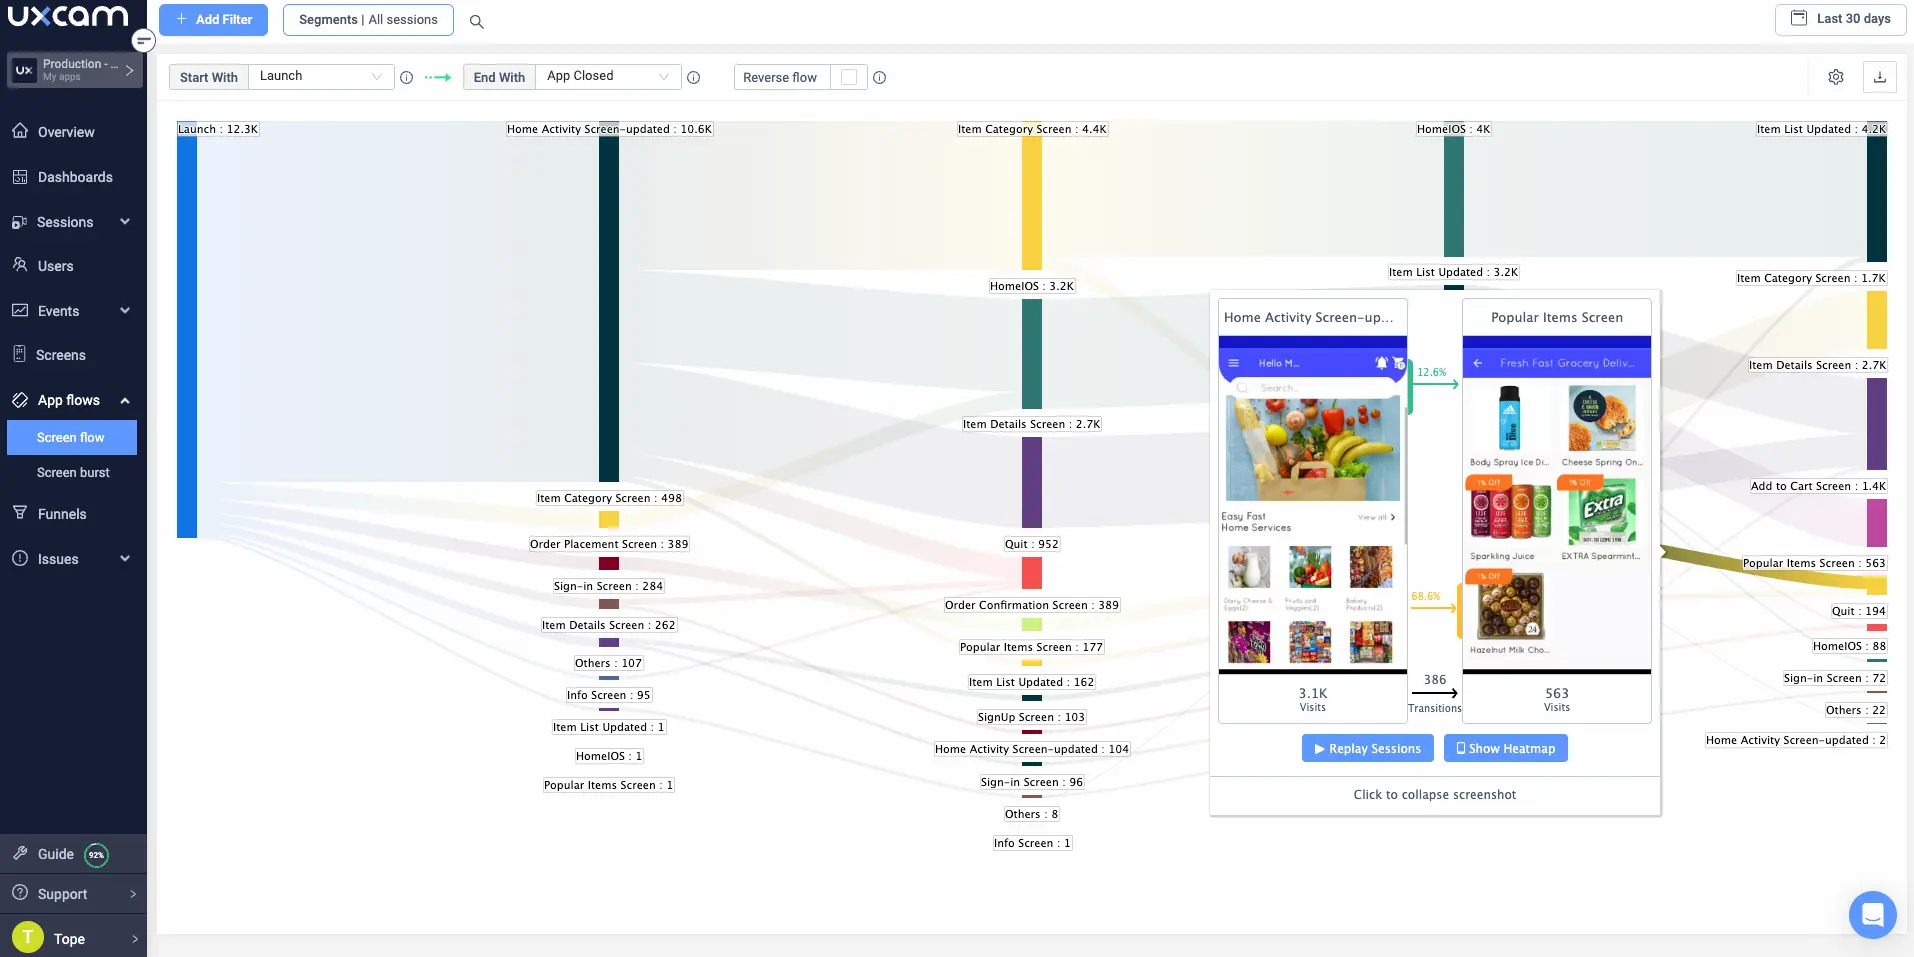
Session replays are also instrumental here. The granular detail of user behavior in-app usage provided helps teams understand engagement and can inform improvements to increase both session length and depth.
3. Feature adoption
UXCam’s heatmaps feature is ideal for actionable insight into how users interact with new features.
Here’s how they help remove barriers to feature adoption:
Find usability issues: By analyzing gesture-based heatmaps, teams can uncover hidden UI issues, like elements that receive rage taps or are unresponsive.
Focus on critical elements: First-and-last-touch heatmaps indicate which elements users interact with first and last within a session, which can be valuable in understanding a feature's first and last impression.
Optimizing onboarding: Analyzing heatmaps during onboarding can reveal where users drop off and what they struggle with. Improving these areas can increase the likelihood of feature adoption.

Session replays can enhance heatmap findings by showing how users interact with features in context. This can help you better understand their experiences and inform feature adoption strategies.
Case study: Housing.com
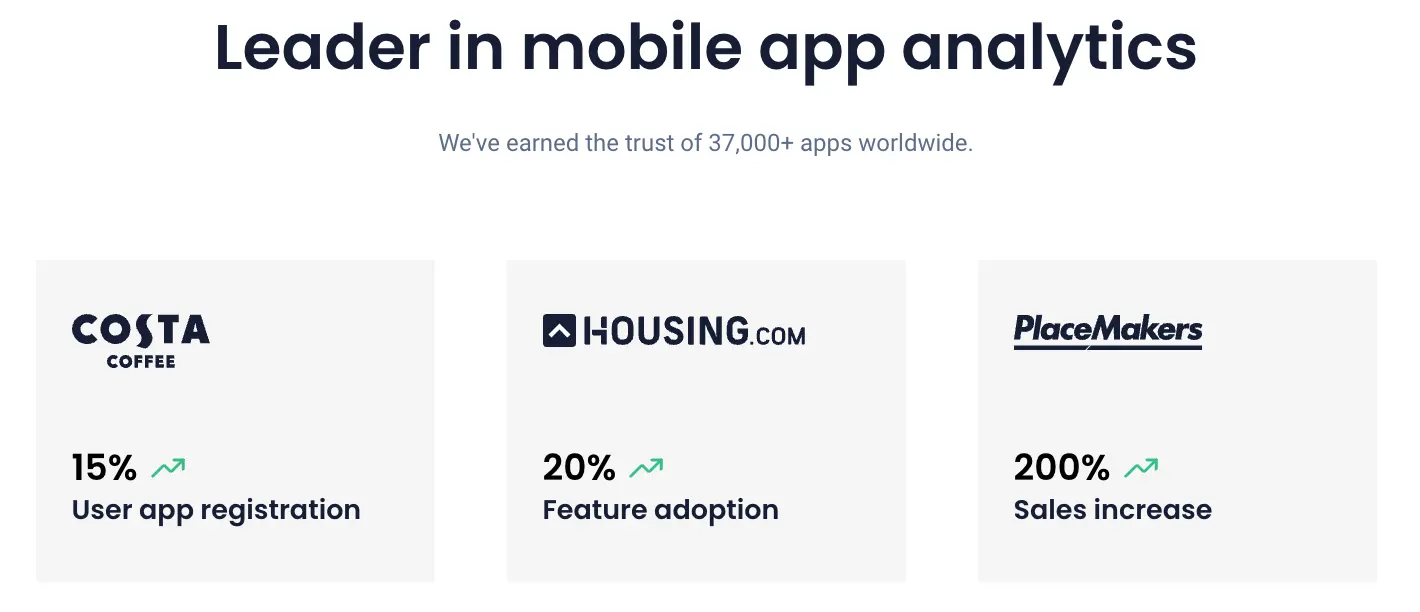
Housing.com faced challenges collecting unbiased user feedback to guide product development and improve feature adoption rates.

By integrating UXCam, they gained access to valuable data through session recordings, event analytics, and heatmaps, which revealed discrepancies between intended feature use and actual user interaction.
Their approach led to a breakthrough in improving the in-app search function, significantly increasing feature adoption by 20%.
4. Churn rate
Our segmentation feature helps product teams significantly understand and analyze churn rates by identifying churn-related patterns and trends.

Here’s how:
Behavioral segmentation: By dividing users by app interactions, like feature usage and session frequency, teams can identify behavior correlating with higher retention or churn rates.
Demographic segmentation: Diving by age, location, device type, etc., reveals how user groups experience the app and their specific churn rates.
Performance and usability issues: Segmenting users by device type or OS can help identify technical issues that may contribute to churn.
5. User retention rate
Our retention analysis delivers a systematic approach to understanding user engagement and loyalty over time.
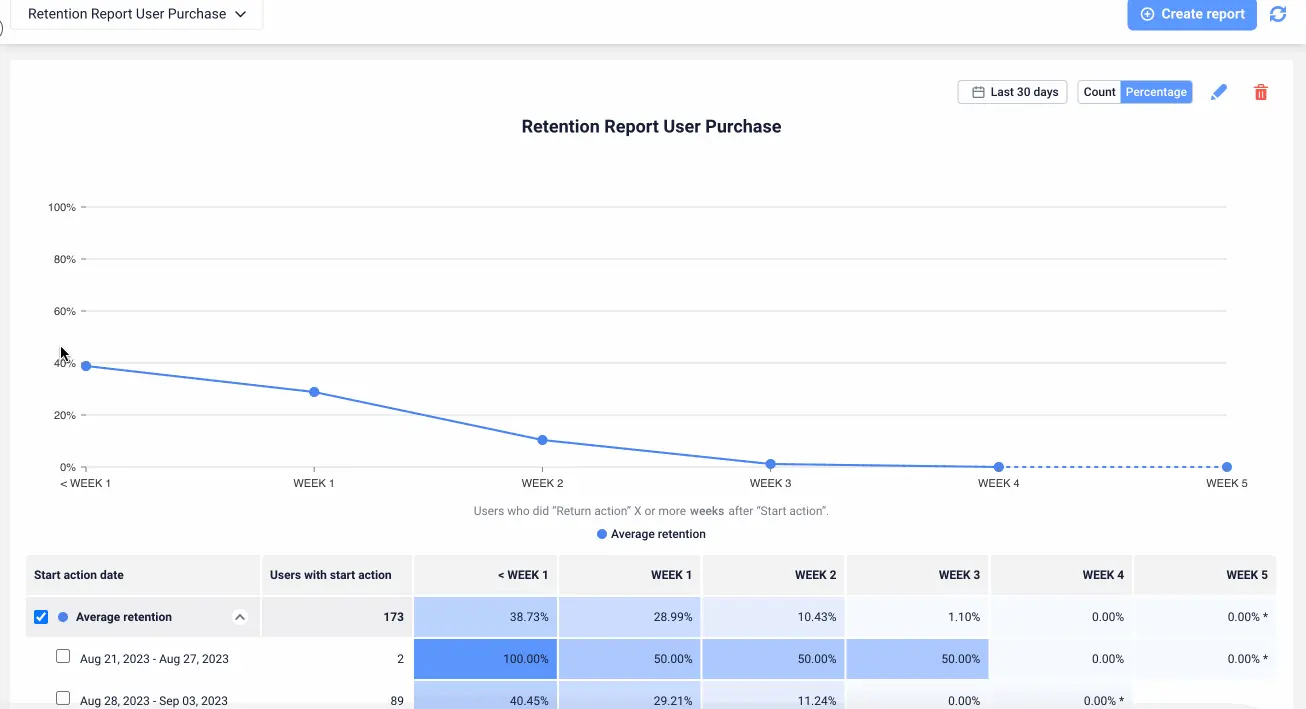
You can create customizable retention reports that specify start and return actions, return intervals, and add filters and cohorts for deeper insights. These reports can help you understand not just how many users return to the app, but also what behavior correlates with higher retention rates.
By segmenting users into cohorts based on shared characteristics or behaviors, UXCam enables detailed analysis of how different groups of users engage with the app over time. This insight can help identify factors contributing to higher retention rates and tailor your strategies accordingly.
Use UXCam to build healthy mobile apps
Tracking metrics like the five we’ve discussed here will give you a comprehensive understanding of your mobile apps’ performance, user engagement, and long-term viability.
UXCam helps teams dissect metric results to uncover and understand underlying issues and provide insight to address issues to enhance product health. Whether through our session replays, funnel analytics, heatmaps, or retention reports, the persistent analysis of product health metrics is critical for product teams striving for excellence and growth.
Ready to ensure the health of your product? Sign up for a free account today.
You might also be interested in these;
Product analytics examples - 5 case studies to inspire you
How to Increase Product Engagement - A Step-by-Step Guide
5 Best product engagement tools & software
Mobile App Heatmaps - definition, best practices and tools
AUTHOR

Tope Longe
Product Analytics Expert
Ardent technophile exploring the world of mobile app product management at UXCam.
What’s UXCam?
Related articles
Product best practices
Top 11 Remote Usability Testing Tools You Can Use Now
Usability testing tools that will put your mind at...

Jonas Kurzweg
Product Analytics Expert
Tara AI
How teams use Tara as their AI product analyst
A practical guide on how product teams use Tara as their AI product analyst; from diagnosing drop-offs to prioritizing what to fix next and making better decisions,...

Begüm Aykut
Growth Marketing Manager
App Analytics
Top Analytics SDKs 2026
Pick the right analytics SDKs to improve your app's...

Jonas Kurzweg
Product Analytics Expert

