Flutter Crashlytics - Integration Guide for Your Mobile Apps
When developing a Flutter application, stability is key. Crashes disrupt this experience and can lead to user frustration and attrition. Effective crash reporting helps you identify and fix issues quickly, maintaining your app's reliability and reputation.
Firebase Crashlytics is a robust, real-time crash reporting tool offered by Firebase. It provides detailed crash reports, highlighting the exact line of code that caused the crash. This allows you to diagnose and resolve issues swiftly. With Crashlytics, you gain insights into the context and severity of crashes, helping you prioritize fixes.
For your Flutter app, integrating Crashlytics is a strategic move. Flutter, known for its cross-platform capabilities, allows you to build beautiful, natively compiled applications for mobile, web, and desktop from a single codebase. However, with this versatility comes the complexity of managing app stability across different platforms. In this guide, we explore how to add Firebase Crashlytics to your Flutter app, covering setup, configuration, and usage to automatically capture crashes, log custom errors, and send non-fatal reports. Additionally, you will learn how integrating UXCam with Firebase Crashlytics can provide deeper insights into crashes, helping you understand user actions leading up to the issues and compare crash logs for a comprehensive analysis.
How to integrate Crashlytics in your Flutter app
To set up Firebase for your Flutter app, you begin by creating a Firebase project and installing the Firebase CLI and FlutterFire. Configuring Firebase in your Flutter project ensures a seamless integration. Once the foundation is ready, you can integrate Crashlytics by adding the Crashlytics dependency, initializing it within your app, and configuring automatic crash reporting.
Beyond basic setup, Firebase Crashlytics offers advanced features such as logging custom errors and exceptions. Custom keys can be added for better context in crash reports. Managing non-fatal errors effectively and testing your Crashlytics implementation ensures reliability.
Analyzing crash reports involves navigating through the Firebase Crashlytics dashboard. Here, you interpret crash data and stack traces to prioritize issues based on their impact. This holistic approach allows you to maintain app stability and enhance user experience.
Setting up Firebase for Flutter
Creating a Firebase Project
Start by creating a Firebase project. Go to the Firebase console, click "Add Project," and follow the prompts. This step sets up the foundation for integrating Firebase services into your Flutter app.
Installing Firebase CLI and FlutterFire
Next, install the Firebase CLI. This tool helps manage Firebase projects from the command line. Follow the Firebase CLI setup guide. Once installed, use it to set up Firebase in your Flutter project.
Install the FlutterFire CLI to simplify Firebase integration with Flutter. Follow the FlutterFire documentation to add the necessary dependencies to your project.
Configuring Firebase in your Flutter project
With your Firebase project set up, configure it in your Flutter app. Add the google-services.json file for Android and GoogleService-Info.plist for iOS, as guided by the Firebase setup documentation. Initialize Firebase in your Flutter project to complete the setup.
Integrating Crashlytics into your Flutter app
Adding crashlytics dependency
To add Crashlytics, include the Crashlytics dependency in your project's pubspec.yaml file. This step ensures that Crashlytics is integrated into your app.
Initializing Crashlytics in your app
Initialize Crashlytics in your app to start capturing crashes. This involves configuring your main.dart file to handle errors and report them to Crashlytics.
Configuring automatic crash reporting
Enable automatic crash reporting by updating your Android and iOS configurations. Follow the Firebase Crashlytics documentation for detailed steps on configuring these settings.
Advanced Crashlytics Features
Logging custom errors and exceptions
Capture more context by logging custom errors. This helps in understanding specific issues that may not result in a crash but still affect user experience. Refer to the Firebase documentation for details on how to implement this.
Adding custom keys for better crash context
Add custom keys to provide additional context to crashes. This practice helps in diagnosing issues more effectively by giving insights into the app's state during the crash.
Handling non-fatal errors
Log non-fatal errors to identify and fix issues that don't crash the app but degrade user experience. This proactive approach helps in maintaining app stability and performance.
Testing crashlytics implementation
Verify your Crashlytics setup by forcing test crashes. This ensures everything is correctly configured and reporting as expected. Check the Firebase documentation for guidelines on how to test your implementation.
Analyzing crash reports
Navigating the Firebase Crashlytics dashboard
Access the Crashlytics dashboard from the Firebase console. Here, you can view detailed reports of crashes, including stack traces and logs. This interface helps in understanding the root causes of crashes.
Interpreting crash data and stack traces
Analyze crash data by examining stack traces. This process helps identify the exact lines of code causing issues. Utilize custom keys and logs to provide additional context and insights.
Prioritizing issues based on impact
Focus on the most critical issues by prioritizing crashes based on their frequency and impact. Use the analytics provided in the dashboard to make informed decisions on which bugs to fix first.
By following these steps, you ensure a robust integration of Firebase Crashlytics into your Flutter app, providing valuable insights and improving app stability. For more details, refer to the official Firebase Crashlytics documentation.
Enhancing crash analysis with UXCam integration
While Firebase Crashlytics provides excellent crash reporting, integrating UXCam takes your analysis to the next level. UXCam is a powerful user experience analytics platform that offers session replay, heatmaps, and user flow analysis. By combining UXCam with Crashlytics for your Flutter apps, you gain a holistic view of your app's performance and user behavior.

UXCam's key benefits include:
Visual context for crashes
While Firebase Crashlytics focuses on capturing and reporting crashes, UXCam provides detailed insights into user sessions. This includes:
Session Replays: UXCam records user sessions, allowing developers to replay the actions leading up to a crash. This visual context can be invaluable in understanding the exact sequence of events that caused the issue.
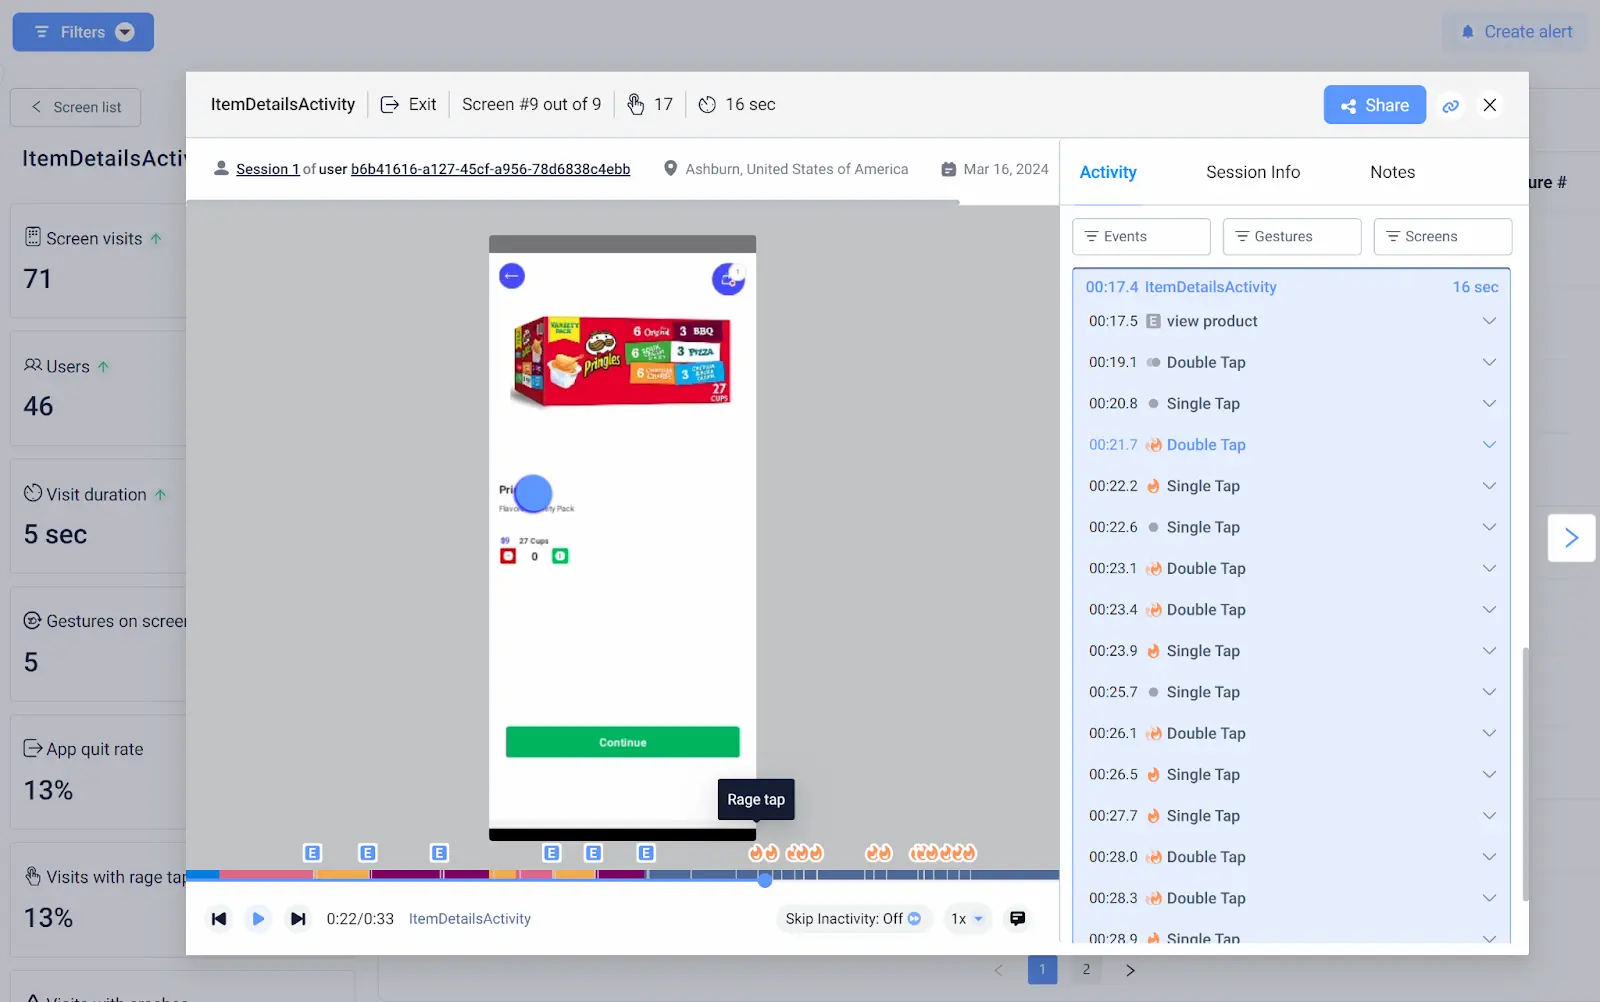
Heatmaps: UXCam generates heatmaps showing where users are interacting most with the app. This can help identify problematic areas that might be contributing to crashes.

User journey analysis
UXCam captures extensive user data, which can complement the crash reports from Firebase Crashlytics:
User journeys: By understanding the user’s journey through the app, developers can see the steps taken before a crash, providing context that raw crash logs might miss.
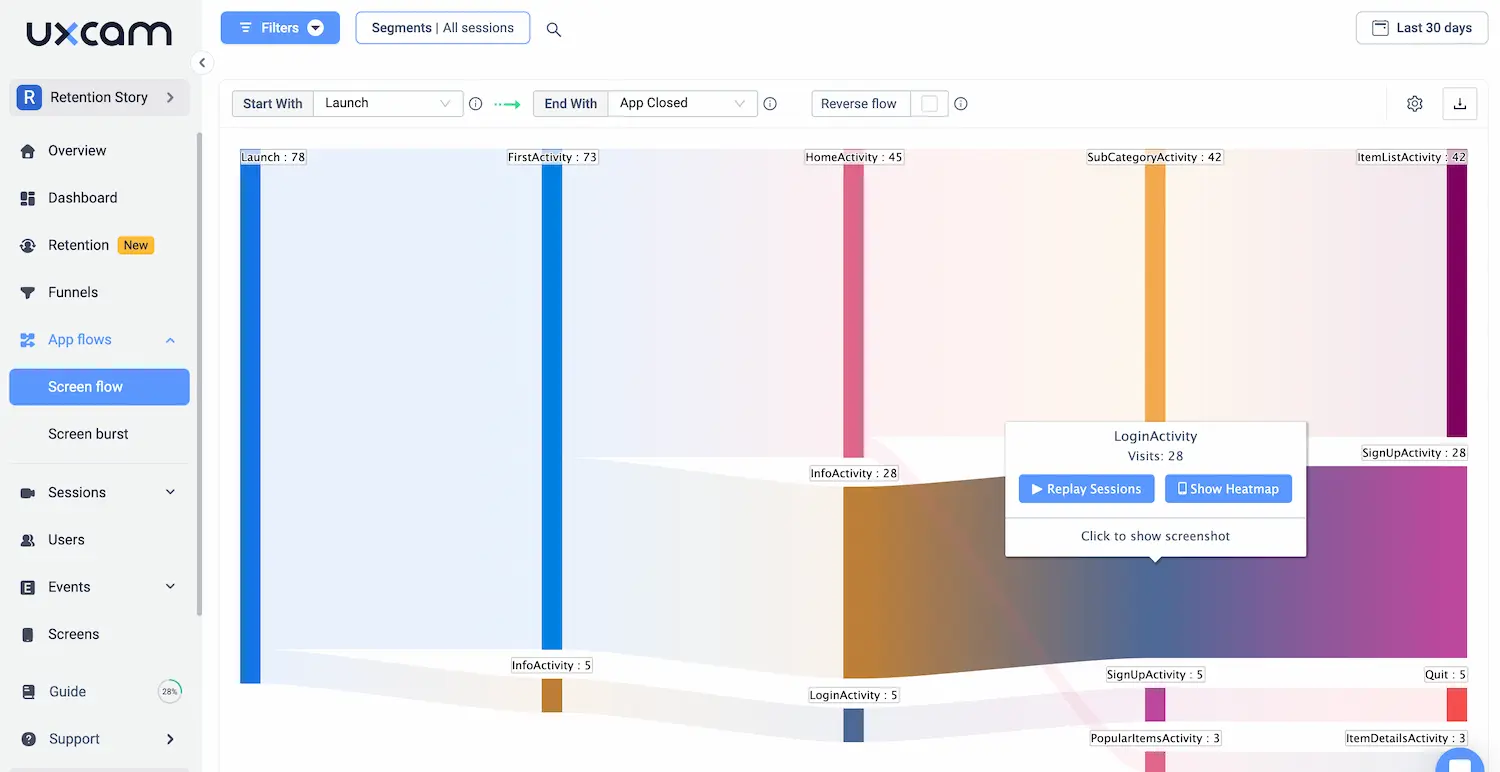
Behavioral analytics: UXCam’s analytics can highlight patterns in user behavior that correlate with crashes, such as specific actions or navigation paths that frequently lead to issues.
Detailed error context
While Firebase Crashlytics provides detailed stack traces and logs, UXCam adds another layer of context:
Custom events and logs: UXCam allows developers to log custom events and errors, which can be correlated with the crash data from Crashlytics for a fuller picture.
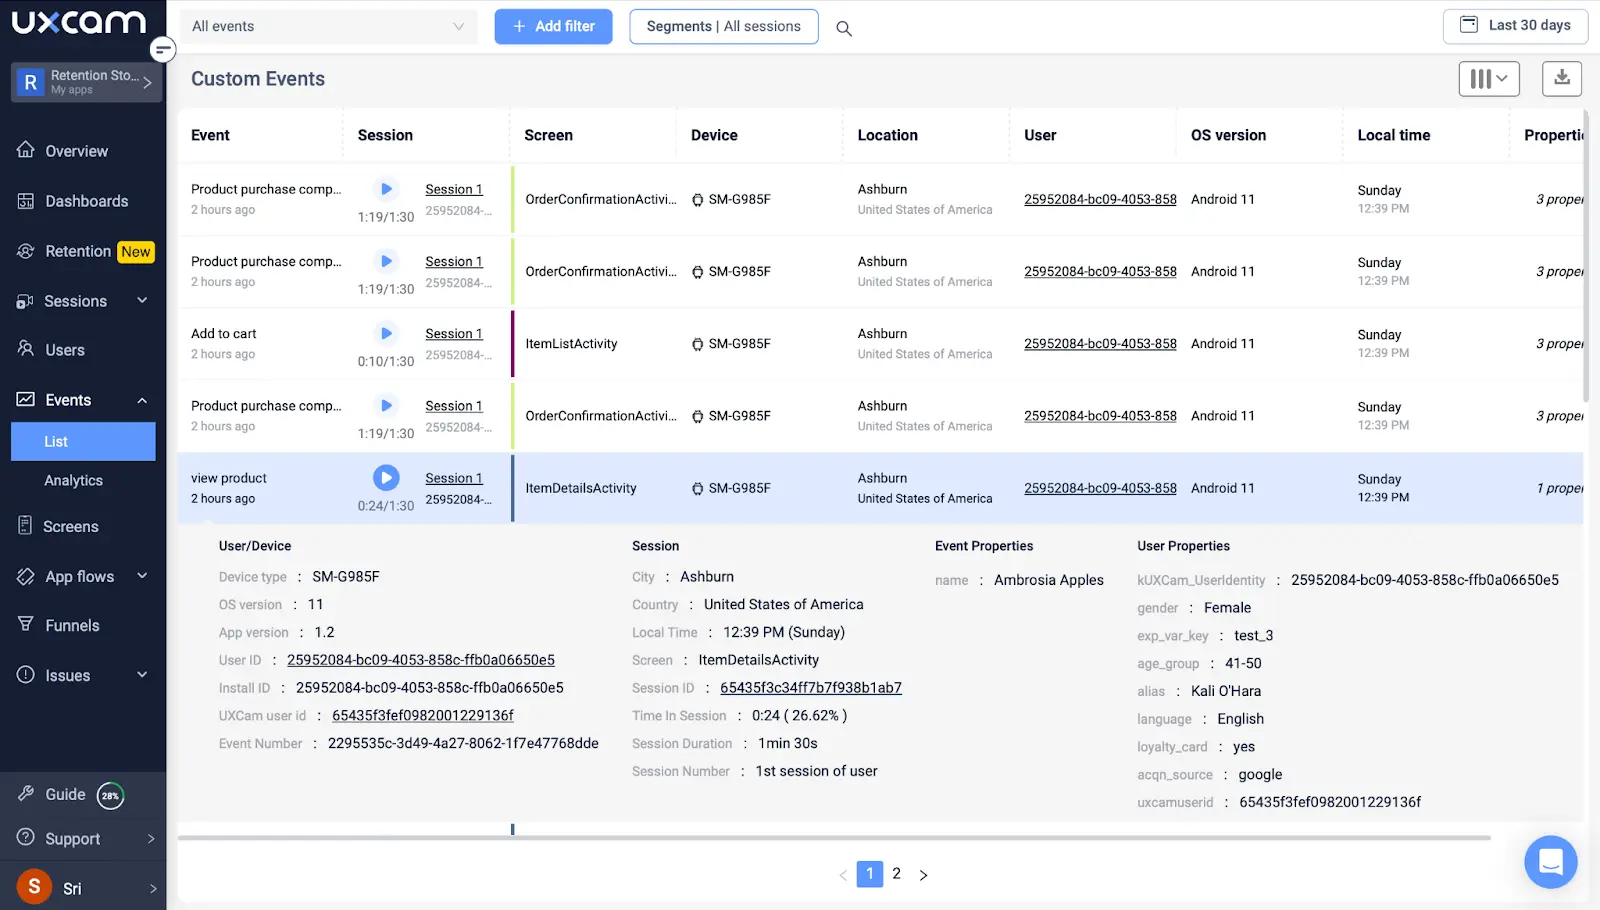
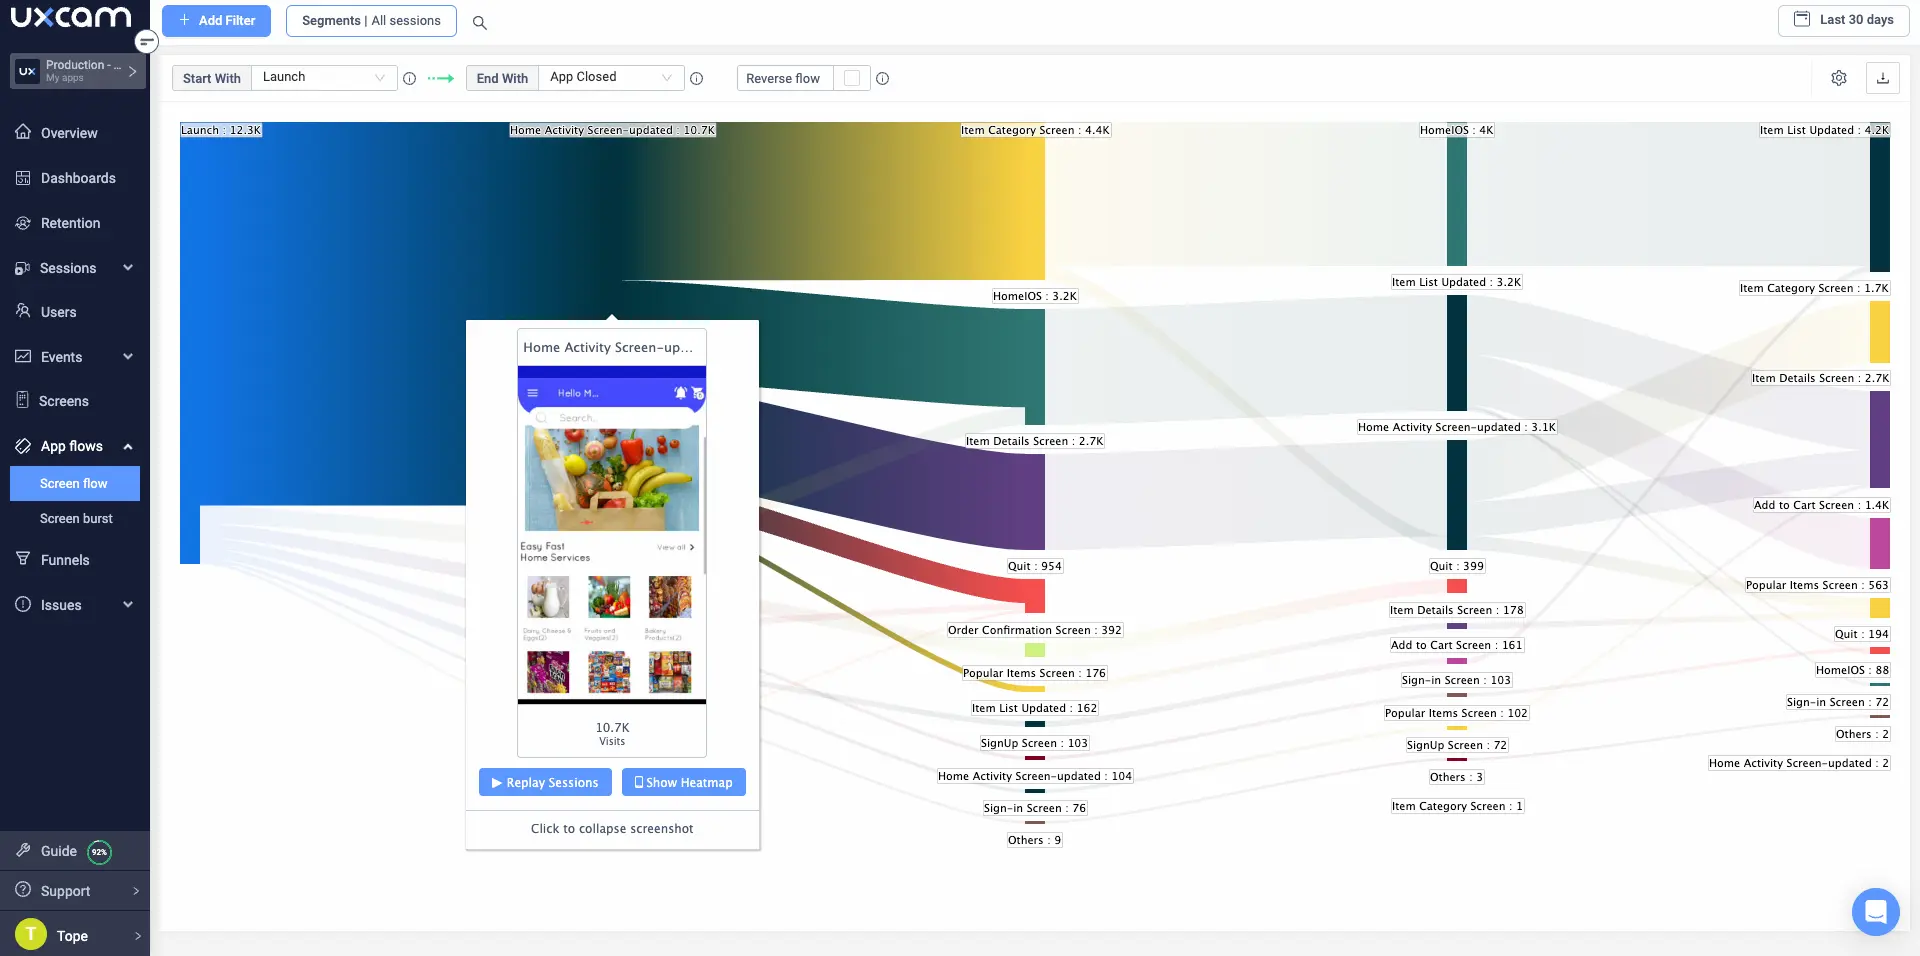
Screen flow analysis: UXCam’s screen flow analysis shows the screens users visited before the crash, helping to pinpoint the problematic areas.
Performance Monitoring
Both tools together provide a more rounded view of app performance:
Real-time monitoring: UXCam’s real-time monitoring complements Crashlytics by providing immediate insights into user interactions and performance issues that might lead to crashes.
Performance metrics: UXCam tracks performance metrics such as load times and UI responsiveness, which can help identify performance-related crashes.
Actionable Insights
Combining the strengths of both tools leads to more actionable insights:
Prioritizing fixes: With UXCam’s user session data and Crashlytics’ crash reports, developers can better prioritize fixes based on the severity and frequency of crashes, as well as the impact on user experience.
Holistic debugging: The combination allows for a more holistic debugging process, where developers can see both the technical details of the crash and the user’s perspective.
Steps to Integrate UXCam with Firebase Crashlytics
To get started, you need to add the UXCam SDK to your Flutter project and configure it to work alongside Firebase Crashlytics.
Adding UXCam SDK to the Flutter project
First, add the UXCam SDK to your Flutter project. Include the UXCam dependency in your pubspec.yaml file. Follow the instructions in the UXCam documentation to complete the setup.
Configuring UXCam alongside Crashlytics
Once UXCam is added, configure it to start recording sessions. Initialize UXCam in your main.dart file along with Crashlytics. Ensure both tools are set up to work seamlessly together. Detailed configuration steps can be found in the UXCam setup guide.
This integration allows you to correlate crash reports with UXCam session recordings. When a crash occurs, you can now view the user's actions leading up to the event, providing invaluable context for debugging and user experience improvement.
To leverage this combined power:
Investigate crash reports in the Firebase Console as usual.
When you find a critical issue, look for the UXCam URL in the custom keys section of the crash report.
Use this URL to view the associated session replay in UXCam.
This workflow offers several advantages:
Visualize the exact user interactions that led to the crash
Identify any UI/UX issues that might have contributed to the problem
Understand the impact on user experience beyond just the crash itself
Prioritize fixes based on both technical and user experience factors
How UXCam enhances crash insights
Combining quantitative crash data with qualitative user behavior insights, equips you to make more informed decisions about bug fixes and feature improvements. This integrated approach not only helps resolve issues faster but also contributes to overall product strategy by aligning technical performance with user needs. Let's explore you can use UXCam to enhance crash insights;
Issue analytics for Flutter with UXCam
With UXCam's Issue Analytics feature, you can easily analyze crashes and UI freezes, helping you quickly identify and fix any issues. Whether you're a seasoned developer or a product manager, Issue Analytics is the perfect solution for keeping your Flutter app in top shape.
To get started, you need to decide if you want to focus on analyzing crashes or UI Freezes and go to the proper section:
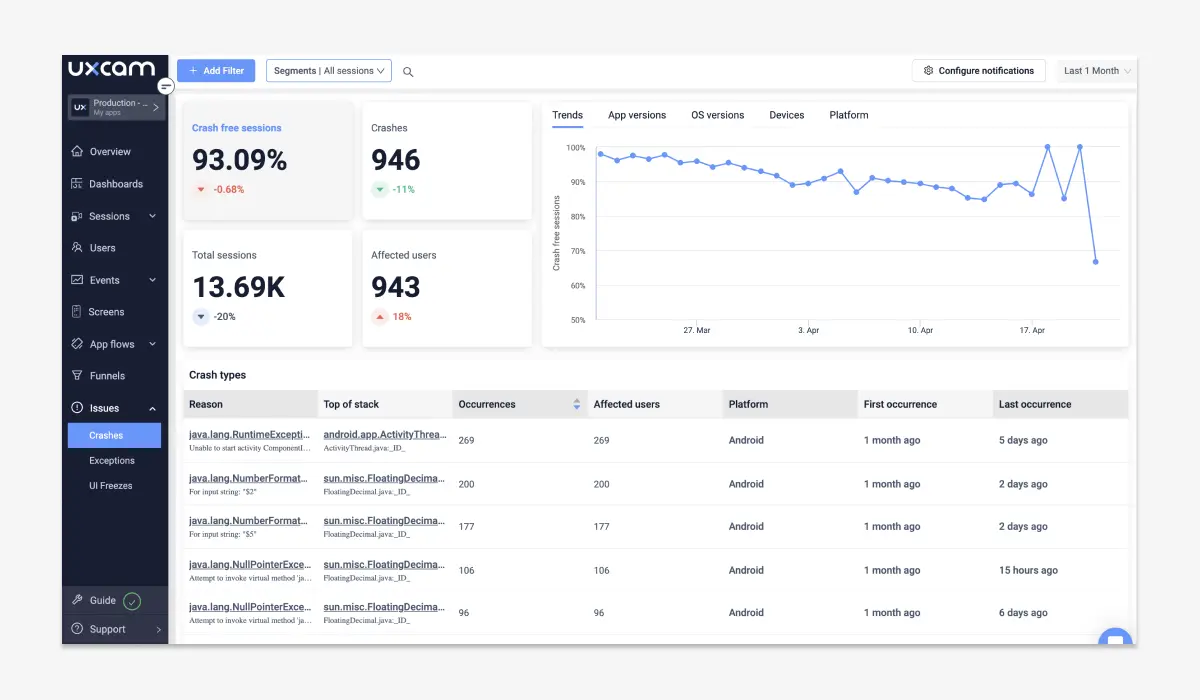
Next, you can review basic statistics about the issues detected in your app. This will include the number of crashes or UI freezes that occurred, the total number of affected users and sessions, and the percentage of sessions that remained unaffected by any issues.
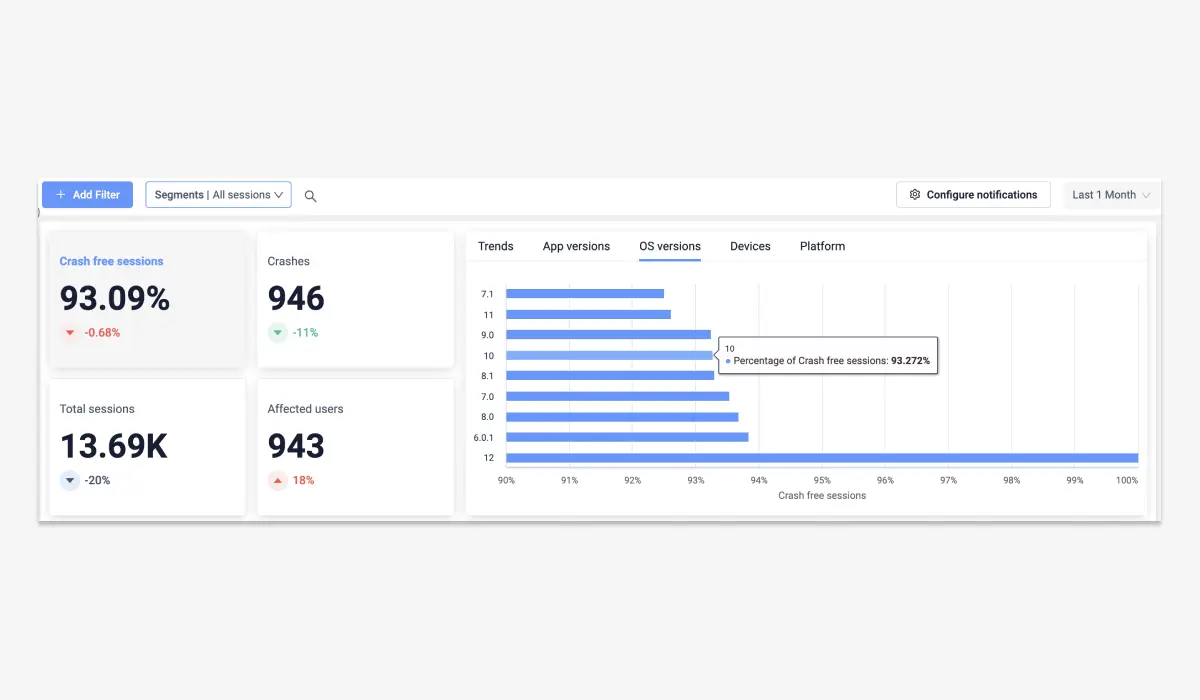
Additionally, you can review trends to gain a better understanding of whether the number of issues is increasing or decreasing over time. This will enable you to identify which app versions, OS versions, or devices are causing the most problems. With this insight, you can prioritize and debug the issues, allowing you to deliver effective solutions faster.
Tracking app crashes in Flutter
UXCam allows you to monitor crash and error reports across your Flutter projects running on Android, iOS, or similar mobile development frameworks.
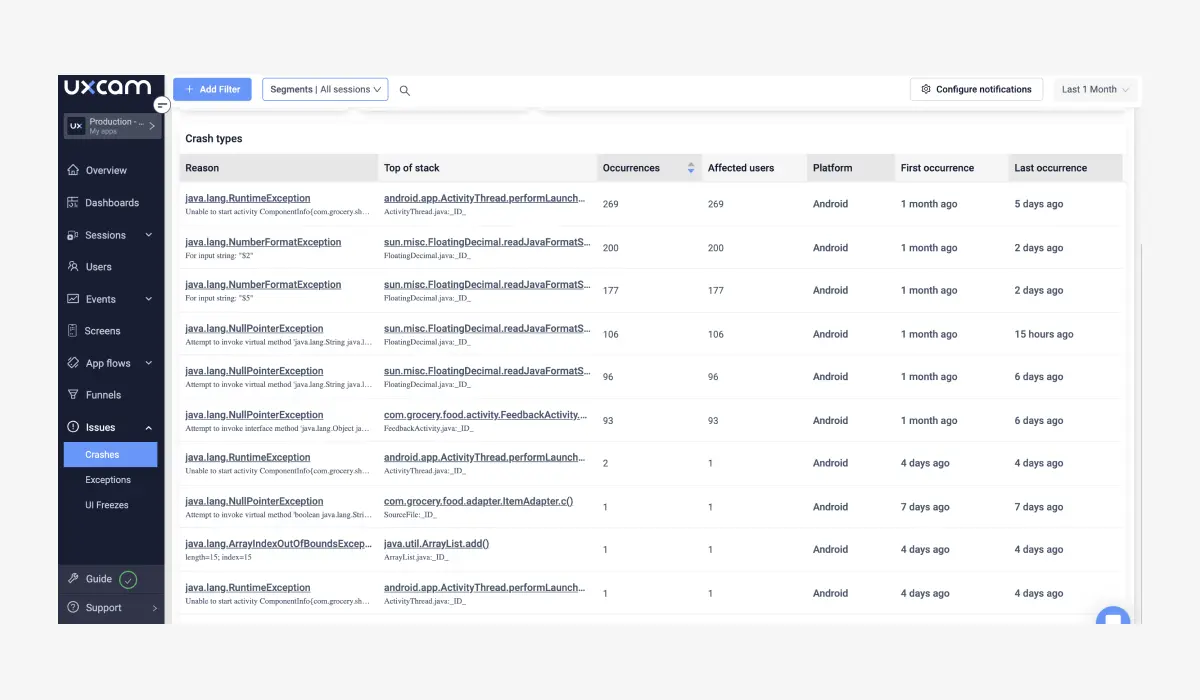
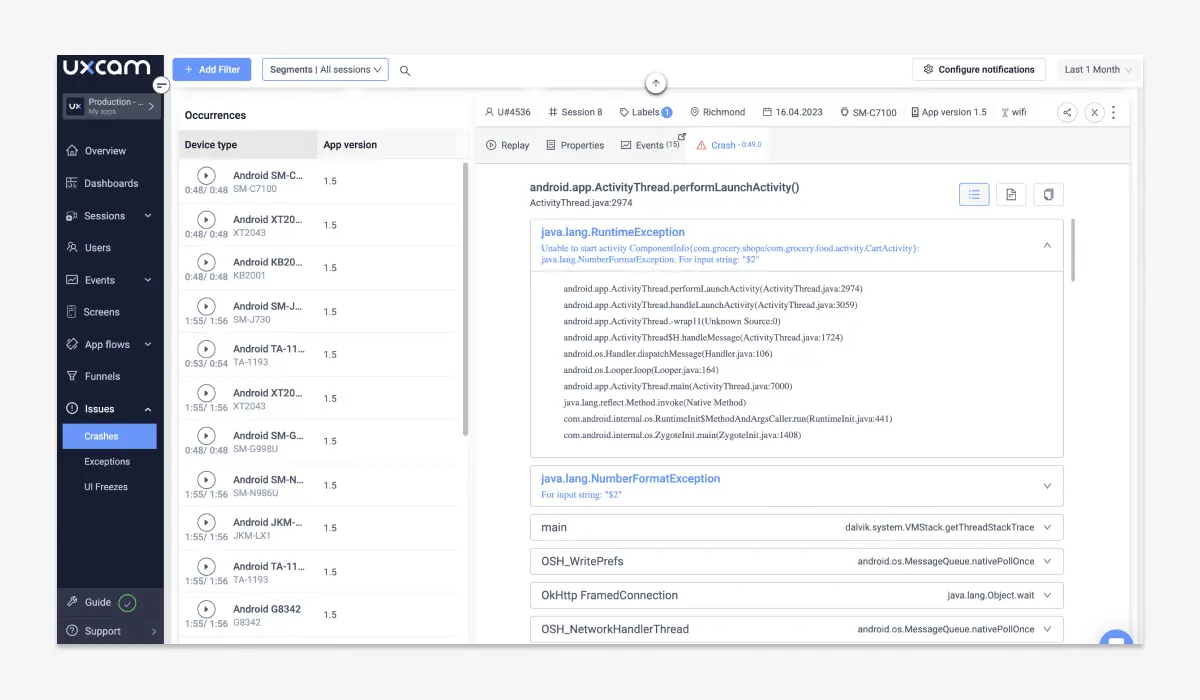
Looking to understand the types and causes of a flutter app crash? Navigate to "Crash types", to view a comprehensive list of crashes, which includes critical details such as the cause, frequency of occurrence, number of affected users, and platform.
UI freezes analytics in Flutter apps with UXCam
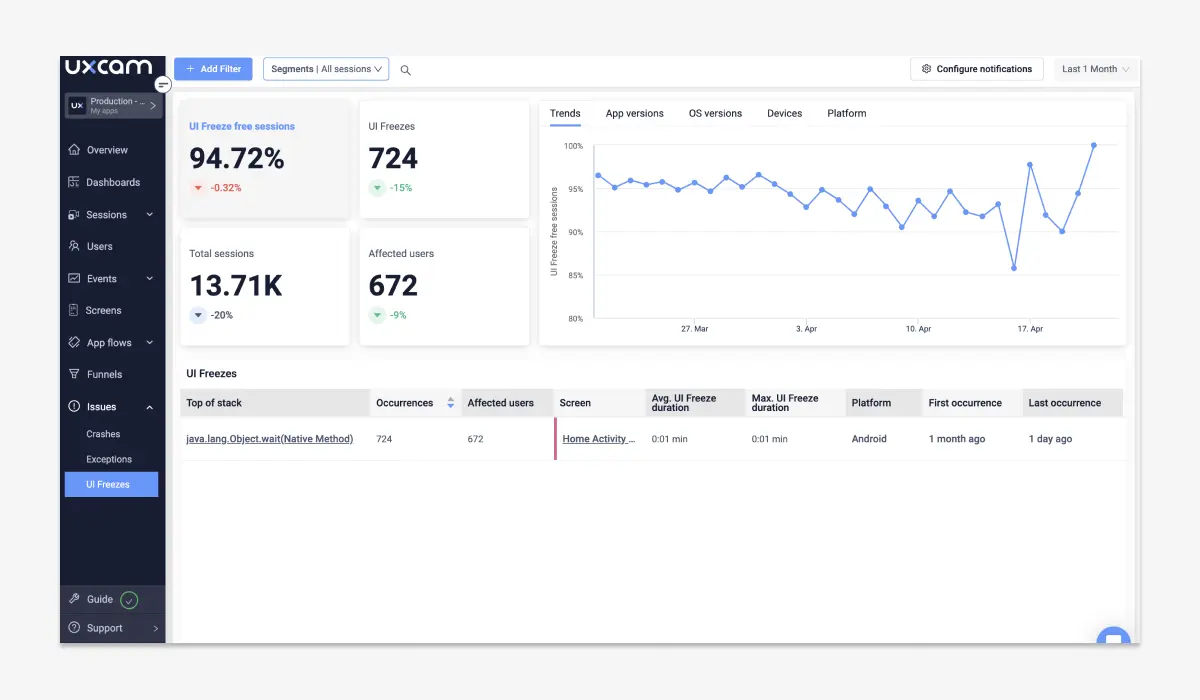
Navigating to "UI Freezes" in UXCam, you can explore all types of freezes and obtain relevant information such as the average or maximum duration of each freeze.
Dig deeper into issues
If you wish to investigate any issue further, you can click on it to access the crash/UI Freeze log, view detailed statistics about the issue, and review the list of sessions that were impacted by the issue with actual session replay. This will give you a comprehensive understanding of the issue, including insights into the steps necessary to replicate it, debug and resolve the error more efficiently. Furthermore, you can also click on the user to gain a deeper understanding of how the technical problem impacted their behavior.
Instant crash notifications
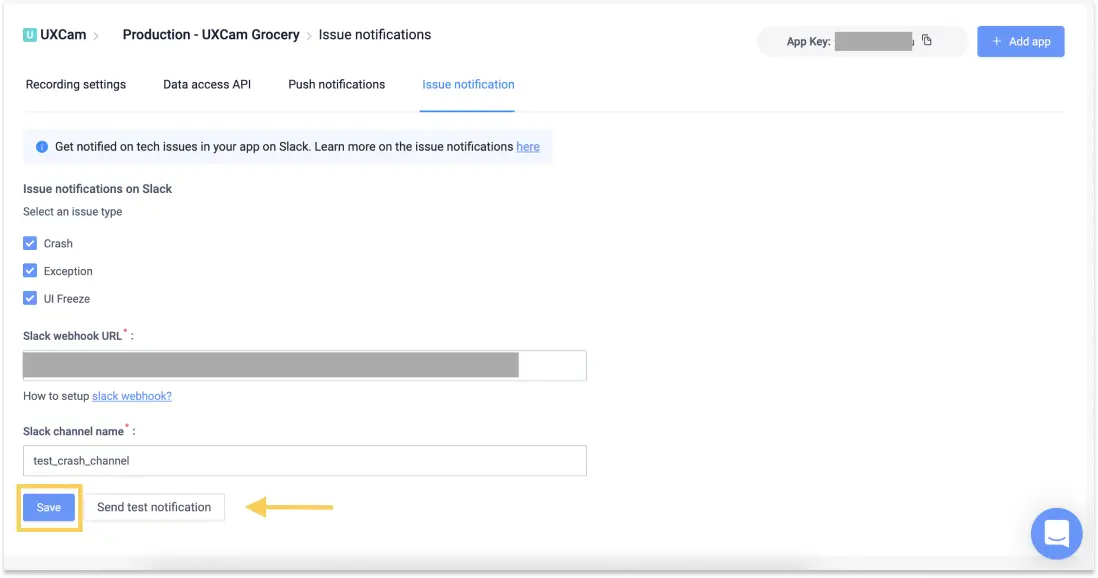
If you don't want to miss any technical issues and you want to react quickly, turn on the Slack notifications in UXCam and choose to receive notifications for Crashes, UI Freezes, or/and Handled Exceptions.
Conclusion
Integrating Firebase Crashlytics into your Flutter app is a crucial step to ensure the stability and reliability of your application. With its powerful real-time crash reporting features, automatic capture of crashes, and extensive error logging capabilities, Crashlytics allows you to maintain and improve your app's quality effectively.
When you combine the detailed insights from Firebase Crashlytics with the rich visual context provided by UXCam, you pave the way for a comprehensive understanding of user issues. This dual integration not only helps in diagnosing and resolving crashes faster but also enhances the overall user experience by minimizing disruptions and ensuring a smoother application performance.
Ready to take your crash analysis to the next level? Try UXCam for free today and unlock deeper insights into your app's performance!
You might also be interested in these;
Crashlytics React Native Integration Guide + Best Alternative
Flutter In-App Purchase - Using Analytics to Grow Revenue
Flutter Crash Reporting - Best Tools and Techniques
Flutter Mobile App Session Recording & Replay Tool: UXCam
Sentry vs Crashlytics - Features, Pricing Comparison & Best Alternative
AUTHOR
Tope Longe
Product Analytics Expert
Ardent technophile exploring the world of mobile app product management at UXCam.

Related articles
App Analytics
Top 19 Mobile App Analytics Tools in 2026
Choosing the best mobile app analytics tools and platforms for your app can be overwhelming. We did the research, so you don't have...

Jonas Kurzweg
Product Analytics Expert
App Analytics
Best Android App Analytics Tools in 2026
Discover the top 8 Android analytics including UXCam, Firebase, and Flurry Analytics. Compare features, pricing, and platforms...

Annemarie Bufe
Product Analytics Expert
Curated List
Top 19 Mobile App Analytics Tools in 2026
Discover the top mobile analytics tools in 2026. Compare features, pricing, and reviews to choose the right platform for app tracking, behavioral insights, and data-driven...

Jonas Kurzweg
Product Analytics Expert

