Top 6 LogRocket Alternatives for Product Analytics
The process of iterating on a product should never feel like guesswork. You need to have the data on hand to make targeted improvements that resonate with real users.
How do you get this data? There are a bunch of ways—but having a solid product analytics & application performance monitoring tool is an essential first step.
LogRocket is a powerful tool for this. But if it doesn't quite fit your needs, there are plenty of alternatives out there to choose from — including UXCam!
What are the best alternatives to LogRocket?
The top five best alternatives to LogRocket for product analytics and error tracking for mobile apps are UXCam, Dynatrace, Datadog, New Relic, AppDynamic, and Sentry.
Top Logrocket alternatives
In a rush? No worries—here's a list of all the tools we'll be covering and our main reasons for including them:
UXCam: Best Overall Choice for Mobile Product Teams
Dynatrace: Best for AI-Powered Insights
Datadog: Best for Total Application Visibility
New Relic: Best for Cost-Effective Full-Stack Monitoring
AppDynamic: Best for Business-First Observability
Sentry: Best for Reliable Bug Tracking
Let's dive into what makes these tools suitable alternatives to Logrocket.
UXCam
Best Overall Choice for Mobile Product Teams
UXCam is a mobile app analytics platform designed to put your data to work.
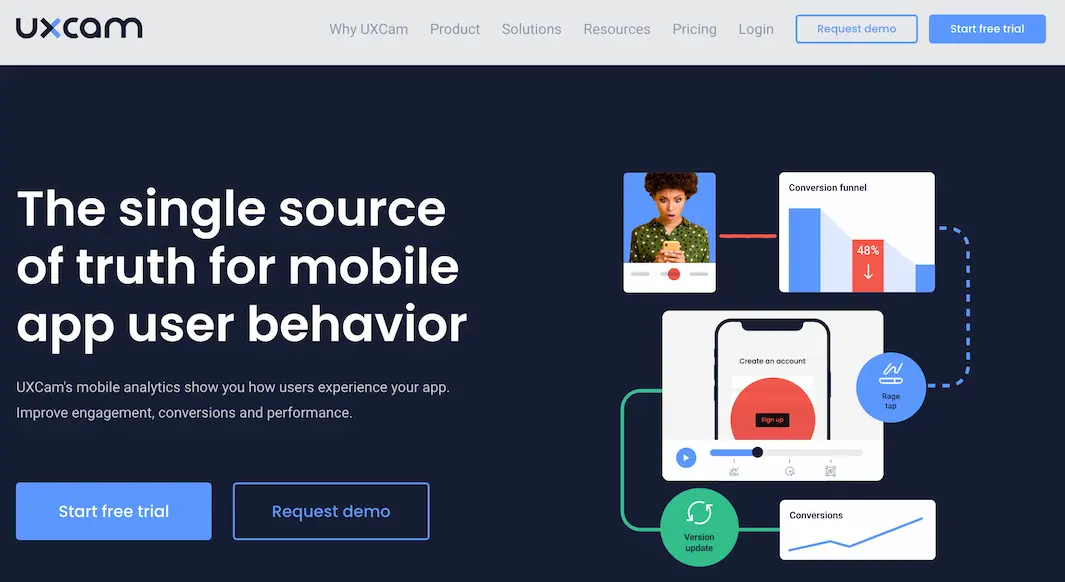
Our tool automatically captures every in-app interaction—from taps and swipes to UI freezes and purchases—giving you a complete overview of user behavior. This data is then visualized through heatmaps, funnels, session replays, and other analytics to help you gain insights into user engagement, spot trends, and identify areas of improvement.
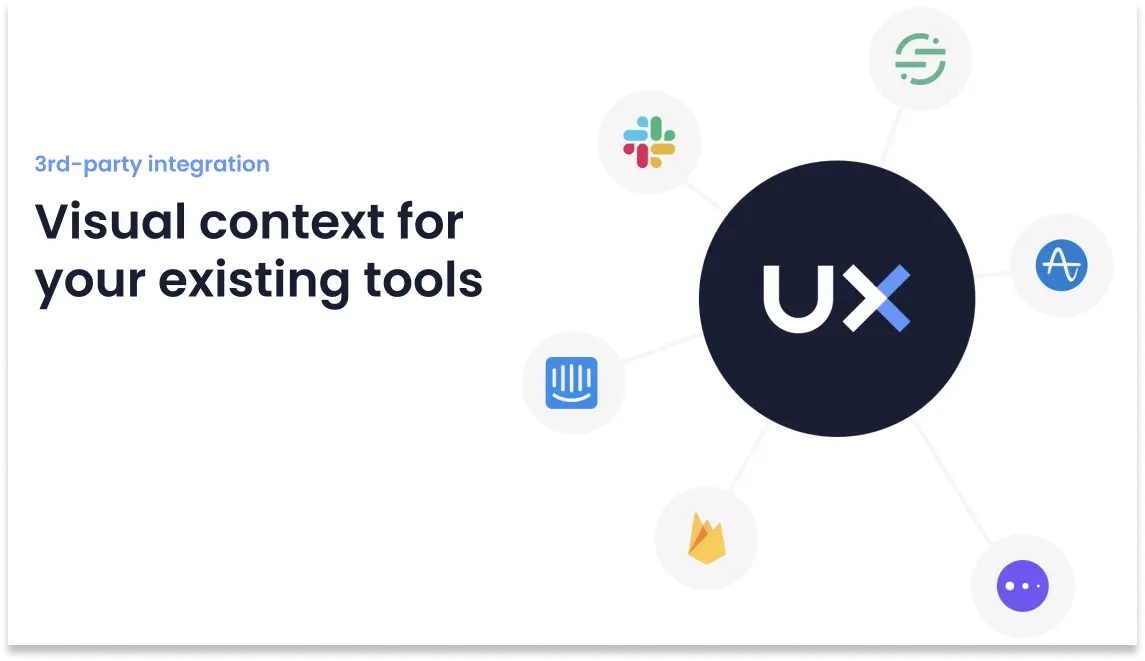
Plus, UXCam offers powerful integrations with other top tools, including Amplitude, Mixpanel, Intercom, Segment, and Firebase Crashlytics.
Key features
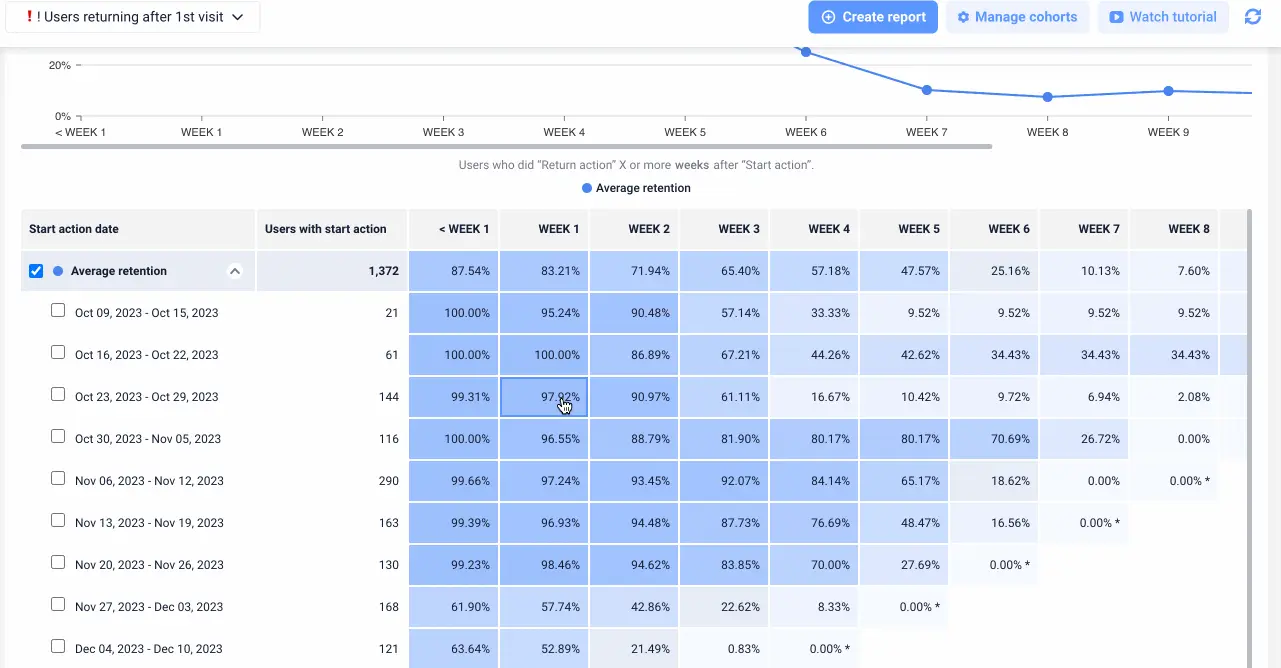
Retention Analytics: Delve deep into user interactions with UXCam's retention analytics to uncover patterns, behaviors, and critical touchpoints that drive retention.
Session Replays: Capture user sessions and watch them back to get the full context surrounding UI freezes, errors, and bugs.
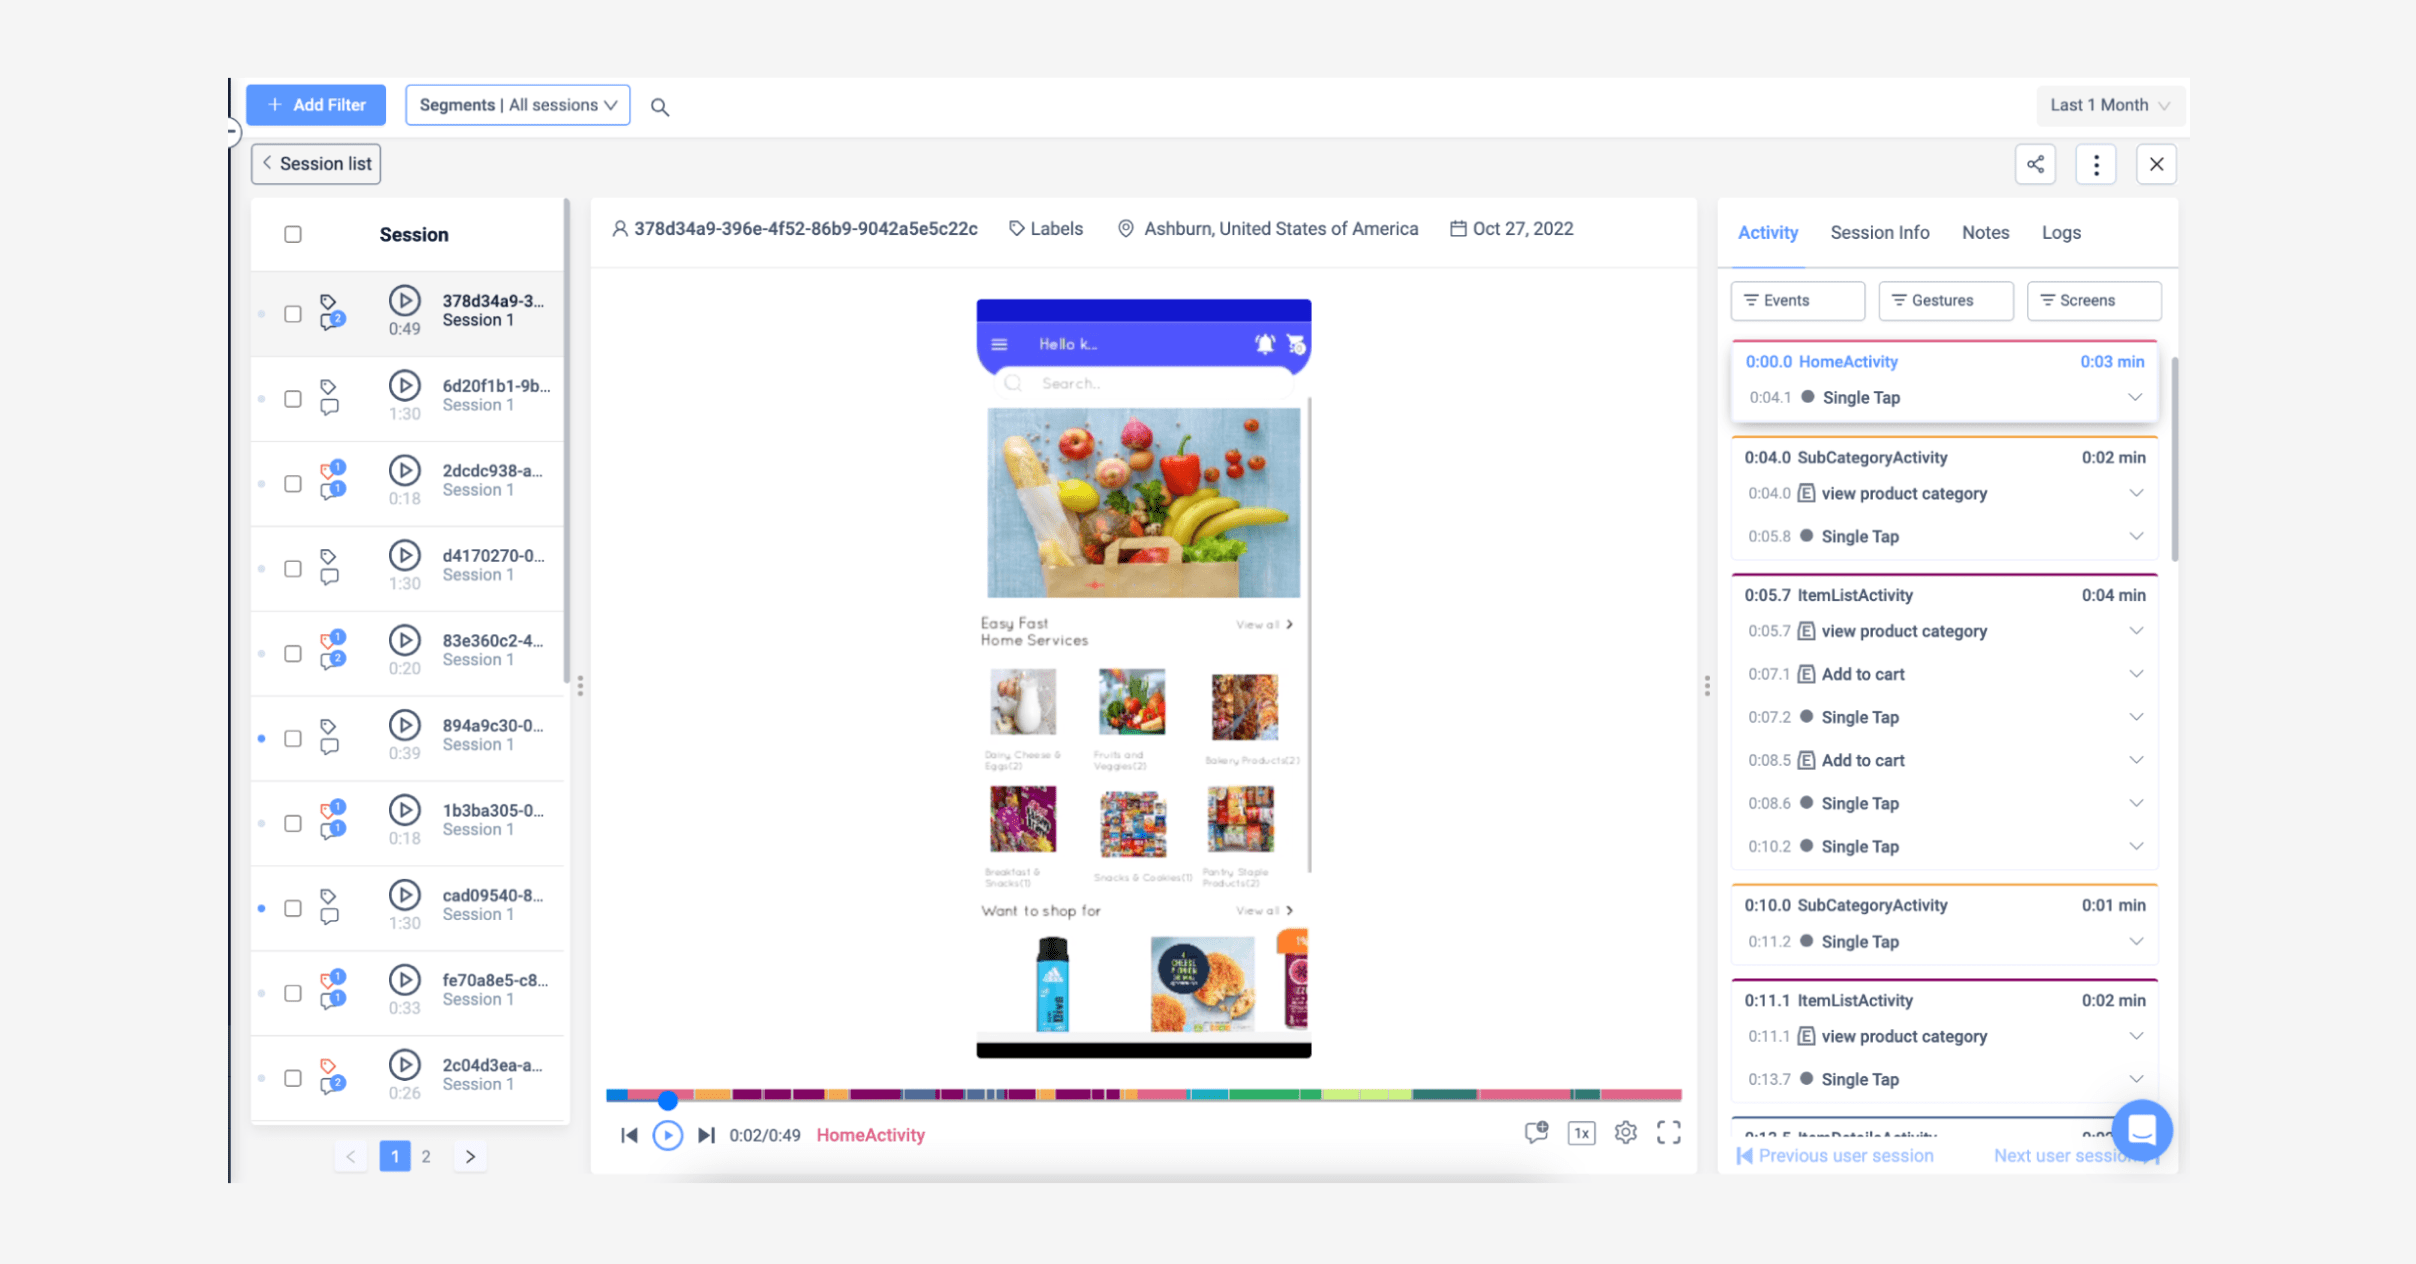

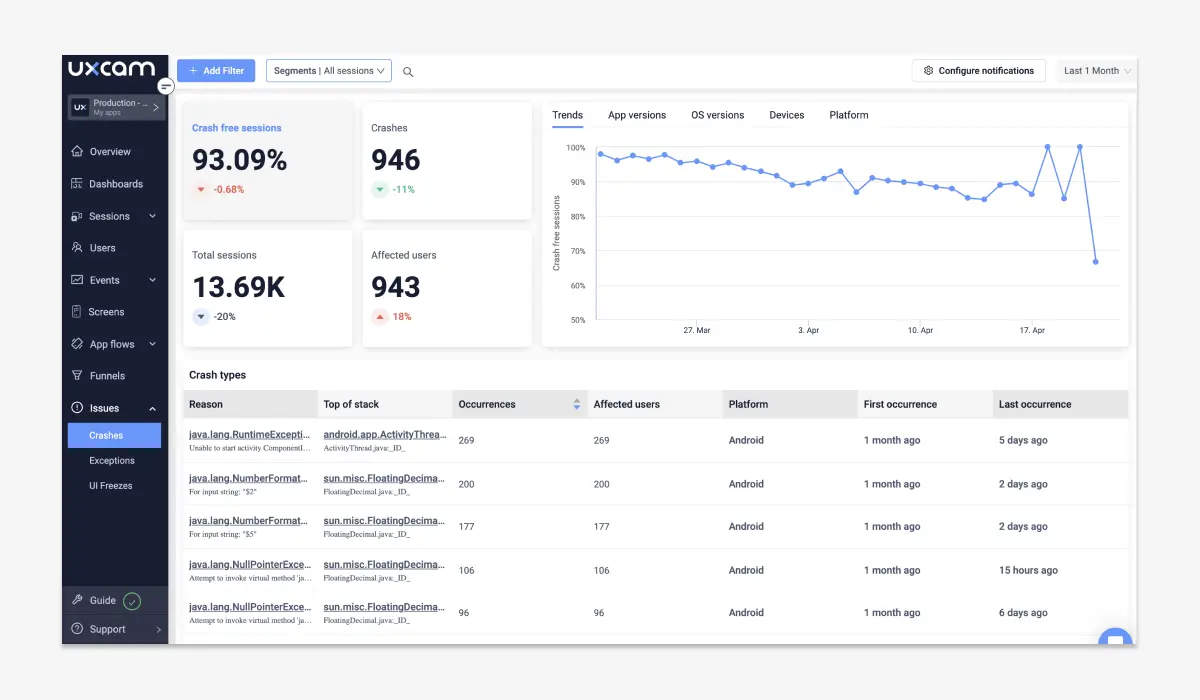
Issue Analytics: Automatically detect bugs, crashes, and other issues. Track issue occurrences over time, link them to business impacts and look for patterns that uncover preventative fixes.
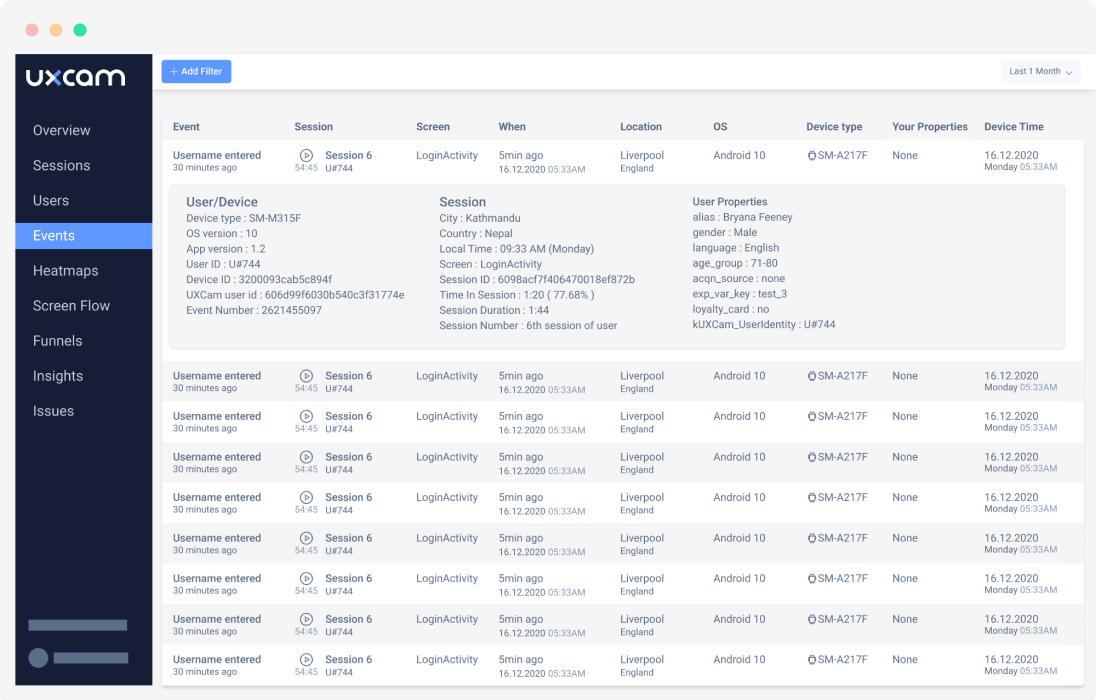
Event Analytics: Get step-by-step insights into user behavior, complete with alerts and custom events.

Integrations: Integrate UXCam into your tech stack to pair session replays and event logs with the specific support tickets, bug reports, and product analytics they generate.
Pricing
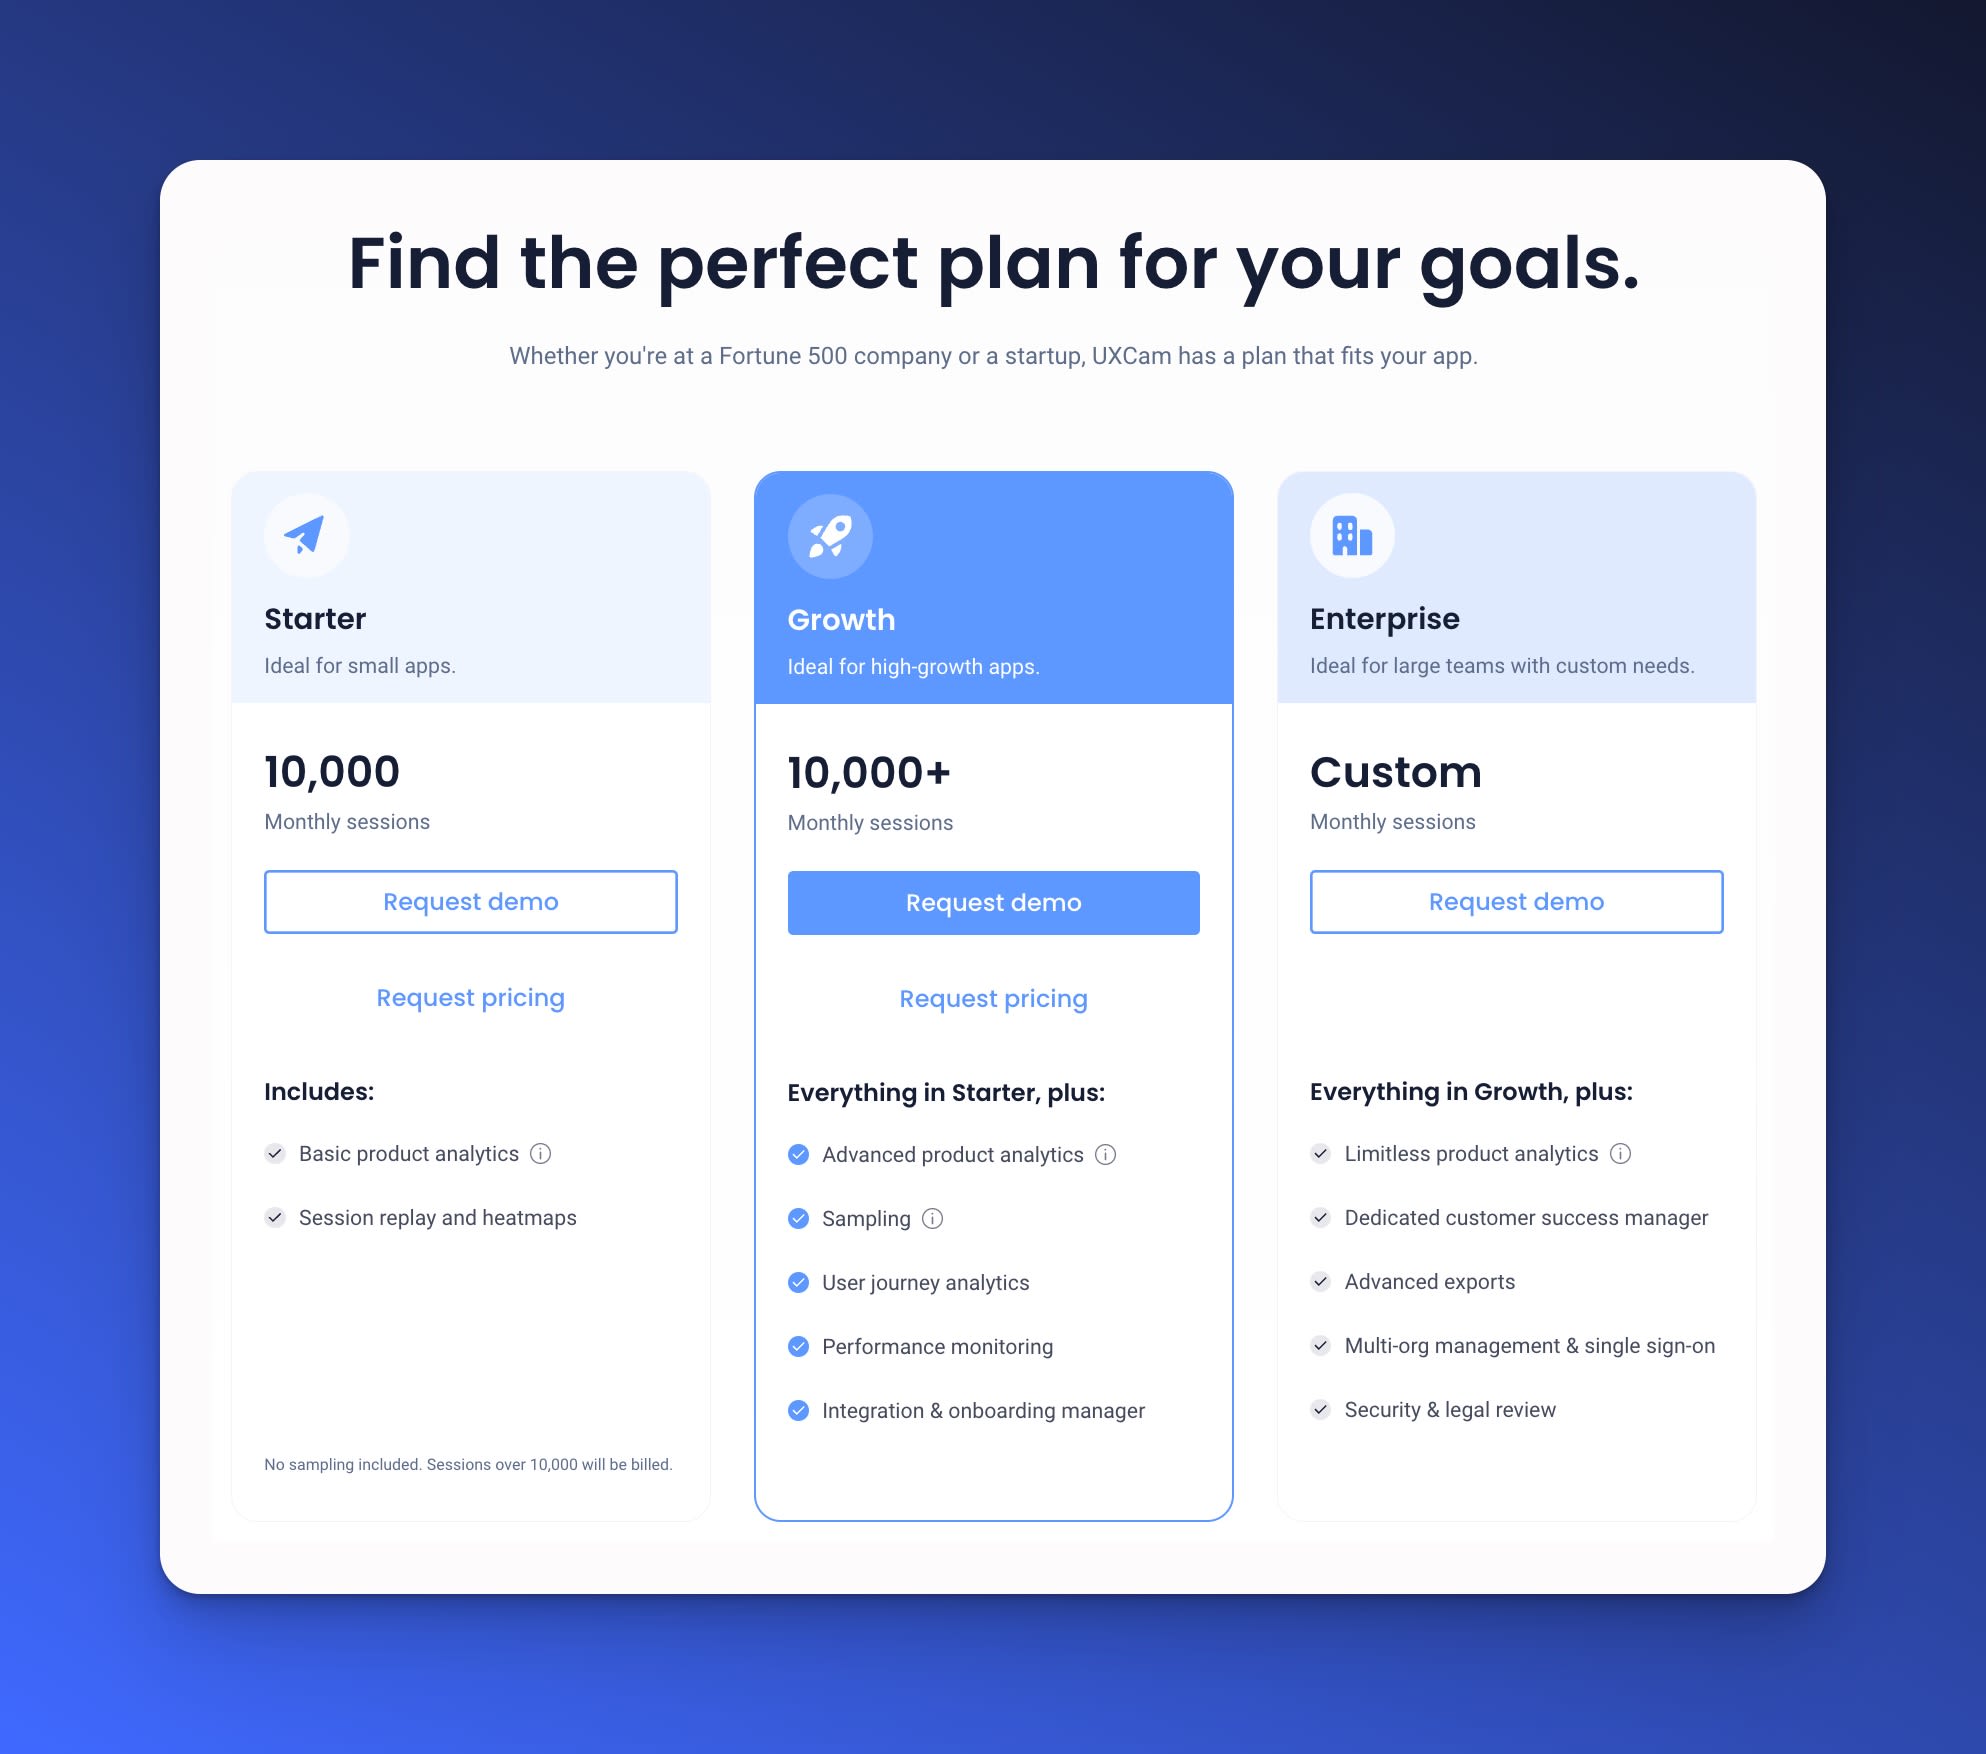
Our Free plan accommodates an unlimited number of users and grants them access to all of UXCam’s features—from funnels and session replays to event analytics and user journeys.
Are you looking for more than 10,000 tracked sessions monthly? We’ll work with you to tailor a plan to your needs. Plus, you can always try out UXCam’s paid plans with a 14-day free trial!

Pros & Cons
Pros
All plans support unlimited users
All plans support advanced features
Provides a comprehensive view of user behavior
Offers insights into issues and frustrations
Fully customizable dashboards and reports
Cons
No publicly available pricing
Fewer integrations than some competitors
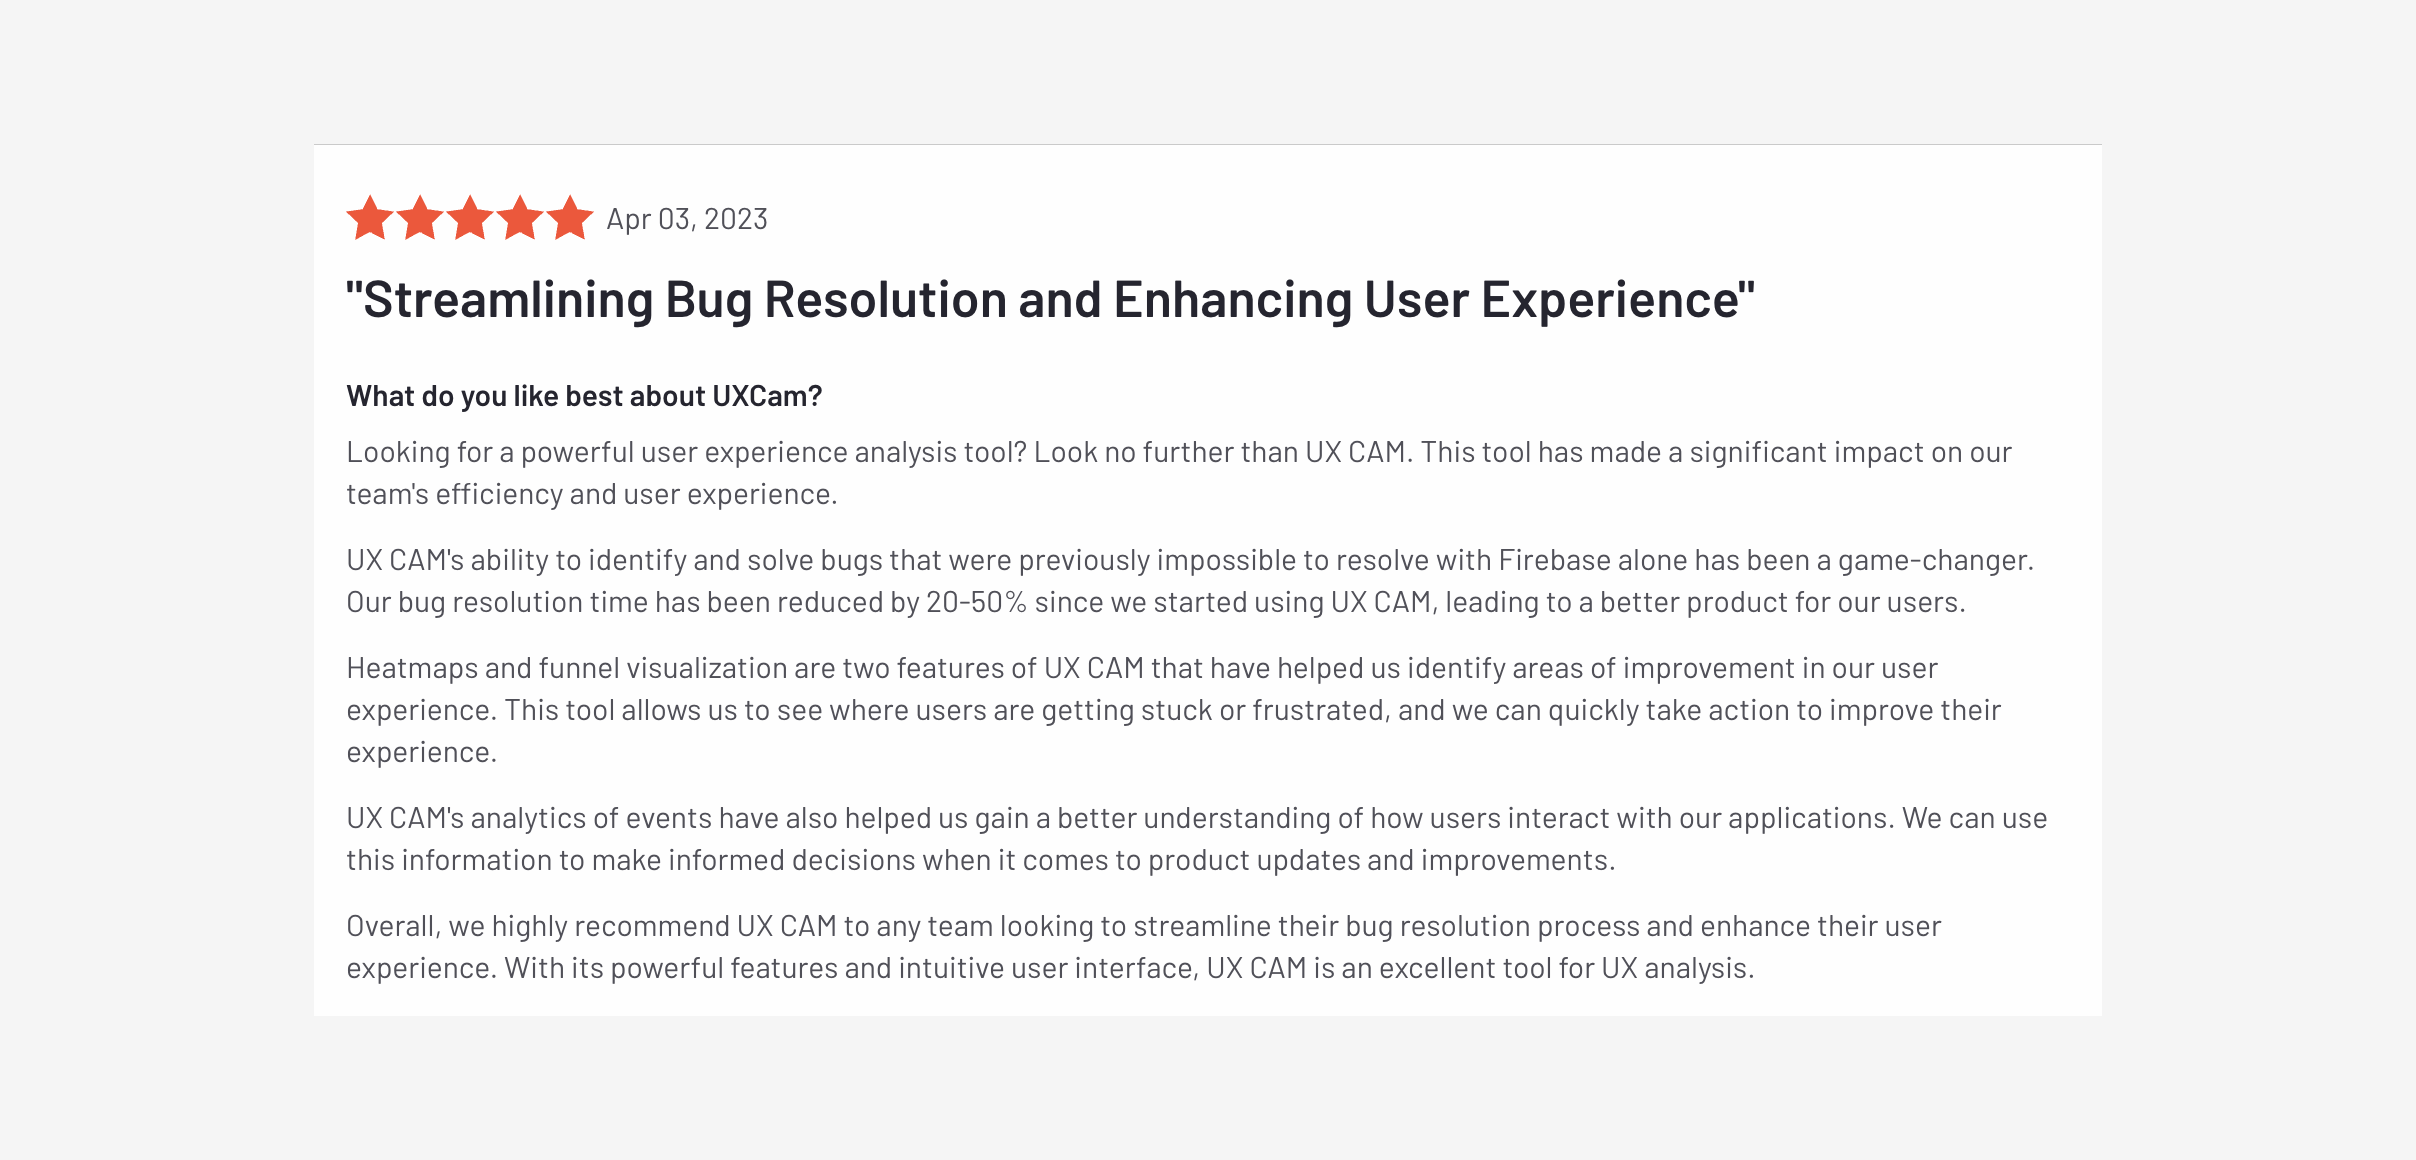
What customers say about UXCam

Dynatrace
Best for AI-Powered Insights
Dynatrace is an all-in-one application monitoring platform designed for the modern cloud.
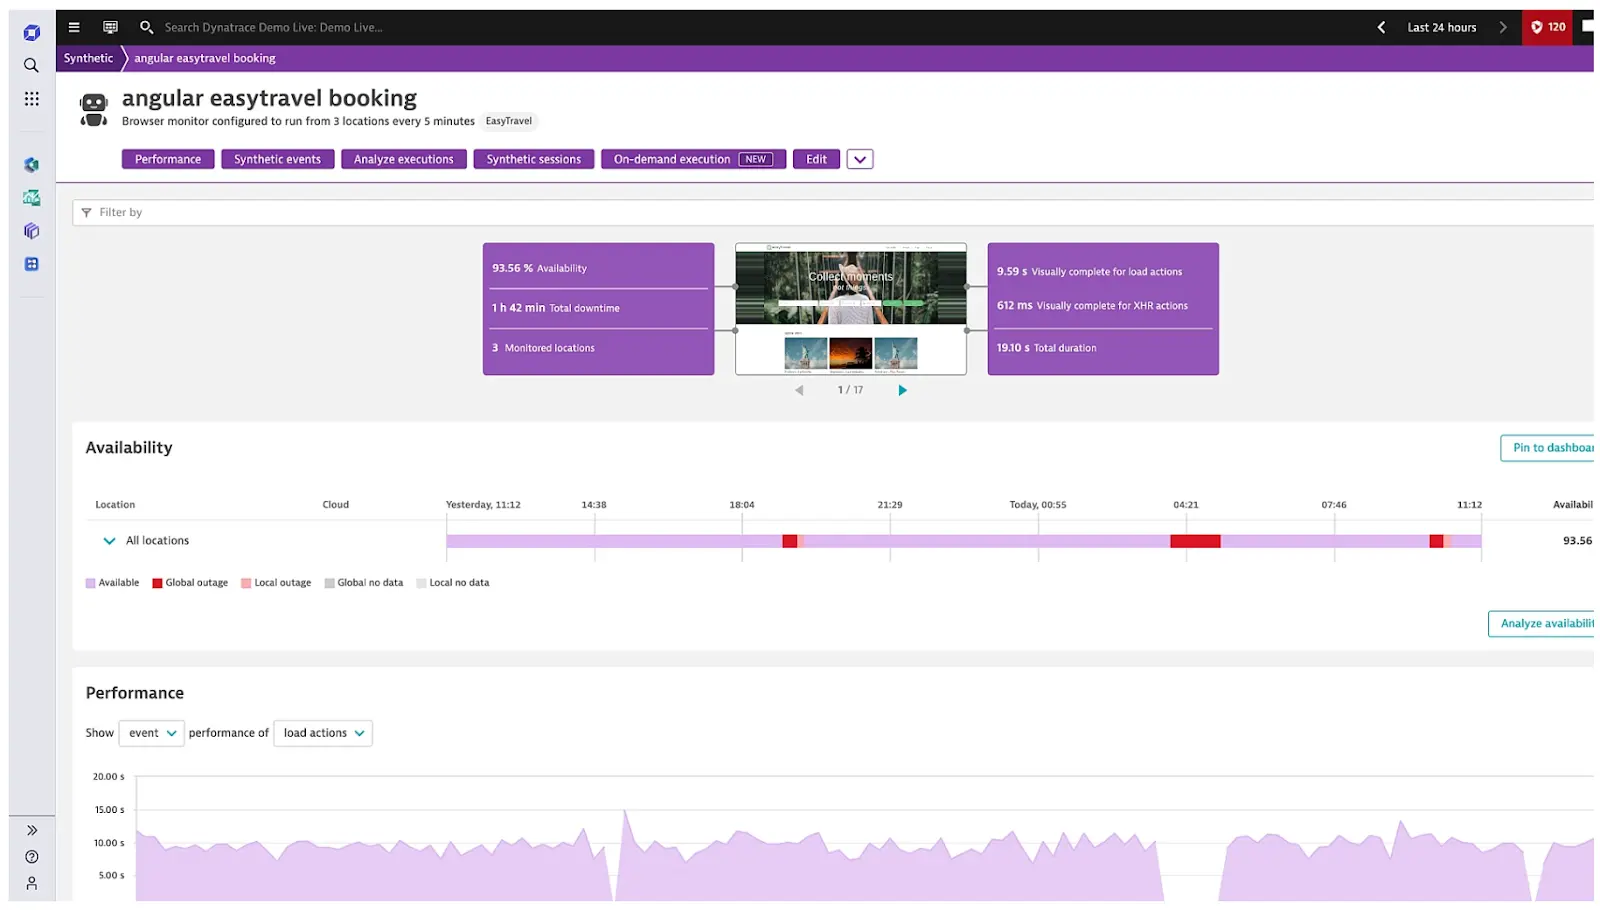
One of Dynatrace’s main selling points is Davis—an AI model that provides automated problem detection, root cause analysis, and performance optimization advice. With Davis on your team, you can quickly identify bottlenecks and deliver more reliable applications to users—no data scientists needed.
Key Features
Synthetic Monitoring: Test your application performance from multiple locations around the world.
Real-User Monitoring: Gain insights into how real users are using your applications.
Error Detection: Detect and diagnose application errors quickly.
Pricing
Dynatrace lets users create fully custom plans based on the specific features they need—perfect for scaling up or down as needed.
Digital experience monitoring starts at $11/month, and full-stack monitoring starts at $74/month.
Pros & Cons
Pros
Surprisingly simple setup
Wide range of features and services
Highly scalable
Ai-powered insights
Cons
No free tier
Subpar support
Could be easier to use
Datadog
Best for Total Application Visibility
Datadog is one of the most comprehensive application monitoring tools out there—if not the most.
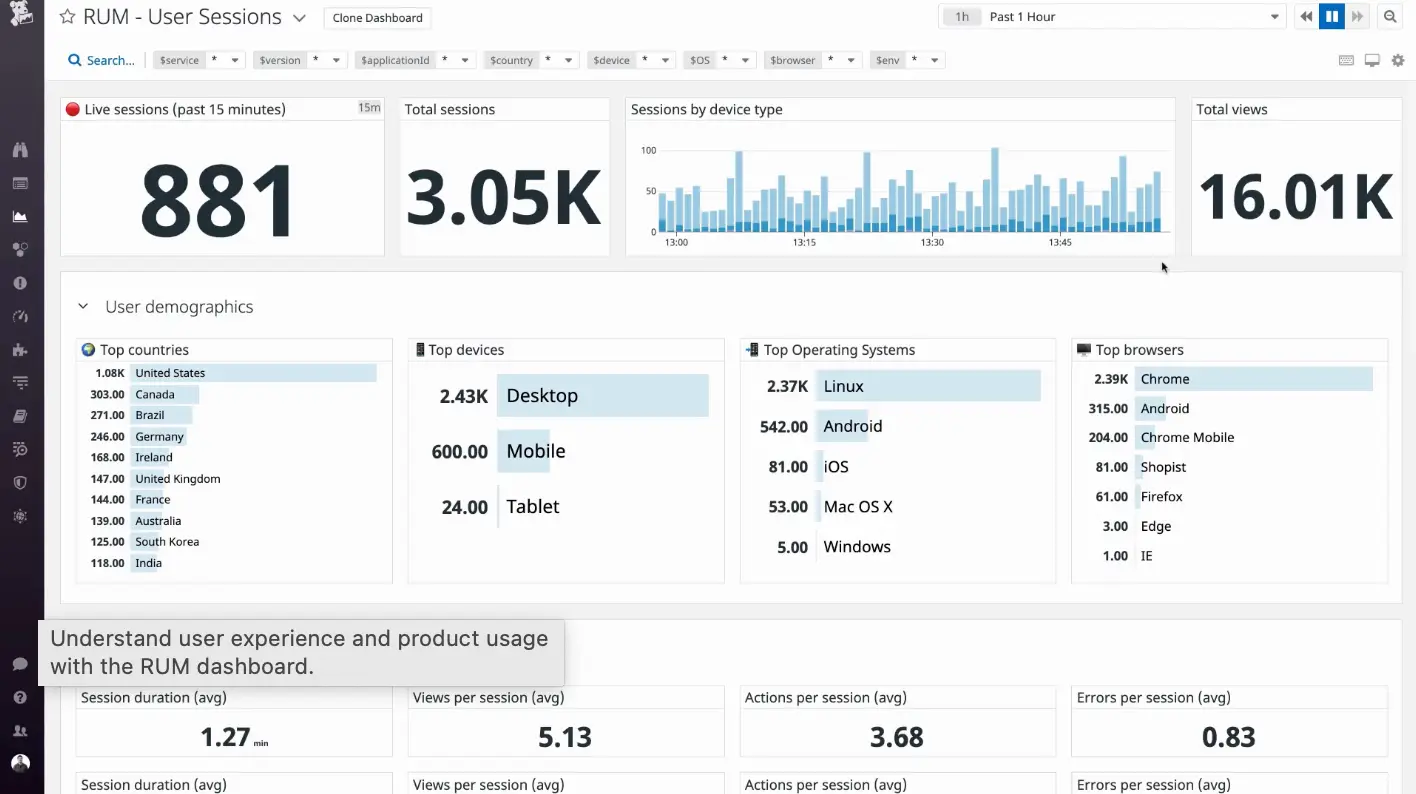
With 600+ integrations, Datadog aggregates your logs, metrics, traces, and events from distributed applications, databases, services, and infrastructure into a single platform. There, modular dashboards and a great set of visualization tools help you analyze and debug applications.
Key features
Powerful Integrations: Native integrations with 600+ systems, apps, and services.
Real User Monitoring: Correlate frontend performance with business impacts like revenue and user conversions.
Modular Dashboards: Fully customize your dashboards with drag-and-drop widgets and custom filters.
Pricing
Datadog has different pricing for each of the services on offer—from Infrastructure to Cloud SEIM. Some services are priced as tiered plans, others are usage-based.
Pros & Cons
Pros
Comprehensive visibility into applications
Industry-leading monitoring
Tons of native integrations
Great dashboards
Cons
Outdated UI
Subpar customer support
New Relic
Best for cost-effective full-stack monitoring
New Relic is a popular monitoring tool that offers comprehensive full-stack monitoring at cheaper rates than other major players (like Dynatrace and Datadog).
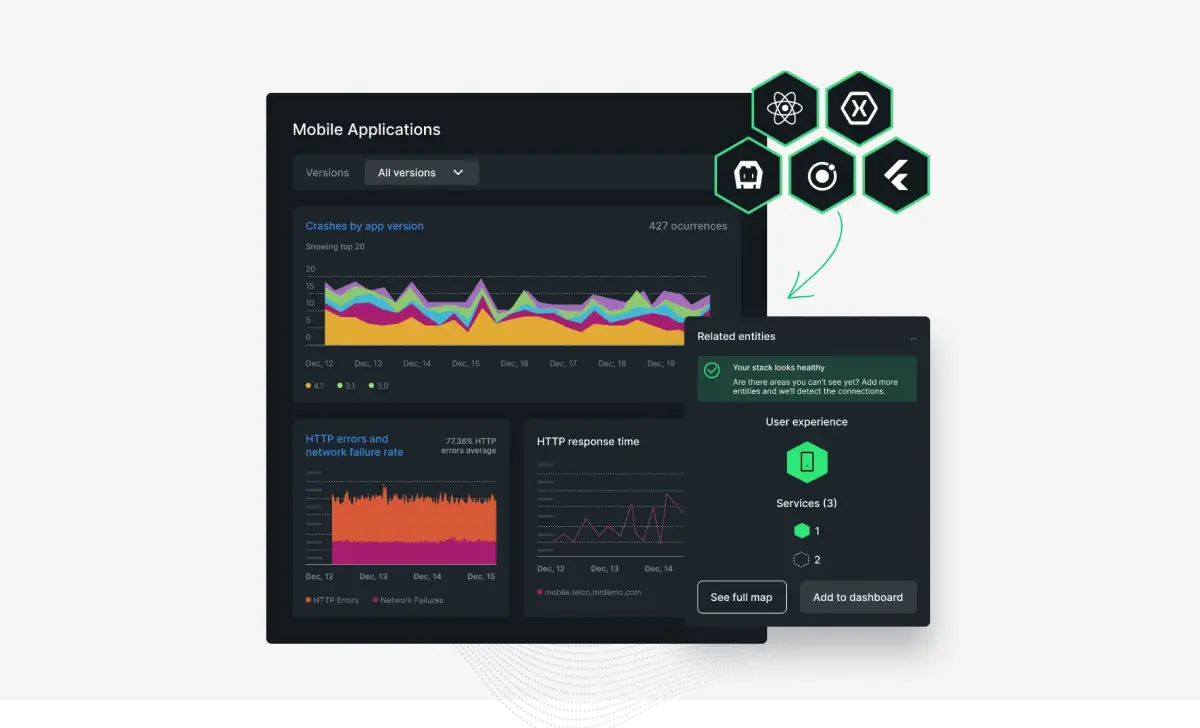
With New Relic, you can collect data from your application environment, storage systems, locally hosted applications, and more. There's also an AI-powered insights feature that helps identify areas of improvement for performance and reliability.
Key features
Availability & Error Monitoring: Track system availability and detect potential errors.
Dashboards & Insights: Generate customizable dashboards and gain insights into application performance.
AIOps: Leverage artificial intelligence to optimize application performance.
Pricing
New Relic uses a unique (at least for the monitoring space) PAYG pricing model. That means you only pay for the resources your system requires and can scale up/down as needed.
There are also plans, which dictate the features you have access to and the rates you’ll be paying for data, analytics, and storage.
Pros & Cons
Pros
Only pay for what you use
Solid free tier
Great dashboards keep you in the loop
Cons
Can be difficult to estimate cost for larger systems
Plans limit access to certain features
AppDynamics
Best for business-first observability
AppDynamics is a full-stack observability tool that’s great for correlating performance metrics with real-world business impacts.
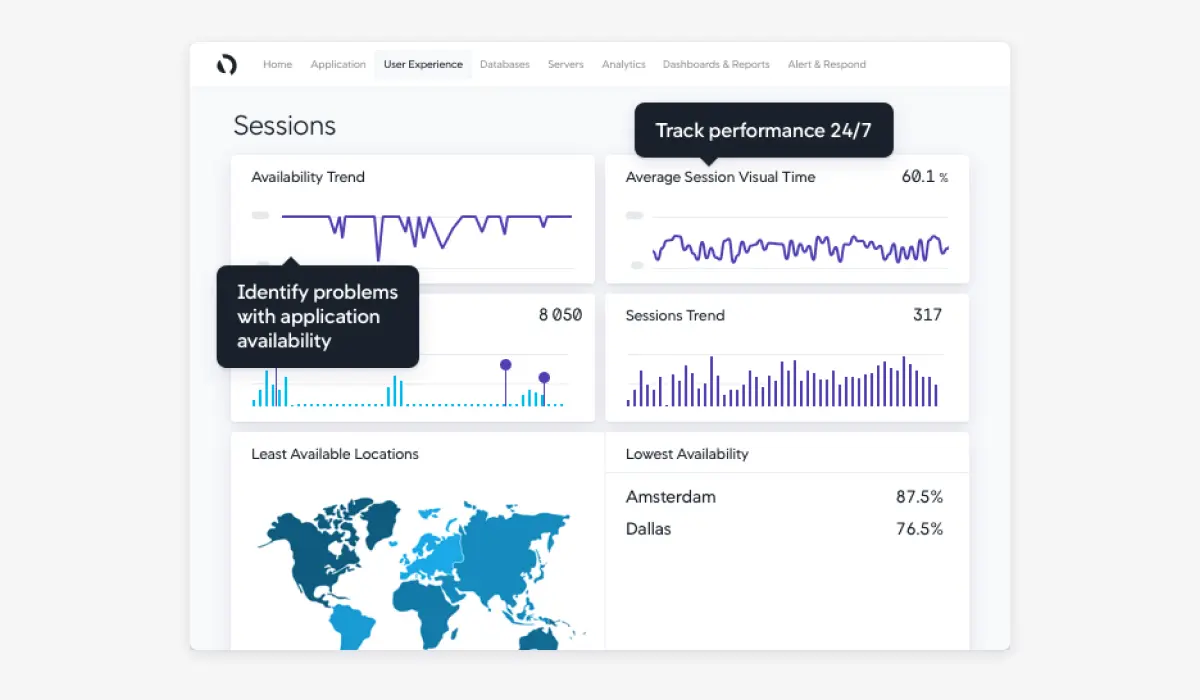
Features like end-user monitoring and code-level diagnostics put your team in the best position to identify and mitigate issues that are impacting real users (and your bottom line). Plus, it has a range of plans to suit the needs of teams big and small.
Key features
Automatic Prioritization: Automatically rank issues based on estimated business impacts (including revenue, conversions, and churn).
User Journey Dashboards: See the impact of performance issues on real users with end-user monitoring reports.
Release Validation: Link changes in KPIs to specific changes and releases.
Pricing
You’ll need to contact AppDynamics for a custom quote for all of their plans.
Pros & Cons
Pros
Prioritizes issues based on business impacts
Tracks the impact issues have on real users
Automatically measures the impact of new feature impact
Cons
Steep learning curve for new users
Limited customization options
Sentry
Best for Reliable Bug Tracking
Sentry is a powerful tool that gives developers all the context they need to solve issues quickly and effectively.
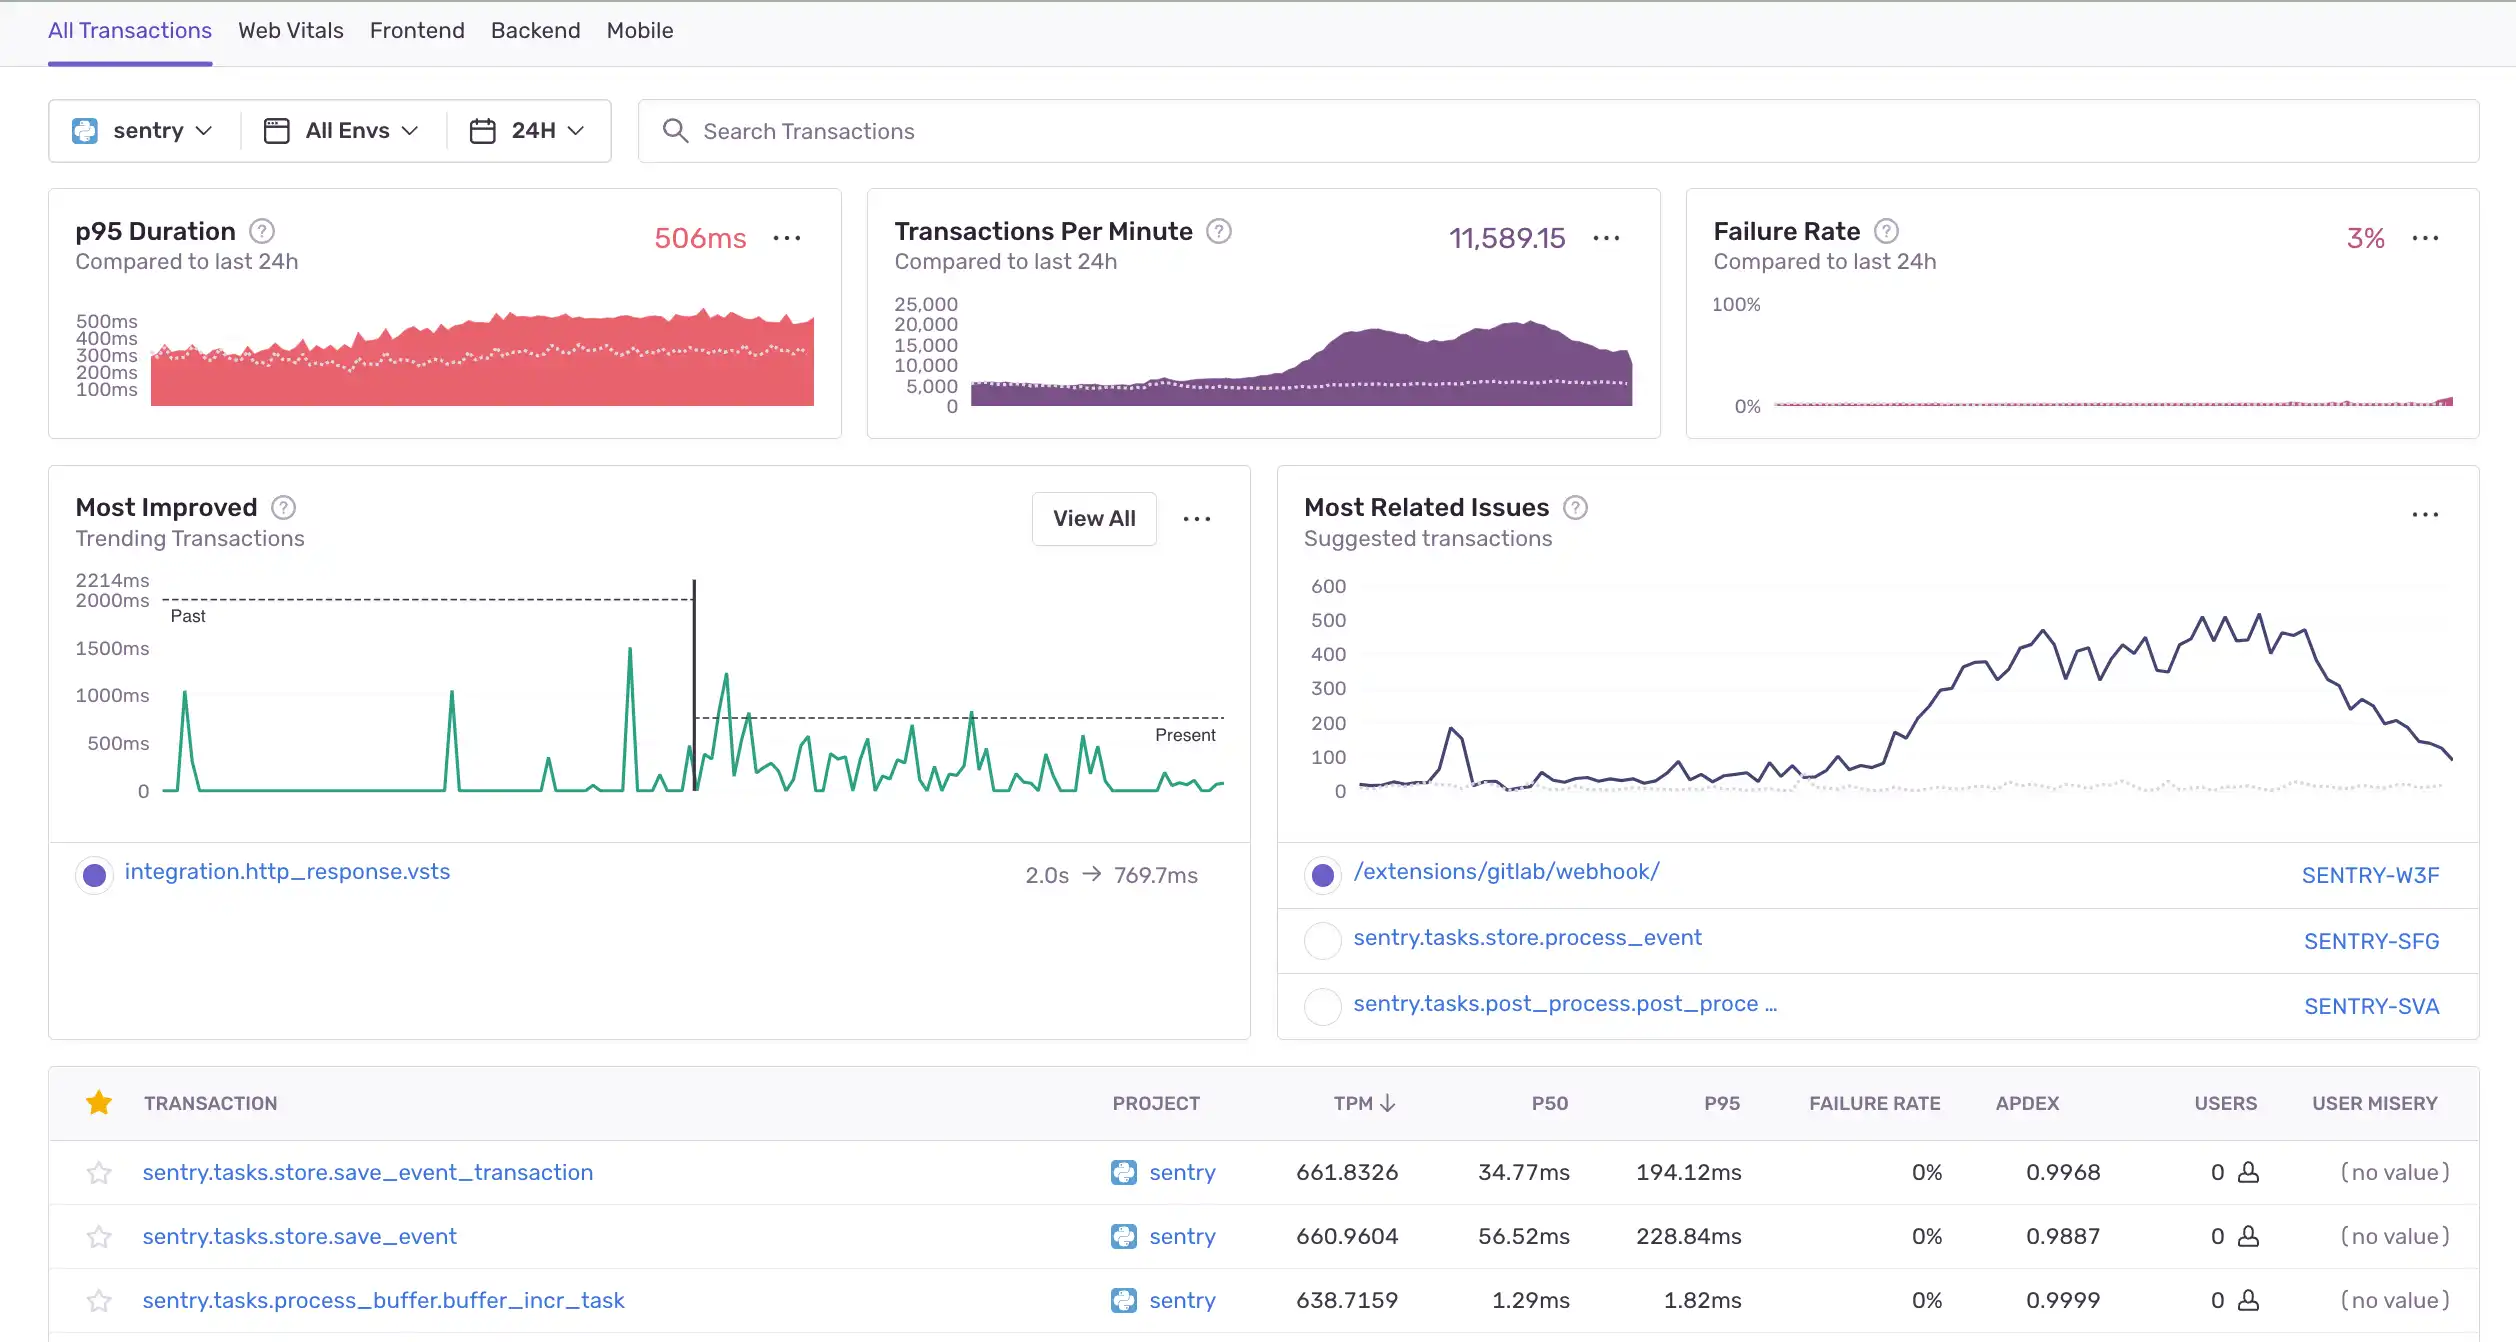
From real-time notifications to detailed, cross-project bug reports, Sentry’s monitoring system is built to cut down on downtime and resolve issues that are impacting users quickly.
Key features
Breadcrumbs: Dive into the sequence of events that led to an error.
Distributed Tracing: Trace poor performance to specific issues like underperforming API calls and slow database queries.
Customizable Dashboards: Customize dashboards to display the data you need easy access to.
Pricing
Sentry offers four pricing plans—Developer (free), Team ($26/month), Business ($80/month), and Enterprise (custom).
Most businesses will want to go for Business (no surprises there) for access to advanced analytics, unlimited users, and custom dashboards. That said, Developer is a great way to test the tool out before committing.
Pros & Cons
Pros
In-depth error reports with detailed stack traces streamline fixes
Breadcrumbs give developers granular insights
Customizable dashboards give easy access to important data
Cons
Difficult setup process
Free plan is very limited
Choosing the best alternative to LogRocket
What is LogRocket?
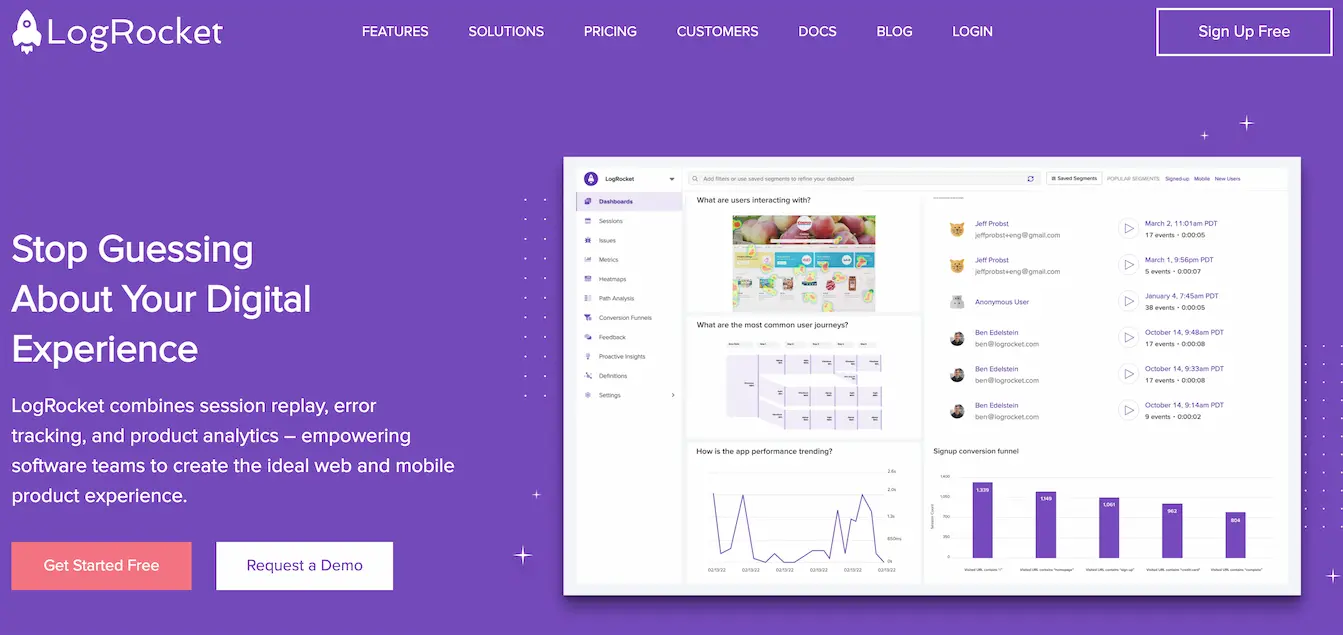
LogRocket is a popular tool that combines product analytics, bug tracking, performance monitoring, and more to give dev and product teams the insights they need to improve web and mobile UX.
Using LogRocket, software teams can take the guesswork out of bug fixes, quickly zero in on alerts for impactful issues, and find the ever-important whys behind key product KPIs like user engagement and retention.
Pricing
LogRocket has separate pricing for web and mobile tracking, with both featuring basic Free plans for up to 1,000 sessions per month.
Paid plans start at $99/month for web and $199/month for mobile, with more expensive plans offering advanced features, ML capabilities, more tracked sessions, and longer data retention.
Why look for a LogRocket alternative?
LogRocket is a great tool—there’s no denying it. It isn’t a perfect tool, though. And for a lot of users and use cases, it definitely isn’t the best tool.
Here are some of LogRocket’s biggest flaws, according to G2 reviewers:
Outdated, confusing UI
LogRocket is a great example of function over form. That’s all well and good, but it’s left quite a few reviewers wishing for a more modern, intuitive UI. Remember—there are powerful analytics tools that look nice, too!
Steep pricing
Yes—LogRocket has a free plan, but it’s a very limited one. Beyond that, pricing increases dramatically. Paid plans technically start at $99/month for the Team plan, but that doesn’t include key features like click maps, heatmaps, and dashboards.
In reality, teams are looking at $460+/month—LogRocket definitely isn’t cheap!
Paywalled features
As mentioned, LogRocket paywalls key features behind pricey plans. While this is a common practice for SaaS products, it isn’t a selling point.
At UXCam, we make sure all our features are available on every plan indefinitely. This allows everyone to get acquainted with the tool and scale up as needed. How can people decide if they need advanced features if they never get to test them out?
UXCam as the best LogRocket alternative
A solid monitoring and product analytics stack is key to generating data that helps you make targeted improvements. With the right tool, you can pinpoint issues quickly and cost-effectively.
UXCam is specifically designed to help mobile product teams make changes that delight users and encourage engagement. With features like automatic tagless event capture and full-context session replays, you have all the information you need to make targeted product improvements.
Get started with a 14-day free trial and start optimizing your app!
You might also be interested in these; LogRocket vs Sentry - Key Features and Pricing Comparison LogRocket vs FullStory - Which Mobile UX Tool Is Best for You?
How to measure mobile app performance
How to improve mobile app performance
Guide to User experience (UX) optimization
AUTHOR
Tope Longe
Product Analytics Expert
Ardent technophile exploring the world of mobile app product management at UXCam.

Related articles
Product Management
Say hello to new funnels: Analyzing app conversion rates just got easier
UXCam's updated funnels make analyzing conversions easier than ever with new conversion criteria and funnel...

Jane Leung
Product Analytics Expert
Conversion Analysis
React Native Performance Monitoring Guide 2026
Master React Native performance monitoring. Track JS thread stalls, dropped frames, and bridge lag with AI insights from Tara to ship a faster, smoother...

Tope Longe
Product Analytics Expert
Conversion Analysis
Top 51 Mobile App KPIs: Ultimate List 2026
51 mobile app KPIs — determine the KPIs and metrics that matter the most for your...

Jonas Kurzweg
Product Analytics Expert
