Back to blog
8 MIN READ
How to measure, analyze, and reduce app churn
PUBLISHED
11 February, 2025

Product Analytics Expert

Have you ever got so frustrated with an app experience that you immediately started googling how to deactivate your account? Your users have. App churn — the percentage of users who uninstall or stop engaging with your app — is a natural part of having a mobile app, but you can use app analytics to prevent losing your best users.
What is app churn?
App churn rate measures the percentage of users who cancel an app subscription, uninstall the app, or stop engaging with it. The metric is often measured at intervals of 30 days, 7 days, and 1 day after installing the app for the first time.
In short, churn happens when the product stops providing value to them. This is sometimes also referred to as “churn”, “user churn”, “mobile app churn”, or “abandonment”.
Potential causes of app user churn:
Your app crashes too much.
There are elements to it that are frustrating your users.
You’re sending out too many push notifications.
You haven’t updated your content in a while and users have grown bored.
Your app onboarding isn’t good enough.
There are other gaps in your app’s user experience that need to be addressed.
If you want to stop losing users, you’ll have to discover and analyze why they're abandoning your app. Afterward, and upheld with that knowledge, you can take the steps needed to address your users’ issues to improve your product to their expectations — thus increasing user retention.
Why do you need to analyze user churn?
Churn rate helps you measure the pace at which you’re losing active users over time. Not to mention, the average cost of acquiring one new install in North America was $US5.28 dollars. Focusing on new user acquisition becomes futile — and expensive— if you don’t get to the bottom of why existing users are no longer getting value from your app.
Check out a real-life use case to see one of our clients used UXCam to analyze churn.
How to measure mobile app churn rate
First thing’s first: You can’t improve a metric that you’re not tracking properly. Your app’s churn rate is the percentage of users that abandon your product and calculating it is necessary to know where you stand and what goal to set for the future.
To calculate it, look at how many users leave your app during a specific period of time (how many active users you have at the beginning vs. at the end of this period). A common way to do this is by looking at data over a given month, but you can also look at weekly, and even daily numbers if there is a good reason for it (e.g., the launch of a new update).
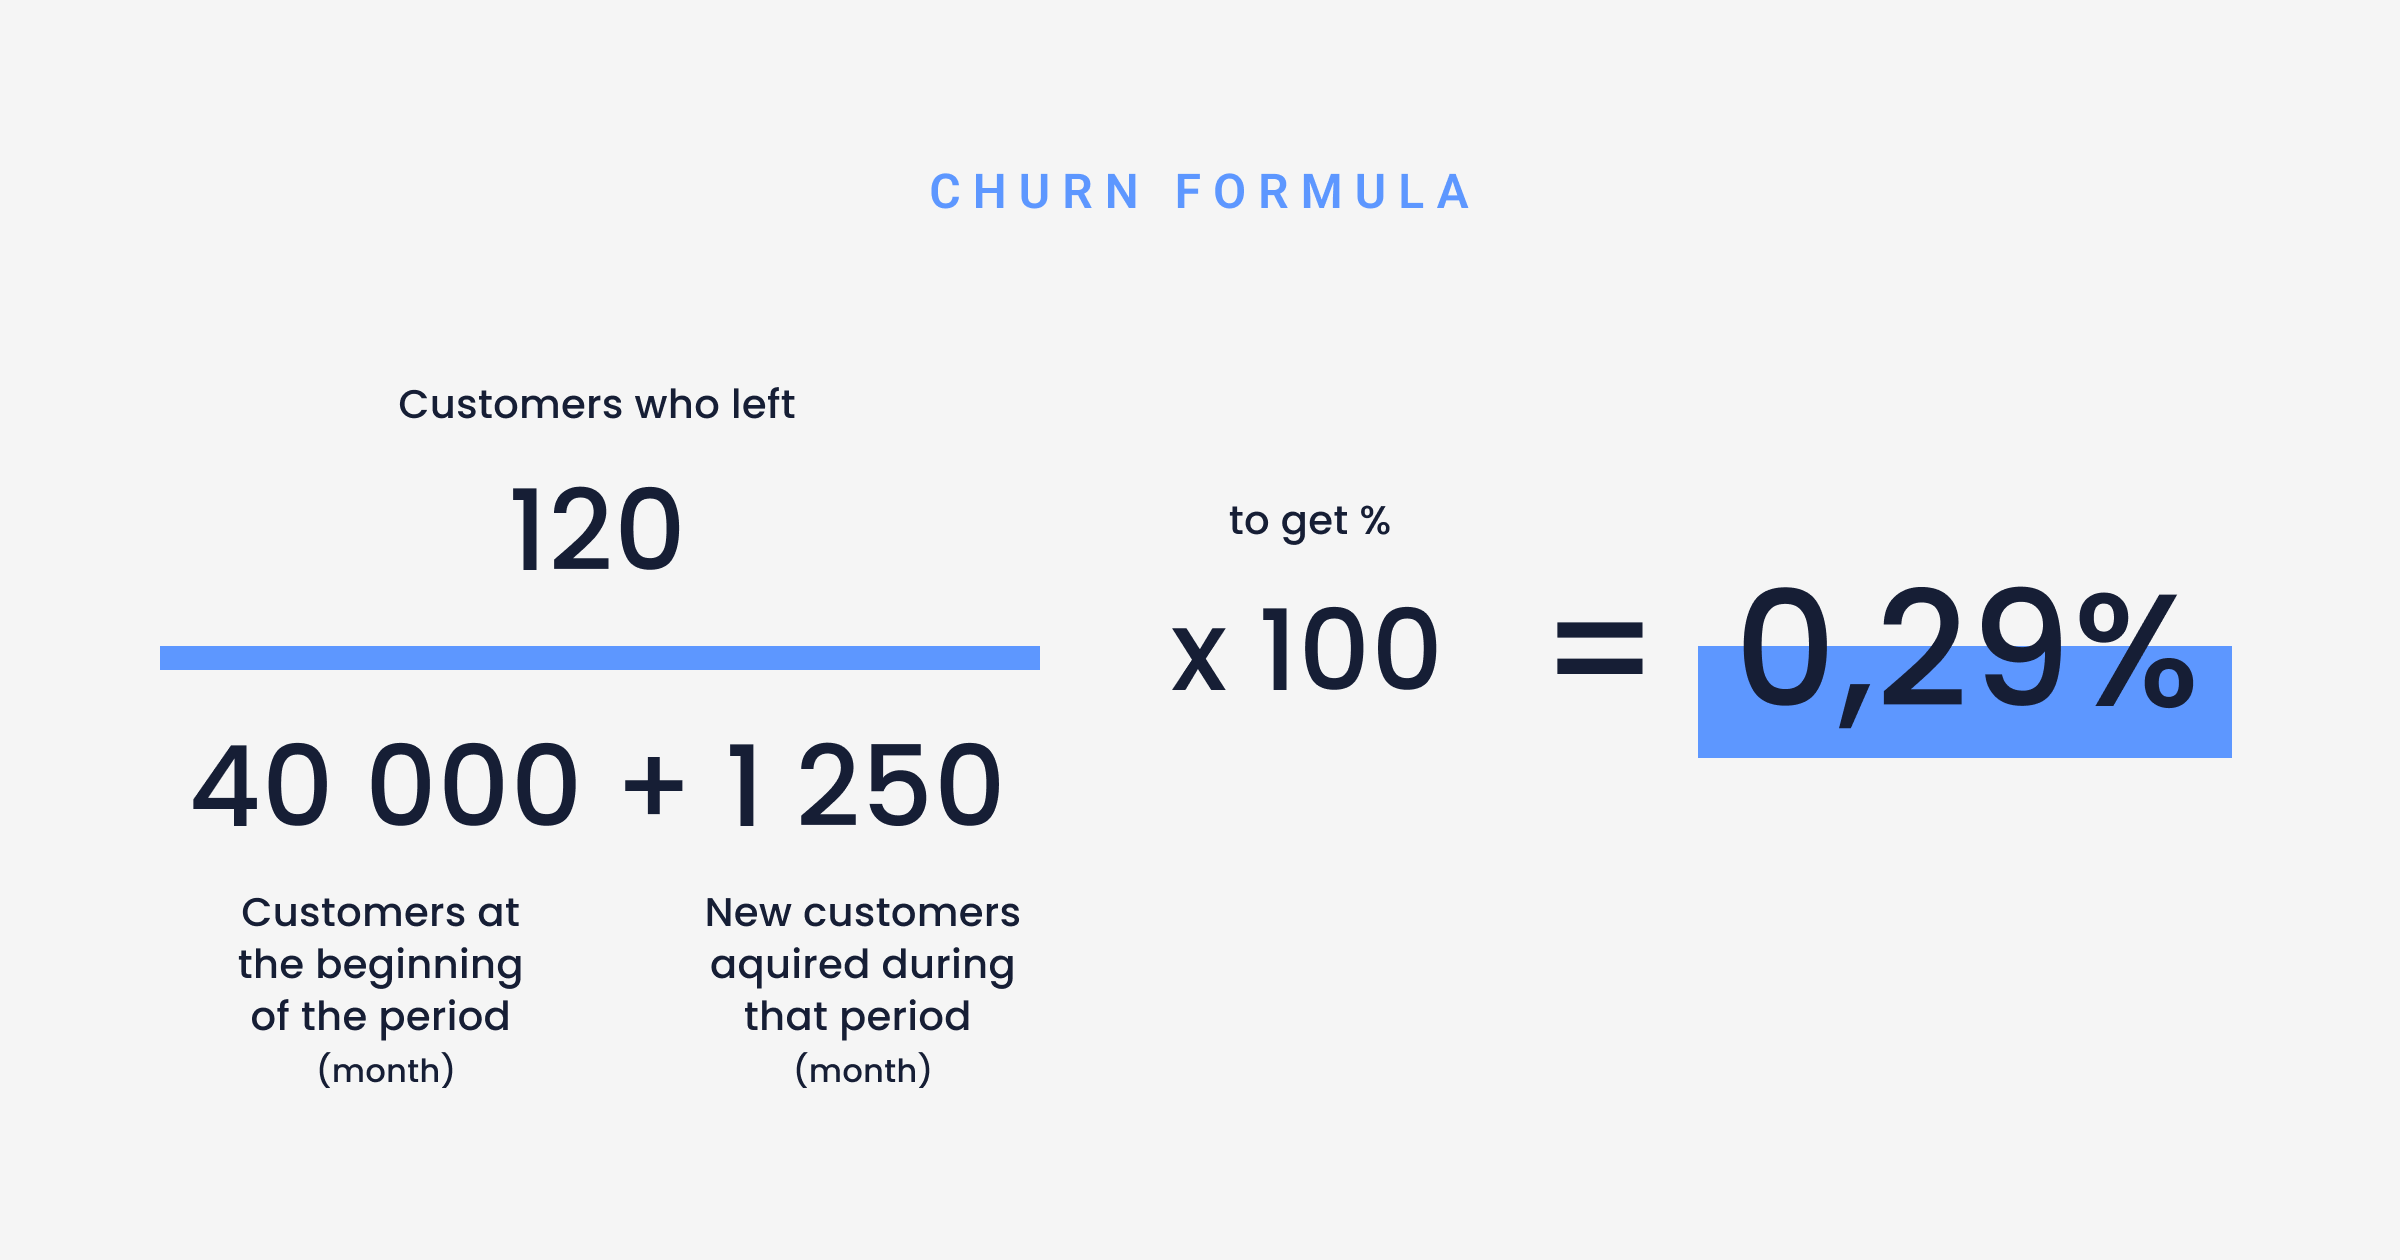
Let’s say you’re going with the standard monthly time frame. You will need three data points to calculate and track your churn rate. Take the number of;
users who left during the month and divide it by
the sum of users you had at the beginning of the month
plus the amount of new users acquired throughout the month.
Multiply that final number by 100 to get your percentage.


App churn rate formula: How to calculate your app’s churn rate.
Check out our guide to mobile app KPIs if you want to learn about other relevant metrics for your product.
The global app abandonment rate in 2019 was 25% which means that a quarter of users abandoned an app after only using it once. A good churn rate for an app is one that decreases over time, so make sure to calculate yours periodically. The lower, the better, because retaining users is easier than gaining new ones, but don’t get stuck over the specific number — aim to continuously lower it instead.
How to analyze app churn
So, now you have an app churn rate benchmark to work with, but you still have no idea why users are abandoning your app.
Analyzing the particular reasons why your users are churning gives you the right tools to prevent it from happening in the future. Think of churn analysis this way: If users were telling you why they are choosing to leave, wouldn’t you take in their feedback and make changes as soon as possible? There are ways to gather this data without your users explicitly reaching out to you.
You might also be interested in: Top mobile app KPIs for your dashboard (with examples)
Get an overview: Gather internal churn data
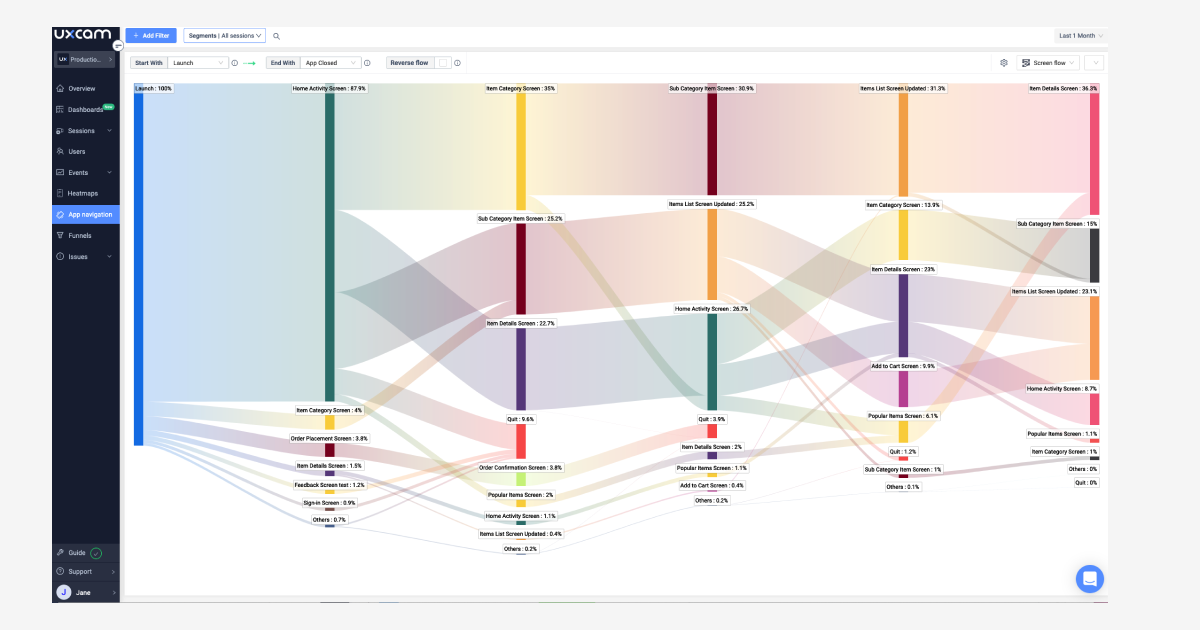
What did your users do before and while canceling their subscriptions? A Screen Flow tool, also known as App Navigation — can show you exactly what screens and paths your users go through until they churn.
Screen Flow helps you understand how users navigate through your app. Identify the screen’s transaction patterns, and discover problem paths that require optimization.


Screen flow, also known as App navigation shows the different paths users take.
2. Focus on the key flows to understand the path most users use to move from screen 1 to screen 2.
3. Use different sessions to compare your user journey and identify the behavioral patterns depending on things like:
Crashed sessions
Video sessions
First sessions
Short sessions
Offline sessions
4. Take note of popular exit paths to get an idea of the screens that users visited last before uninstalling your app.
You might also be interested in: How to understand your screen flow in seconds
Identify the users you want to focus on
Supposing that your app has three different subscription types — trial, free and paid — the most interesting cohort will be the paid users, and they’re also the ones you want to keep an eye on the most. That’s not to say your trial or free users aren’t important, and you should work on keeping user engagement up so they opt for a paid subscription.
If your most valuable users churn after already having decided to put money towards your product, they must have their reasons — and you should be inquiring about them. Ensure your in-app cancellation screen includes a required field requesting the reason for cancellation to identify involuntary and voluntary churn.
Deepen your churn rate analysis
Filter and report on churn data. Dig deeper into user behavior by sending user properties and creating custom events.
User properties that will help understand user churn are:
Subscription type - whether the paid subscription is billed monthly or annually
How long the user has had their subscription
Types of customer information that will help understand user churn:
Cancellation reasons
Buttons tapped
Completed actions


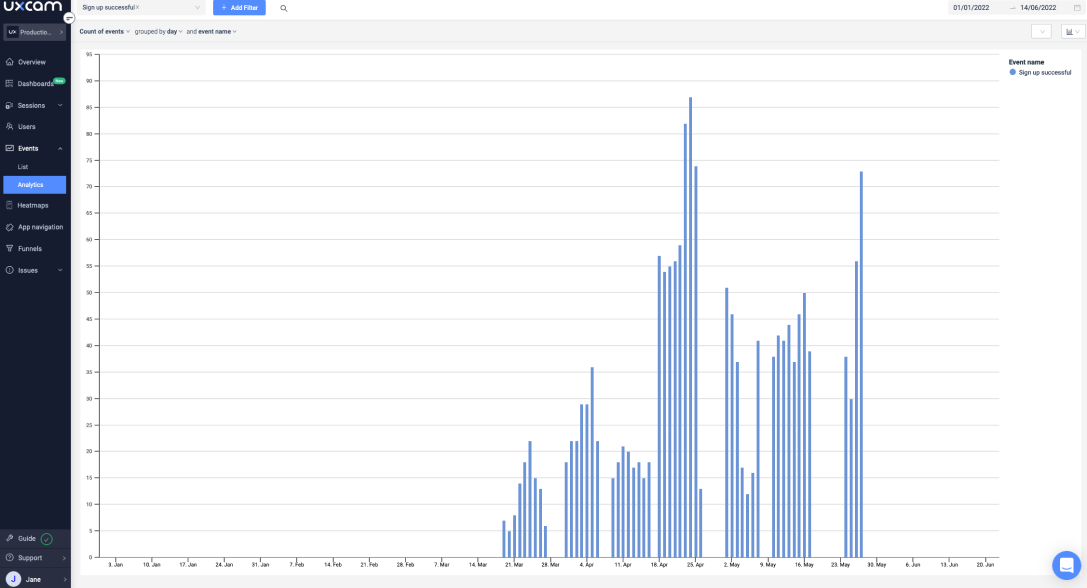
Tracking Successful Signup events in UXCam's analytics dashboard.
Filtering this information can give you a much more concrete idea of which users are churning and which events to look at. In fact, you can take it a step further and analyze their physical behavior on your app to uncover frustrations.
Use heatmaps and session recordings to identify frustration signals
Heatmaps give you an idea of which features users use to get the job done. To avoid watching a zillion of them, begin by filtering down by behavior. Once you’ve identified which heatmaps you want to look at, drill down deeper and watch videos of the actual sessions to get the full context. You can use any mobile app heatmap tool but here are the steps if you’re using UXCam’s Heatmaps feature.
UXCam helps you collect and identify your user’s interactions through the screens they visit, location, engagement time, gesture, and devices. Here’s how on UXCam:
Go to Heatmaps
Filter down to the screens that have the highest quit rate
View the shortlisted heatmaps and see where users are focusing their attention the most
Click show only rage taps
Watch the session to better understand the situation
The highest rage taps help identify screens that drive users' frustration easily. To have the cancellation insights and analyze the users' behavior, you will need to filter the session lists by screen using the rage taps and view the recordings. From heatmaps you can navigate further:
Screen entry to better understand the user environment and how they got to the problem screen.
Engagement time can help you identify which pages the users spend the most time on.
Analyzing crash rates
Crashes are sure to be a reason a user walks away from your app. In fact, 90% of users have stopped using an app due to poor performance.
Look for screens with the highest crash rates to prevent them from happening again. Under Issues, go to Crashes. Identify screens with the highest crash rates (often identified as ‘Occurrence’ numbers) and look into the session recordings. Send crash logs to the tech team to quickly fix the issue.
Want to know more about how to analyze user churn step by step? Read how a real UXCam customer did it.
How to reduce app churn rate
Key metrics offer themselves as canaries in the mine that tell you if your users are about to churn. These metrics often correlate with a high churn rate.
Pay close attention to these metrics when you’re looking to reduce app churn.
App engagement rate: If users aren’t engaging with your app, it’s a tell-tale sign they may have lost interest. Benchmark metrics include time-in-app, user data (DAU, WAU, MAU), number of logins, feature rates, and conversion rate.
App retention rate: This is the number of users who keep coming back and engage with your app over time. It’s typically measured in 30 days and 7 days.
To reduce app churn, it’s essential to find out why you’re losing users. Maybe your analysis revealed that part of your content isn’t available to some or all of your app users, or that the free delivery that you promised upon registration doesn’t apply to their location.
Whatever the issues, what’s left is tackling them. Fix the video that isn’t responsive, adjust your onboarding process to not overpromise and underdeliver, and release an updated and improved version of your app.
It’s generally much easier to retain customers than it is to gain new ones — though not every user will be worth the same, which is why paid subscribers should be on your radar at all times.
Here are 4 tips to reduce churn before it happens:
1. Optimize Onboarding: Onboarding is the first touchpoint your customers have with the app. So it's important to give them the best experience during the onboarding process. Minimize the complexity, attach them to solutions, limit the steps, and offer a fast and seamless registration process. This will make your customers enjoy a fantastic user experience.
2. Utilize Push Notifications: Sending push notifications encourages interaction, purchases, and repeat visits. The thank-you notification can reactivate customers that had forgotten about the app.
3. Stay in Touch: Send your customers messages to notify them about your new features or even welcome new customers.
4. Deep Links: Deep links help direct customers to certain locations in your app. Moreover, the links may restart the app to catch up with where the customer left.
Recap: steps to take to reduce app churn rate
Now that you know that the easiest fix to reduce churn is understanding why your users are dropping off in the first place, follow the steps below to achieve your goal:
Look at the common flows within your app.
Explore the cancellation flow within your app.
Track what screens users visit, and send custom events to UXCam to know what buttons they tap, what actions they complete, and any other details you want to be aware of.
Segment your users by the user properties that best apply to your product.
Analyze the cancellation process and dig deep into the details.
Make changes to your app based on your findings. Once a new version of the app has been released, compare the user behavior with that of the previous release.
Iterate.
Ready to measure, analyze, and reduce app churn with UXCam? Try us for free today or book a demo.
You might also be interested in these;
Mobile app churn rate & Key benchmarks
How to calculate churn rate for mobile apps product
How to run an effective churn cohort analysis with UXCam
What Is churn rate and how do we calculate it?
AUTHOR

Tope Longe
Product Analytics Expert
Ardent technophile exploring the world of mobile app product management at UXCam.
What’s UXCam?
Related articles
Conversion Analysis
Top 7 Best Mobile App Usability Testing Tools Compared (2026)
Discover the best tools for mobile app usability testing. Compare UXCam, UserTesting, Maze, and more to capture real user behavior and boost...

Jonas Kurzweg
Product Analytics Expert
Conversion Analysis
Top 51 Mobile App KPIs: Ultimate List 2026
51 mobile app KPIs — determine the KPIs and metrics that matter the most for your...

Jonas Kurzweg
Product Analytics Expert
Conversion Analysis
The Flutter Session Replay Tool: UXCam
Optimize your Flutter app's performance with UXCam's session recording and replay tool. Easy integration, optimized features, and strong...

Jonas Kurzweg
Product Analytics Expert


