Back to blog
17 MIN READ
User Behavior Tracking - Techniques, Tools & Best Practices
PUBLISHED
13 January, 2025

Product Analytics Expert
User behavior tracking is the key to unlocking actionable insights about how users interact with your product or website. It reveals what’s working, what’s not, and where users drop off.
For product managers and UX designers, it means optimizing features, improving onboarding, and boosting retention. For B2B marketers, it drives better content performance and conversion rates.
UXCam simplifies this process with its all-in-one mobile and web analytics solution. By combining powerful segmentation, autocapture, and session replay, UXCam eliminates complex setups and delivers value in weeks, not months.
Ready to understand your users like never before? Let’s dive in.
Summary - User behavior tracking techniques
| Techniques | Description |
|---|---|
| Click Tracking | Tracks user clicks to reveal navigation patterns and popular features. |
| Mouse Tracking | Records mouse movements to analyze user focus and intent. |
| Heatmaps | Visualizes areas of high interaction to highlight user engagement hotspots. |
| Session Recording | Observes user sessions to identify usability issues in real-time. |
| Scroll Tracking | Measures scrolling behavior to evaluate content engagement and optimize placement. |
| Form Analytics | Analyzes form interactions to improve completion rates and reduce drop-offs. |
| A/B Testing | Compares page versions to determine which achieves better user outcomes. |
| Cohort Analysis | Groups data to analyze user behavior over time for retention insights. |
What is user behavior tracking?
User behavior tracking is the process of collecting and analyzing data on how users interact with your app or website. It helps you understand user actions, preferences, and decision-making paths. You can track various interactions, including clicks, taps, navigation patterns, scroll depth, and form submissions. These insights give you a clear picture of user journeys and behaviors that lead to conversions—or drop-offs. Some examples of interactions you can track:
Clicks and taps: Which buttons users click or tap most frequently.
Navigation patterns: The paths users take between screens or pages.
Engagement with features: How often certain features are used and how long users spend on them.
By collecting and analyzing this data, you get a clearer picture of what works, what doesn’t, and where users may be struggling.
Why is user behavior tracking important for product teams?
It refines features, improves onboarding, and boosts satisfaction. Engagement data reveals underused features, drop-offs, and funnel barriers. UXCam’s session replays show exactly why users struggle or abandon tasks, enabling quick fixes.
How do B2B marketers benefit from user behavior tracking?
It reveals how prospects and customers interact with digital assets, guiding content strategy, validating assumptions, and enabling audience segmentation. UXCam pairs qualitative session replays with metrics to show not just what users do, but why.
How to set up a user behavior tracking strategy
You want to gather actionable insights from real user interactions. This process helps you pinpoint what truly matters to your users. Once you know which actions lead to growth, you can optimize your product for maximum impact.
Step 1: Define clear goals and KPIs
Before diving into tools and techniques, clarify what you want to achieve. Tracking for the sake of data is a waste of resources. Focus on what truly matters.
Identify the key actions your users take that align with your product’s success. For instance:
Are users signing up and completing onboarding?
Are they engaging with core features?
Are they upgrading to paid plans?
Translate these actions into measurable Key Performance Indicators (KPIs). For example:
Sign-Up Completion Rate: Percentage of users who sign up and move to onboarding.
Feature Adoption Rate:Users actively engaging with a specific feature.
Upgrade Rate: Percentage of free users converting to paid plans.
Use a simple framework to organize your goals and KPIs, as shown in the example below:
| Goal | KPI | Example Metric |
|---|---|---|
| Acquire Users | Sign-Up Rate | Target 20% increase in monthly sign-ups |
| Increase Conversions | Purchase Conversion | Aim for 15% jump in free-to-paid upgrades |
| Boost Engagement | Engagement Rate | Track 30% rise in average weekly sessions per user |
Think of these goals and KPIs as your north star. They keep your team focused and guide every feature decision. Regularly revisit them to make sure they still align with your product vision.
Step 2: Select and integrate the right tool
Now that your goals are clear, it’s time to choose the right tool. This step ensures you’re equipped to collect the data you need without overloading your systems or teams.
Start by assessing your tech stack. What tools do you already use for analytics, CRM, or A/B testing? The tracking tool you choose should seamlessly integrate with these to provide a unified view.
If you’re working with a mobile or web product, look for solutions that align with your platform. Tools like UXCam can simplify this process. With a single SDK, UXCam offers:
Automatic event capture: No need for manual tagging of basic interactions.
Consistent data across platforms: Whether you are tracking users across mobile or web.
Ease of integration: UXCam integrates effortlessly with major frameworks like React Native and Flutter.
Why you should choose UXCam for Web
UXCam empowers you to move faster, make better decisions, and build better products by combining powerful quantitative insights with qualitative context.
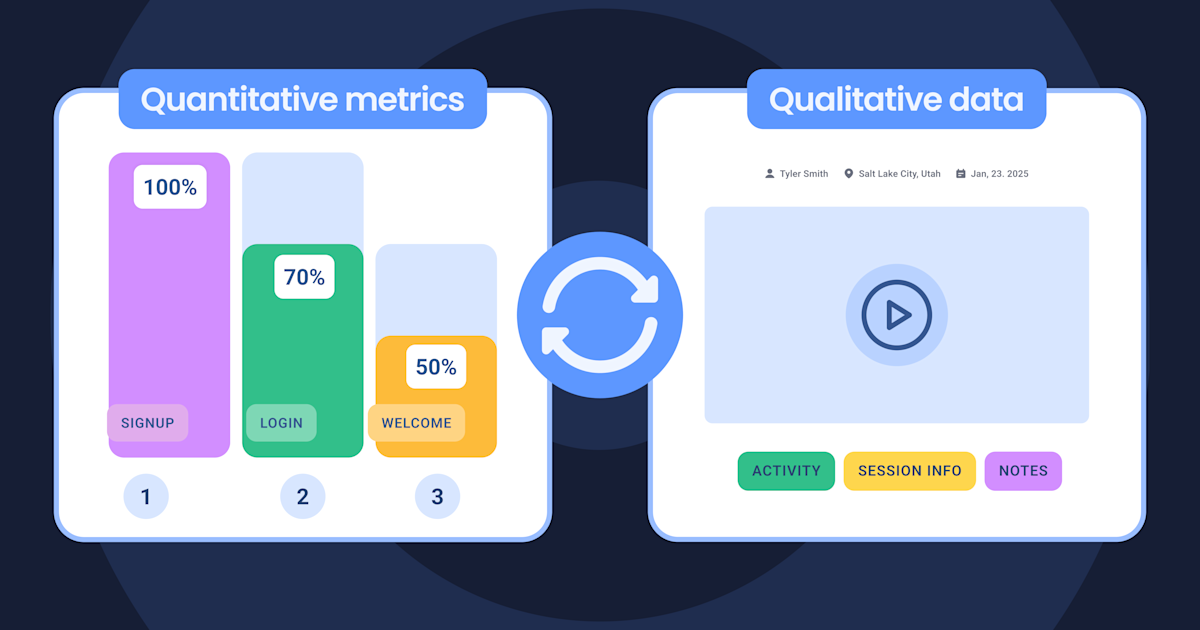

Most analytics tools force you to jump between dashboards, spreadsheets, and session replay apps to piece together a full picture. UXCam removes that friction with a native connection between product analytics and session replay, all from a single SDK. This means:
Spot a drop in your funnel? Jump straight into session replays of affected users.
See unusual behavior in a report? Click into sessions without losing context.
Want to analyze rage clicks or abandoned flows? Filter and view instantly.
Quick to set up, easy to use
Because of our autocapture technology, you don’t need to set up every single thing you want to track—insights just start showing up right away. You’ll also get access to ready-made filters and report templates, so there’s no need to build complex dashboards from scratch. And if you're working with a team, it’s easy to share dashboards with others so everyone—product, design, and engineering—is on the same page.
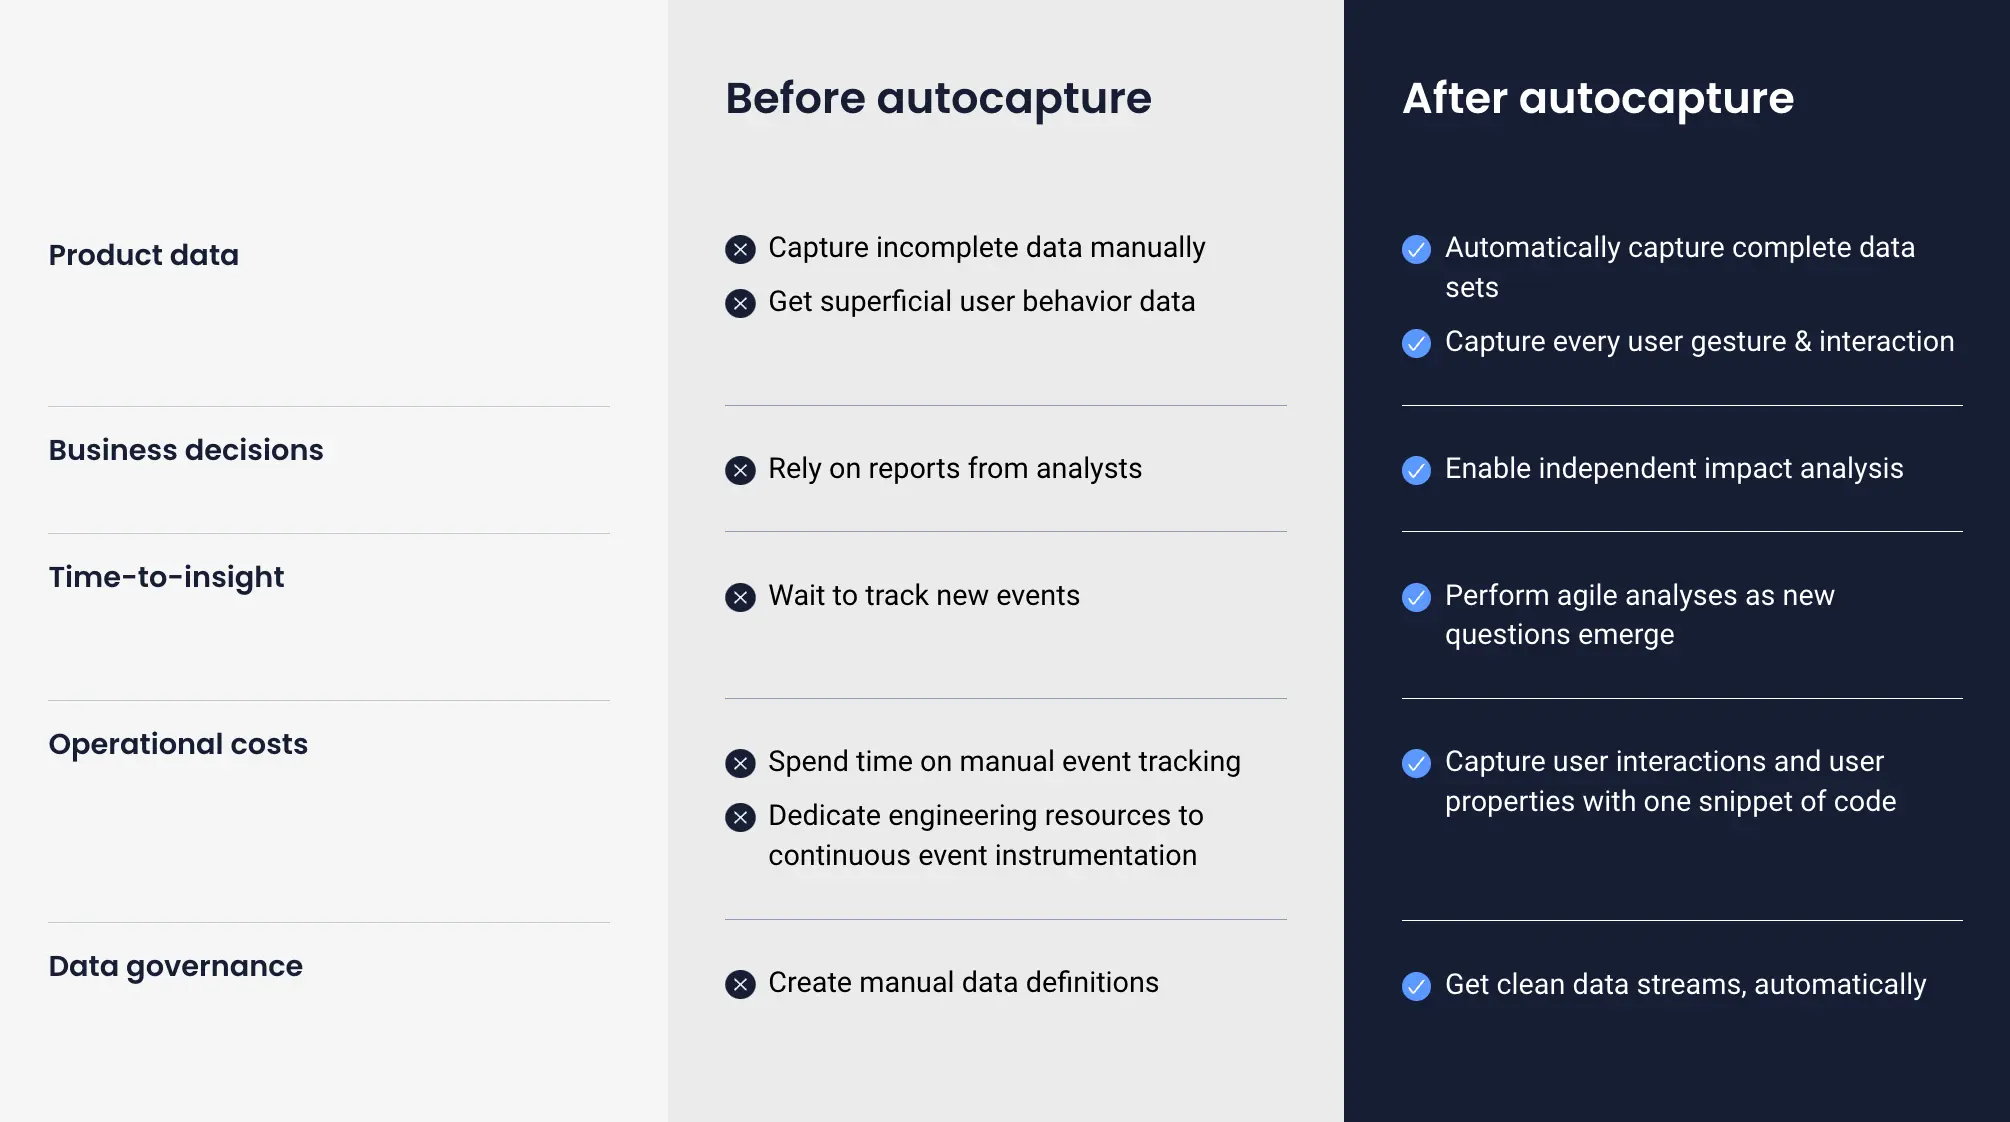
Flexible, but not overwhelming
Even though UXCam is simple to use, it still gives you the flexibility to go deeper when you need to. It covers most of the common product analytics use cases right out of the box, but you can also set up custom events and filters to answer more specific questions.
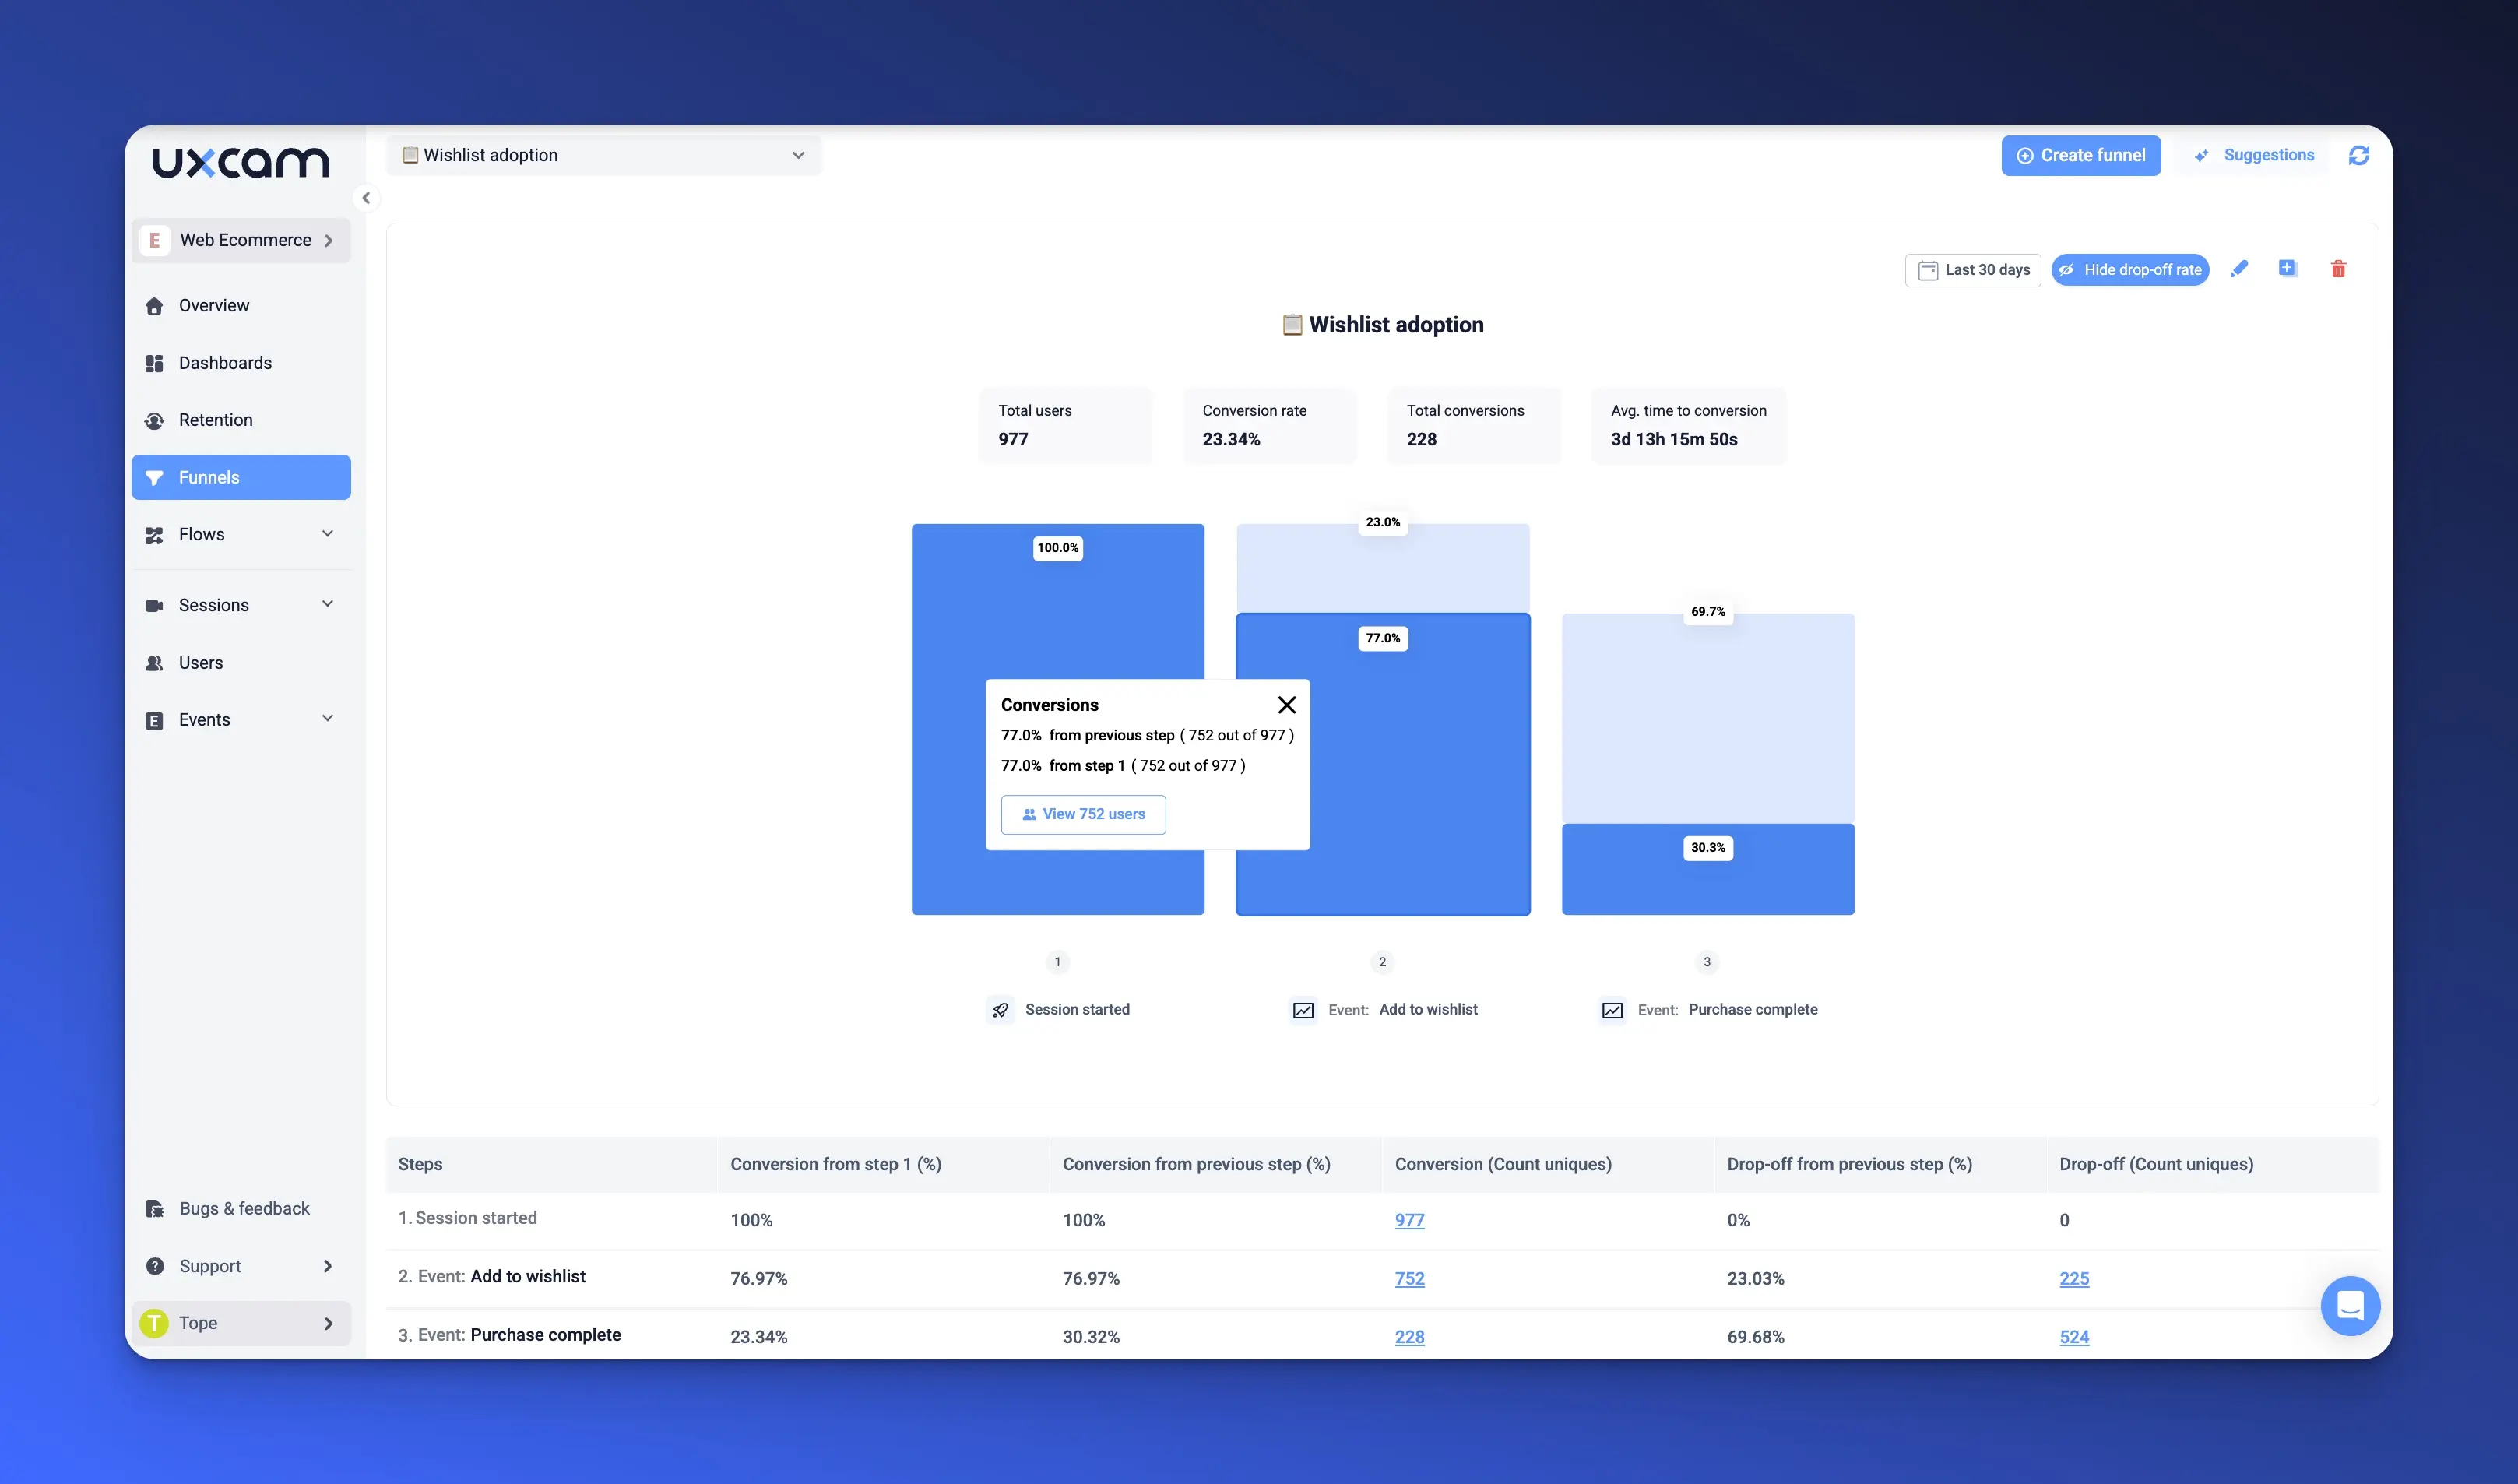
Get insights in a few click
One of the most powerful advantages is how quickly UXCam gets you to insight. With just a few clicks, you can segment sessions based on user behavior, generate dashboards from a specific cohort, or jump directly into sessions tied to key events. You’ll even uncover patterns and friction points you might not have thought to track—surfacing insights that traditional, manual analytics setups often miss.
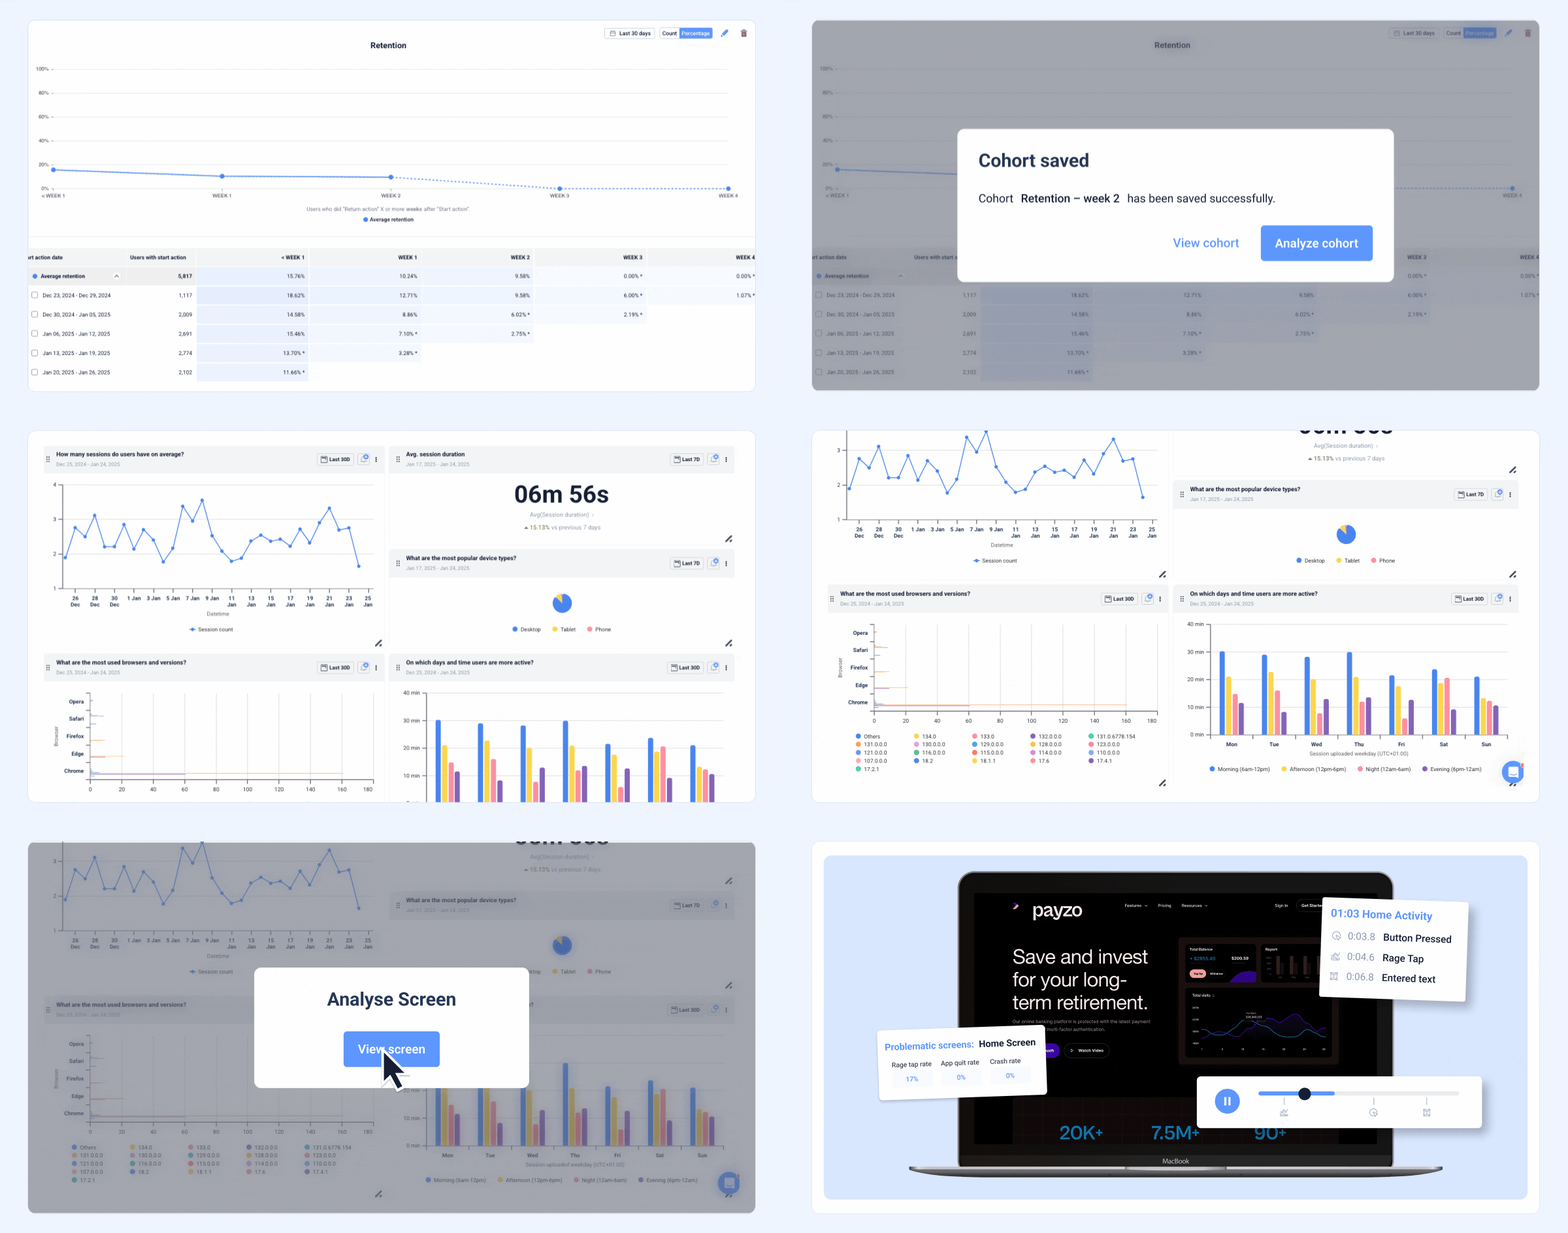
Ready to level up your website’s user experience? Sign up for free to start using UXCam to capture rich behavioral insights, fix friction points, and increase your conversion rates.
Step 3: Implement event and funnel tracking
Event and funnel tracking allows you to monitor specific user actions and their sequence, providing deeper insights into how users interact with your product. It’s essential for understanding user behavior and optimizing key workflows.
Start by outlining events aligned with your user flows. Events are the building blocks of behavior tracking. For example:
Onboarding Funnel: Track events like sign-up, tutorial completion, and first feature use.
Payment Funnel: Monitor actions such as “Add to Cart,” “Checkout Started,” and “Payment Completed.”
Make sure to tag events with relevant properties to refine your insights. Consider these key properties:
Location: Where are your users coming from?
Device Type: Are they using mobile, desktop, or tablet?
User Attributes: Segment data by user demographics or account type.
By organizing events and properties, you’ll capture actionable data that helps you fine-tune your product experience.
Step 4: Use session recordings and heatmaps
While event tracking provides quantitative insights, session recordings and heatmaps add a qualitative layer.
These tools work best together, offering a comprehensive view of your product’s strengths and areas for improvement. They show how users navigate your product, highlighting areas of friction or delight.
With proper tracking, your team can confidently make data-driven decisions to enhance user experience.
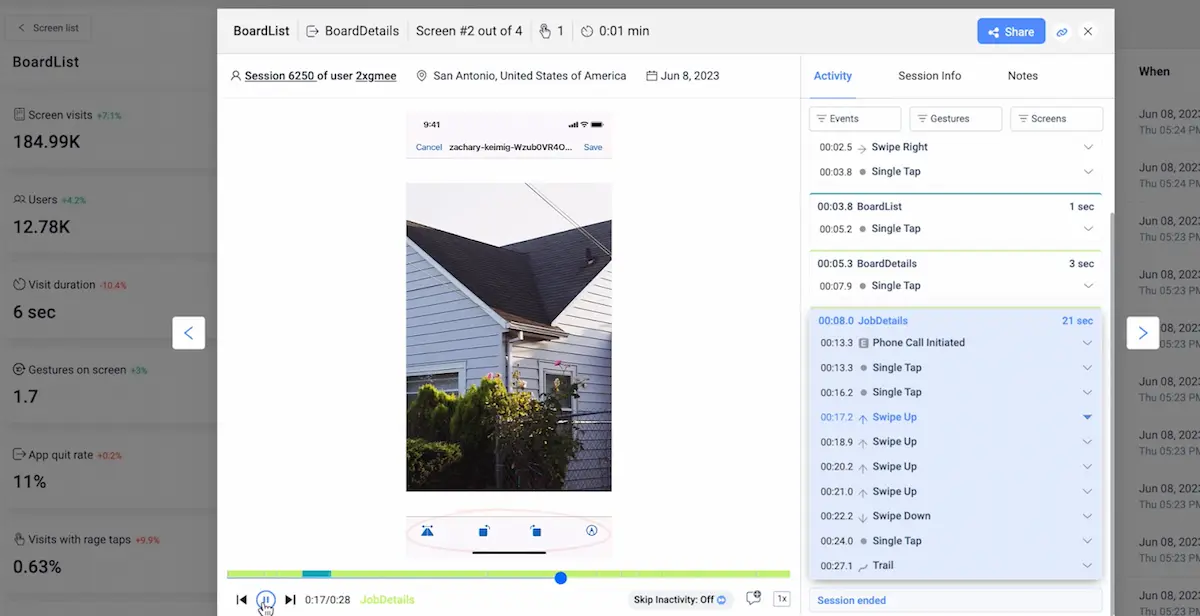
Use session recordings for deeper context
Session recordings let you watch users interact with your product in real time. Use them to:
Identify Pain Points: Are users abandoning forms or clicking repeatedly on unresponsive buttons?
Validate Data Hypotheses: If your funnel shows drop-offs at the payment step, recordings can reveal why.
For example, if users are dropping off at checkout, recordings might show confusion about payment options, or errors that prevent form submissions.
Leverage heatmaps to spot trends
Heatmaps visualize where users click, scroll, or hover, providing an aggregate view of user behavior. Use them to:
Highlight Popular Features: Which buttons or areas are most clicked?
Discover Neglected Areas: Are users missing important CTAs because they’re not in the visual hierarchy?
Step 5: Analyze results & iterate
Once your user behavior tracking system is in place, the next step is to extract actionable insights and refine your product continuously. Data analysis isn’t a one-time task—it’s an ongoing process of learning and improvement.
Schedule regular data reviews
Consistency is key to effective data analysis. Set up regular review sessions with your product, design, and marketing teams to discuss findings. Use these meetings to:
Review metrics against your defined KPIs (e.g., sign-up rate, feature adoption rate).
Highlight trends, anomalies, and opportunities from your event and funnel data.
Share qualitative insights from session recordings and heatmaps.
For example, are users dropping off at a specific step in the onboarding flow? or is there a feature users engage with more on mobile versus desktop?
Turn insights into action
Data is only as valuable as the decisions it informs. Use the insights to:
Refine Features: Simplify workflows, fix usability issues, or enhance popular features.
Improve Marketing Campaigns: Adjust messaging or target audiences based on behavioral data.
Enhance Onboarding: Tailor onboarding flows for different user segments to reduce churn.
For example, if heatmaps reveal users are ignoring your primary CTA, redesign its placement or appearance to boost visibility.
Test changes with A/B experiments
Implementing changes is just the first step. To ensure they deliver the desired results, validate them through controlled testing methods:
A/B Testing: Test different versions of a page, feature, or workflow with subsets of users to identify what works best.
Iterative Rollouts: Release changes to a small user group before a full-scale launch to minimize risks.
Here’s a simple testing example to inspire you:
Hypothesis: Reducing form fields on the sign-up page will increase conversions.
Test: Create two versions of the sign-up page (one with fewer fields) and measure the completion rate.
Result: Use statistical significance to determine the winning version.
Actionable tips for data analysis and iteration
Use dashboards effectively: Create customized dashboards for quick access to key metrics and insights using UXCam dashboards.
Involve stakeholders: Share insights with relevant teams (e.g., marketing, design) to align efforts.
Automate reporting: In UXCam, you can set up periodic reports to save time and ensure timely updates on user behavior.
Track the impact of changes: After rolling out updates, monitor their impact on your KPIs to confirm success.
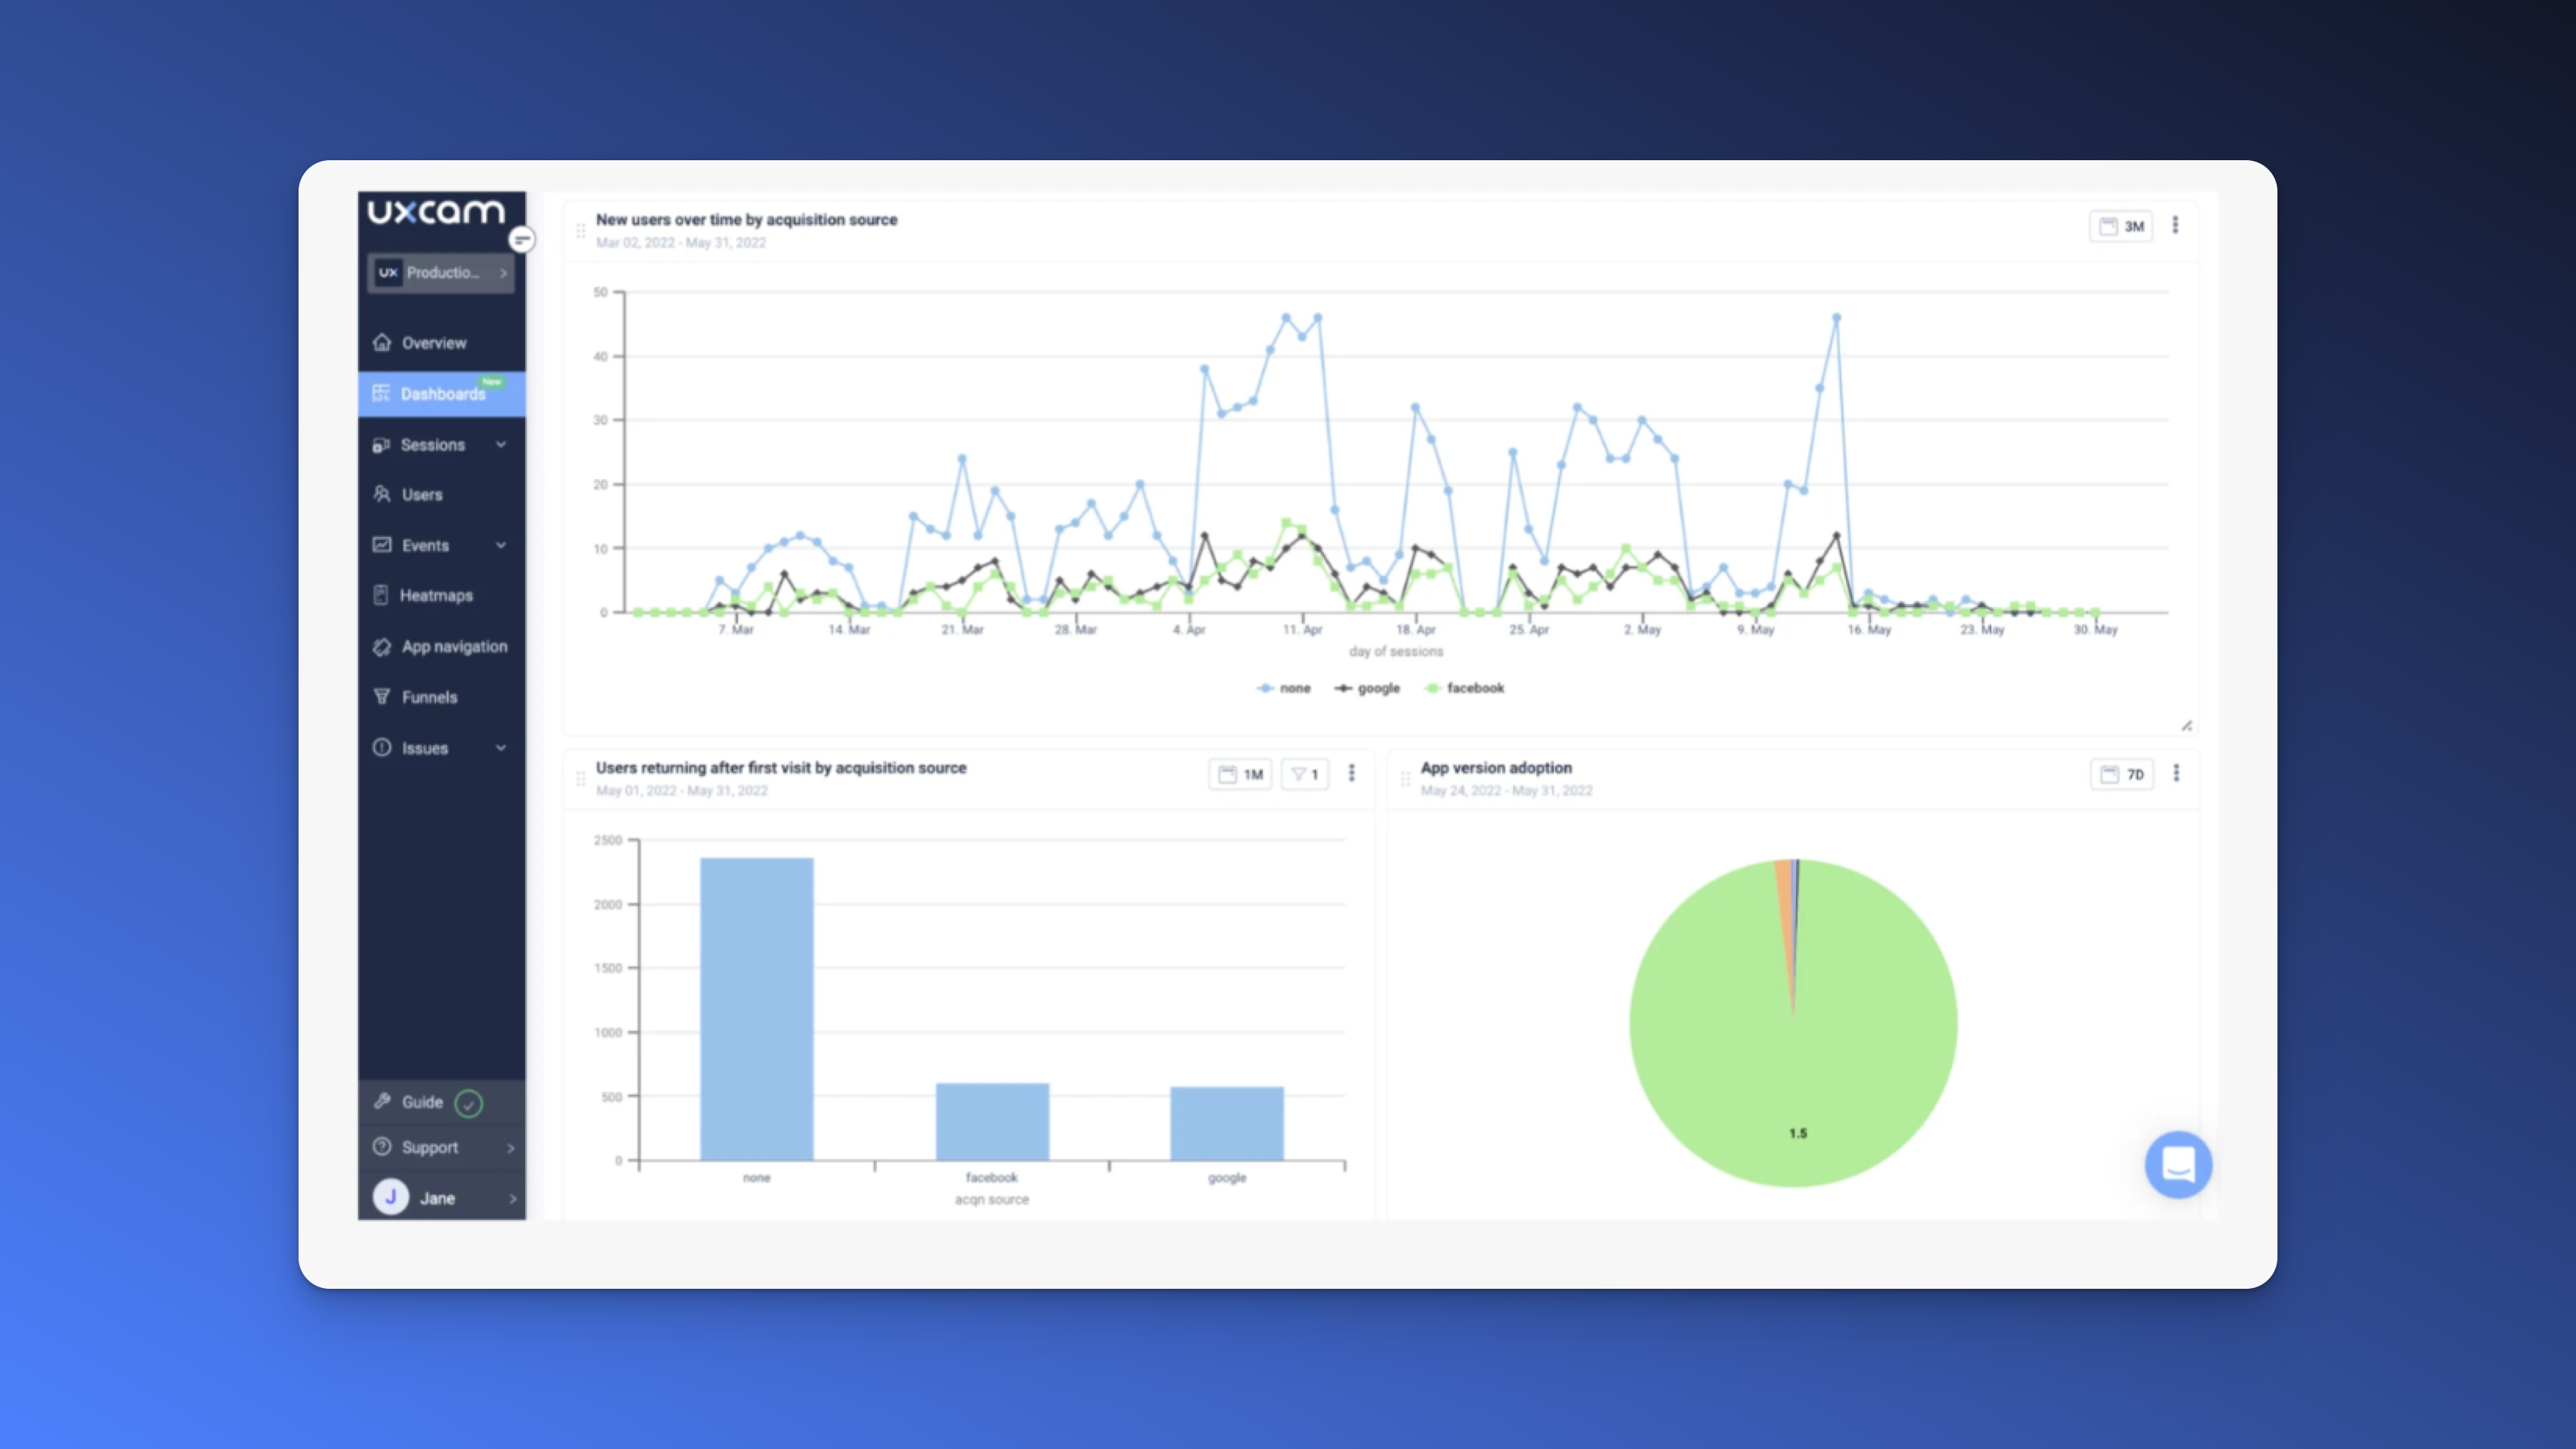

Key user behavior metrics to track
You want to understand how users interact with your product beyond simple page views. The right user behavior metrics give you a clear picture of what's working. They also highlight where you can improve to keep users engaged and delighted.
1. User engagement metrics
Engagement metrics measure how active and involved users are with your product. They indicate whether your product provides consistent value.
Active users (DAU, WAU, MAU): Track the number of unique daily, weekly, and monthly active users. This helps identify trends and evaluate user retention over time.
Session duration and frequency: Understand how much time users spend in your product and how often they return. A short session duration could indicate confusion or lack of engagement.
Use these metrics to assess the health of your product. For instance, a dip in DAU might signal a usability issue.
2. Behavioral flow metrics
Behavioral flow metrics analyze how users navigate your product. These reveal which paths drive engagement and where users drop off.
Funnels (conversion rates and drop-offs): Track user journeys, like completing onboarding or making a purchase. Identify bottlenecks where users abandon the flow.
Feature adoption rates: Measure how many users engage with specific features. Low adoption might mean the feature isn’t valuable or intuitive.
Use funnel analysis to pinpoint drop-off points. Pair this with session recordings to uncover the "why" behind user actions.
3. Retention and churn metrics
Retention metrics show how well your product retains users, while churn highlights where you’re losing them.
Cohort analysis: Group users by common characteristics (e.g., sign-up date, plan type) and track their behavior over time. This identifies patterns in user retention or attrition.
Customer lifetime value (CLTV): For B2B marketers, CLTV indicates the total value a customer brings to your business over their lifetime. High churn negatively impacts CLTV.
Use retention data to focus on improving long-term user satisfaction and reducing churn.
4. User satisfaction indicators
Satisfied users are more likely to stay engaged and promote your product. Track metrics that reflect user sentiment.
Net promoter score (NPS): Ask users how likely they are to recommend your product. This provides a clear, benchmarkable satisfaction metric.
Qualitative feedback from surveys and reviews: Collect open-ended feedback to uncover hidden pain points or areas of delight.
Combine NPS data with qualitative feedback for a holistic view of user satisfaction. Address recurring themes to improve sentiment.
Summary of metrics
| Metric Type | Key Metrics | Why It Matters |
|---|---|---|
| User Engagement | DAU, Session Duration, Frequency | Measures product usage and stickiness. |
| Behavioral Flow | Conversion Rates, Feature Adoption | Identifies strengths and weaknesses in user journeys. |
| Retention & Churn | Cohort Analysis, CLTV | Tracks long-term user relationships and revenue impact. |
| User Satisfaction | NPS, Qualitative Feedback | Gauges how happy users are with your product. |
Best tools for user behavior tracking
Choosing the right tool for tracking user behavior can make or break your efforts to understand your audience. Popular tools like Hotjar, Mixpanel, FullStory, and UXCam each bring unique strengths to the table.
What are the top tools for tracking user behavior?
Hotjar is excellent for heatmaps and quick visual insights, while Mixpanel shines with its robust event tracking and cohort analysis. FullStory offers a solid session replay feature for web-based products. Then there’s UXCam, which offer granular insights and better ease of use compared to these other tools.
Take a look at this comparison table to help you understand how these tools stack up:
| Tool | Best For | Limitations |
|---|---|---|
| UXCam | Product teams needing fast, granular insights | Lacks heatmap functionality for web (for now) |
| Hotjar | SMBs needing basic tracking and feedback | Limited segmentation and advanced analytics |
| Mixpanel | Teams with dedicated engineering resources | Requires extensive setup and technical expertise |
| FullStory | Enterprises prioritizing qualitative data | High cost and limited mobile capabilities |
Why is UXCam a superior choice for product teams?
UXCam’s autocapture eliminates the need for manual event setup, so you start gathering data immediately. For example, if you’re tracking an onboarding funnel, UXCam can instantly show which step has the highest drop-off without waiting for engineers to tag events.
Another standout feature is the granularity of its segmentation. UXCam allows you to dive into specifics, such as device type, session duration, or rage clicks. You can even jump from high-level dashboards into session replays with one click, making it easy to connect numbers to user behavior.
What features should you prioritize in a tracking tool?
When evaluating user behavior tracking tools, focus on these criteria:
Ease of use: Tools should be intuitive and require minimal setup. UXCam’s interface makes it easy for both technical and non-technical users to gain insights.
Segmentation depth: Look for tools that allow you to slice and dice data to understand specific user groups. UXCam excels here with powerful out-of-the-box segmentation options.
Session recording: Ensure the tool lets you connect quantitative data (like drop-offs) with qualitative insights (like replays). UXCam’s native integration does this seamlessly.
Scalability: As your team and product grow, your tracking tool should scale with you. UXCam’s pricing model and infrastructure support growth without breaking the bank.
UXCam not only meets these criteria but goes beyond by simplifying the user experience while offering deep insights. It’s a solution designed for teams that value speed, granularity, and collaboration.
Best techniques to track user behavior
User behavior tracking comes in many forms. You can use various methods to capture how users interact with your product. Each technique has its benefits and practical tips for immediate use. By focusing on techniques that reveal both quantitative and qualitative data, you can understand what drives user actions and where they face challenges.
Event tracking and autocapture
Event tracking is the foundation of behavior analysis. It involves defining and monitoring specific actions users take, such as clicks, form submissions, or video plays.
Why it matters: Events let you measure how users interact with key features and workflows.
How to get started: Identify the actions tied to your product goals. For example:
Sign-up form submissions.
Clicks on primary call-to-action buttons.
Usage of specific features like “Save” or “Share.”
UXCam’s autocapture technology eliminates the need for manual tagging, so you can focus on analyzing data rather than setting it up. You’ll get faster results and avoid common implementation headaches.
Heatmaps
Heatmaps provide a visual representation of user interactions, showing where users click, scroll, or hover on a page.
Why it matters: Heatmaps highlight high-engagement areas and help identify ignored or underperforming elements.
How to use it: Analyze heatmaps to understand:
Which CTAs attract the most attention.
Whether users scroll far enough to see important content.
If any elements distract users from completing their goals.
Combine heatmap insights with event data to confirm trends, like whether users engage with specific buttons after scrolling to them.


Session recordings and replays
Session replays allow you to watch user interactions in real-time, providing a qualitative perspective on user behavior. With UXCam’s native session replay, you can seamlessly integrate this feature into your analytics workflow. You’ll save time and gain accurate insights without needing to switch tools or manually match session IDs.
Why it matters: Session replays uncover the "why" behind user actions, such as why users drop off in a form or abandon their carts.
How to use it:
Identify recurring navigation issues (e.g., rage clicks or unresponsive buttons).
Validate hypotheses from heatmap and funnel data.
Highlight usability challenges in complex workflows.
Use session replays to prioritize fixes by focusing on high-value journeys, such as onboarding or checkout.
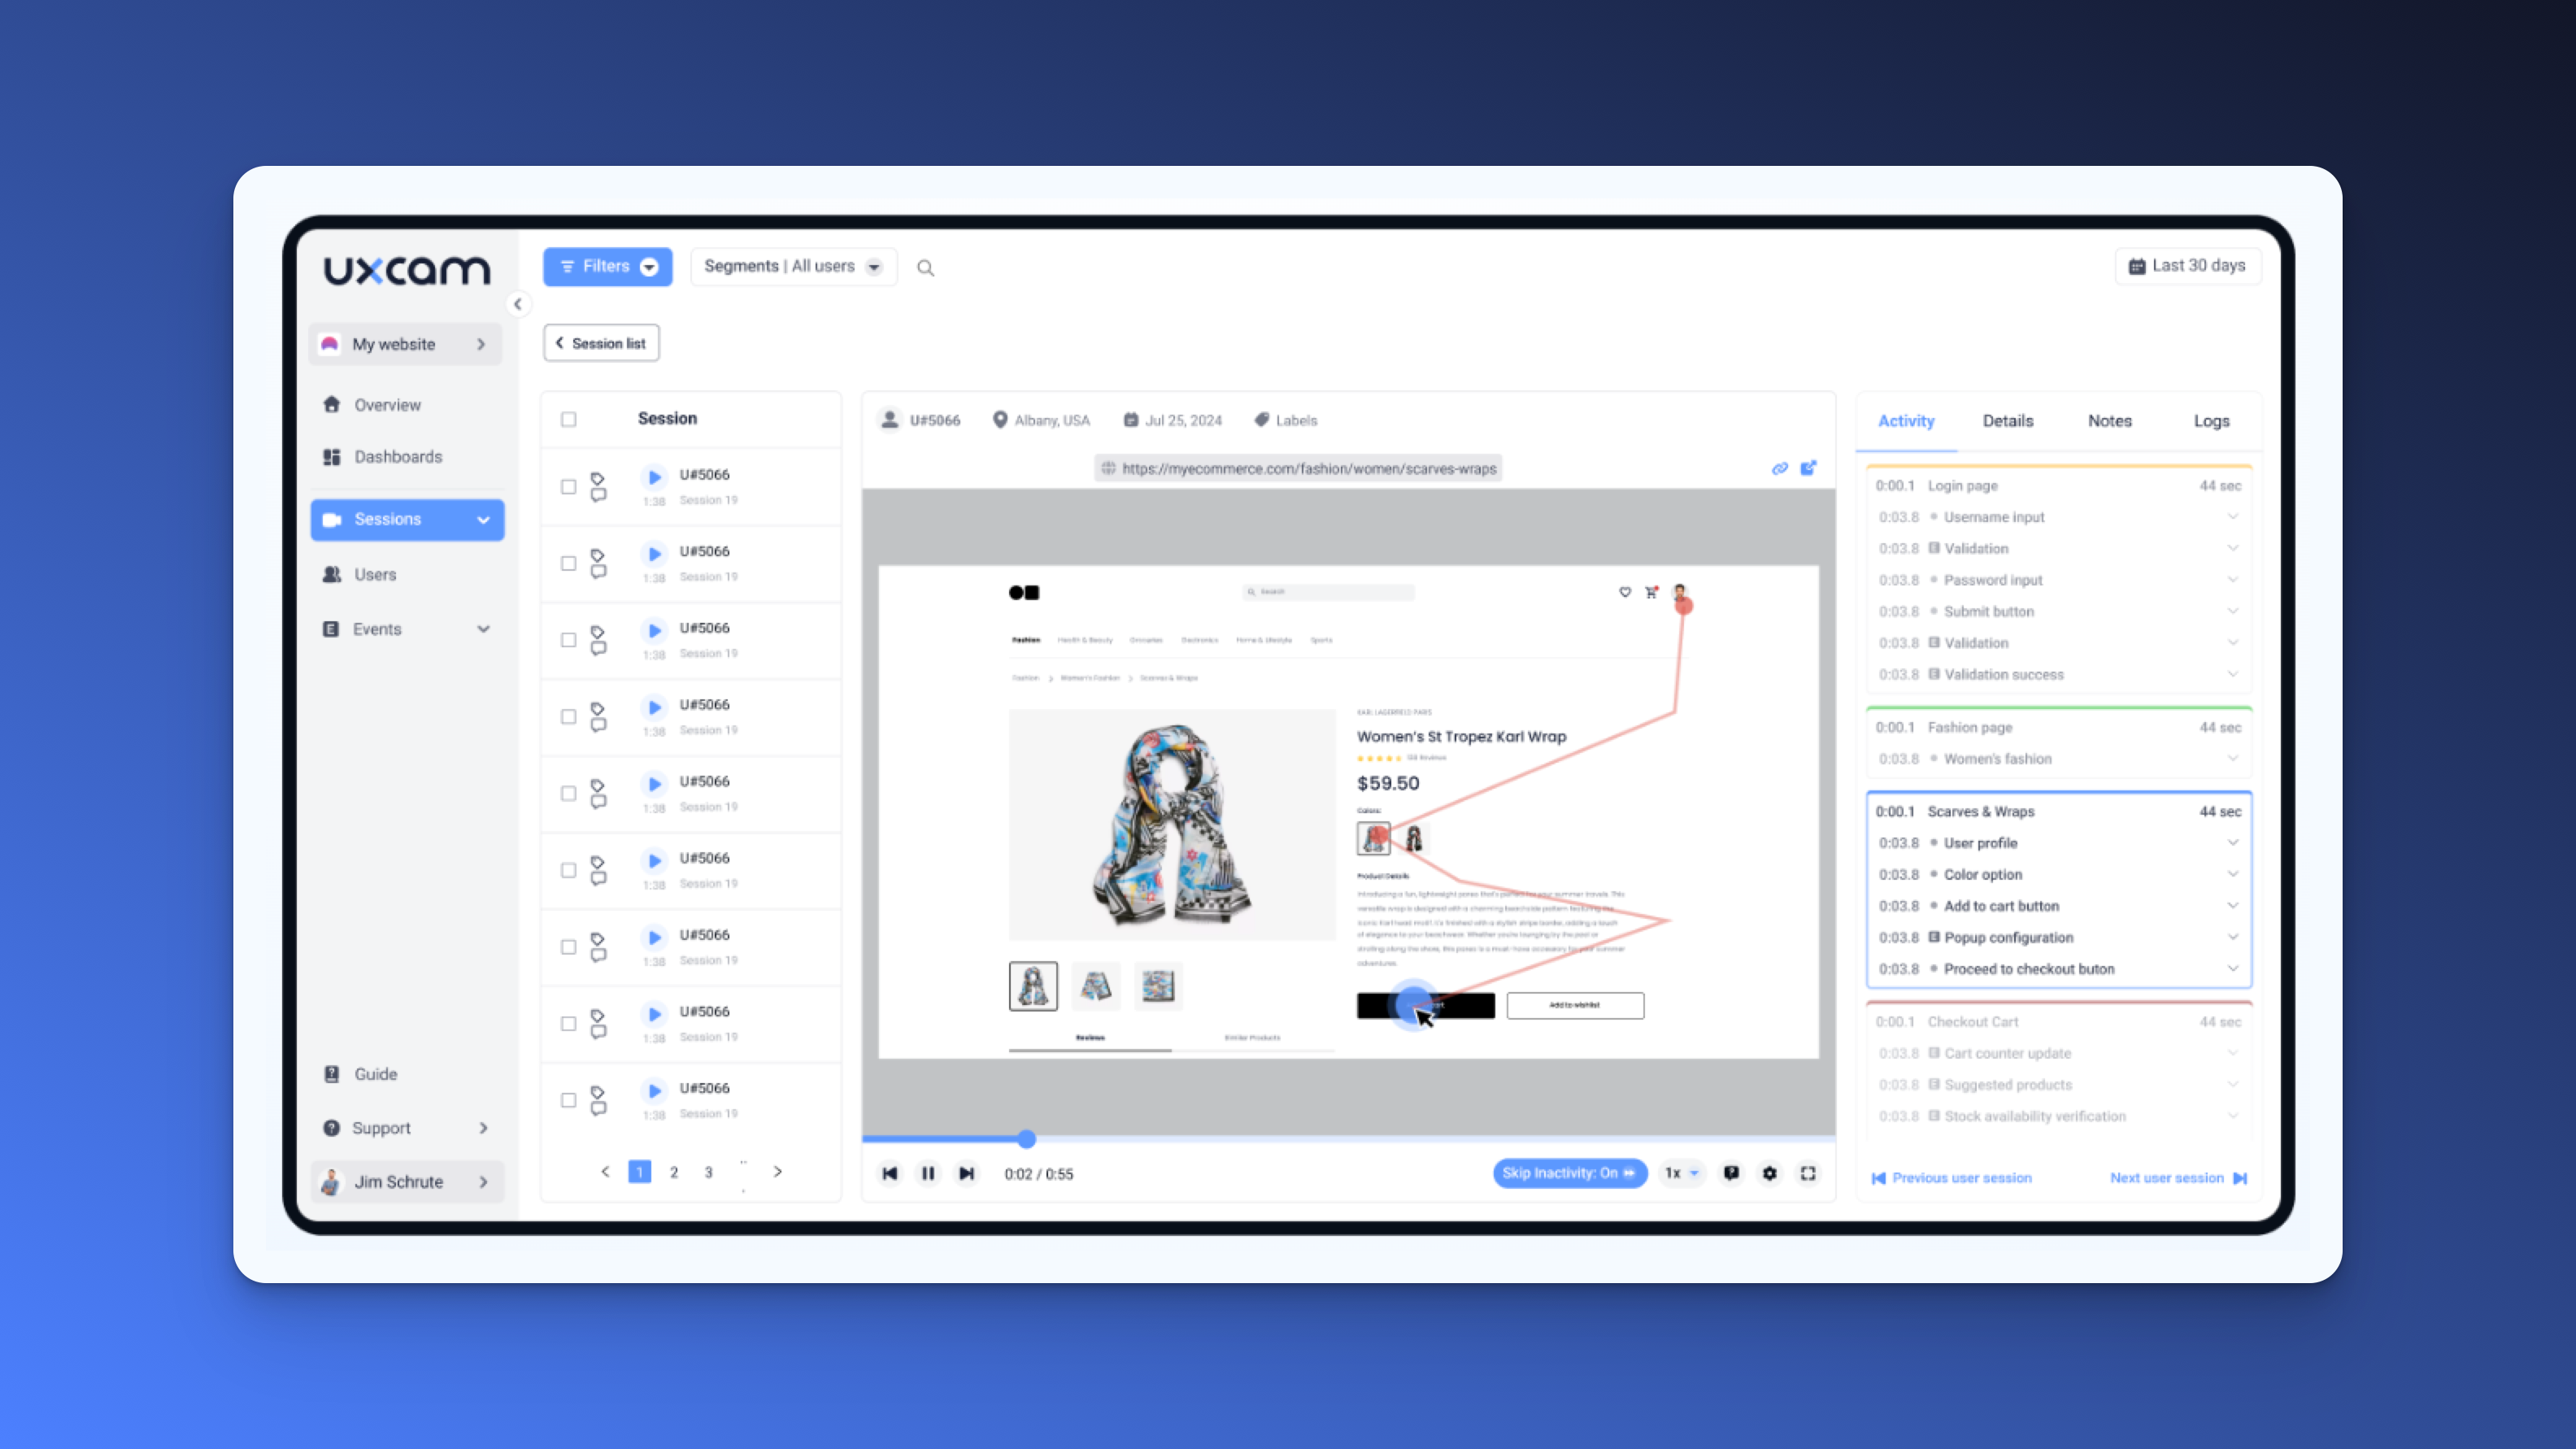

Funnels and user flows
Funnels map the steps users take toward a conversion, such as completing a purchase or signing up. They help you understand user flow efficiency and pinpoint where users drop off. UXCam simplifies funnel analysis with one-click cohort and funnel reports. You can quickly identify trends and make data-driven decisions, ensuring a smooth and engaging user experience.
Why it matters: Funnels give a clear picture of how users progress through critical paths and where friction occurs.
How to use it:
Set up funnels for key workflows like onboarding, feature adoption, and purchases.
Measure conversion rates at each step.
Investigate drop-offs with session replays and heatmaps.
Regularly review and adjust funnels as user behavior or product features evolve to keep insights relevant
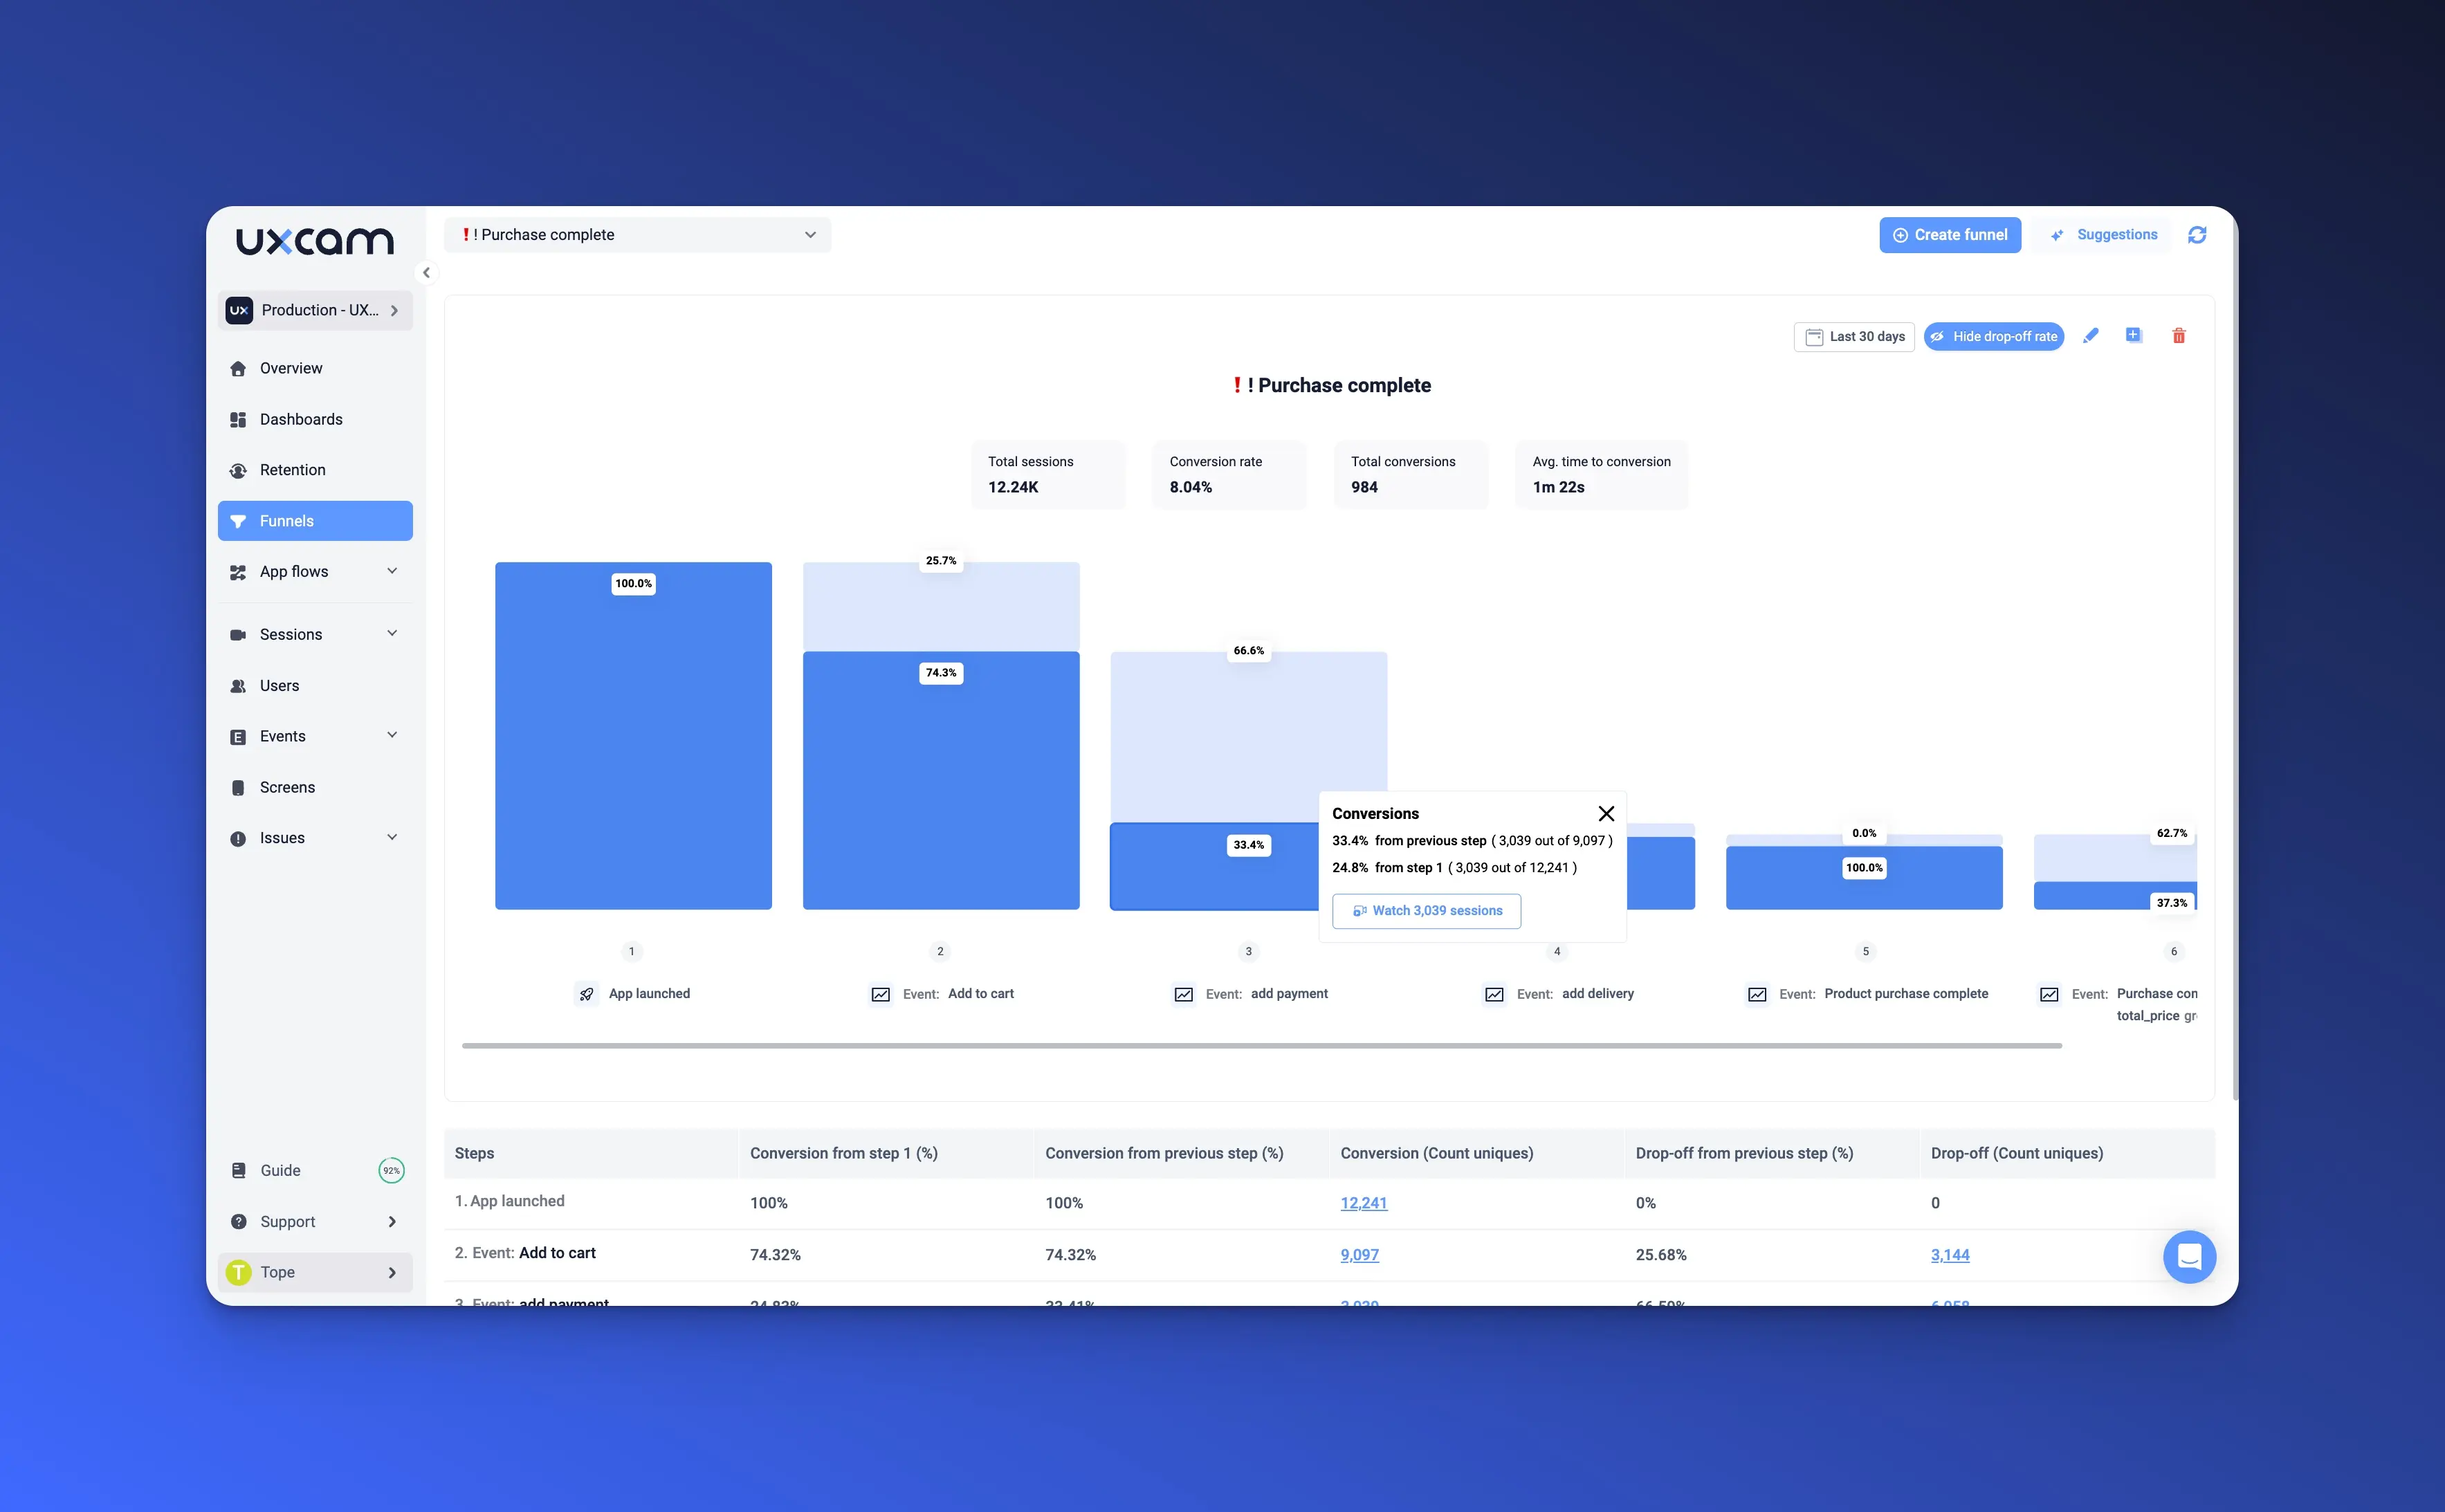
What are the challenges of user behavior tracking?
Tracking user behavior provides powerful insights, but the process comes with its own set of challenges. From fragmented data to privacy concerns, these hurdles can hinder your ability to get the most from your analytics tools.
1. Fragmented data sources and tool silos
One of the biggest challenges is managing data across multiple tools that don’t integrate well. Teams often use separate tools for event tracking, session replays, heatmaps, and analytics. This results in:
Inconsistent insights: Data from different tools doesn’t always align, leading to incomplete or conflicting results.
Time-consuming processes: Manually combining data from silos wastes valuable time and resources.
Example: If you’re using one tool for heatmaps and another for session replays, you might struggle to link specific heatmap interactions to the user’s full session journey.
Solution: With UXCam’s, you can eliminate silos by combining session replays, event tracking, and funnel analysis into a single tool. This provides a complete picture of user behavior without the need for multiple integrations.
2. High learning curve for team adoption
Even the most feature-rich tools can fail if your team struggles to use them effectively. Challenges include:
Complex interfaces: Tools with steep learning curves can discourage adoption, especially among non-technical team members.
Customization overload: Advanced features requiring heavy configuration can slow down implementation.
Solution: UXCam’s user-friendly interface and autocapture technology simplify setup and usage. With minimal engineering effort, your team can start tracking key user actions immediately. This allows product managers, marketers, and designers to access actionable insights without technical expertise.
3. Privacy concerns and data compliance
As data privacy regulations like GDPR and CCPA become stricter, ensuring compliance is a top priority. Challenges include:
User consent management: Ensuring users explicitly agree to data collection.
Secure data handling: Protecting sensitive user data from breaches or misuse.
Solution: UXCam is built with privacy in mind:
GDPR and CCPA compliance: Tools to manage user consent and ensure regulatory compliance.
Data anonymization: Automatically mask sensitive information to protect user privacy.
Secure infrastructure: SOC 2 Type II certification ensures top-tier data security standards.
How UXCam simplifies user behavior tracking
UXCam addresses these challenges with a seamless, all-in-one solution:
Autocapture capabilities: Automatically track key events and interactions out-of-the-box.
Quick setup: Reduce implementation time from months to weeks with a single SDK.
Integrated insights: Access heatmaps, session replays, and analytics in one platform for a holistic view of user behavior.
Best practices for analyzing user behavior
User behavior analysis is evolving rapidly, and staying ahead means adopting practices that provide meaningful insights while saving time. Let’s explore the best ways to analyze user behavior effectively in 2025.
1. Focus on the entire user journey
Understanding your users requires looking at their full experience, not just isolated actions. Analyzing the entire journey helps you see how users interact with your product from start to finish.
Combine quantitative data (like funnel conversion rates) with qualitative insights (from session recordings and heatmaps). For example:
Use funnels to identify drop-offs at specific steps.
Dive deeper with heatmaps to see where users focus their attention.
Watch session recordings to understand
why
users struggle or leave.
Visualize the full journey using tools like UXCam, which integrate these features seamlessly. This lets you spot patterns that might otherwise be hidden.
2. Adopt a hypothesis-driven approach
Before diving into data, always start with a question. For instance:
“Why do users drop off during onboarding?”
“What drives higher engagement on feature X?”
This hypothesis-driven method keeps your analysis focused and actionable. Once you have answers, quickly implement changes and test them.
Here’s a simple process:
Formulate a hypothesis (e.g., “Reducing form fields will increase sign-ups”).
Analyze relevant data to test your theory.
Act on the results and measure the impact.
Combine quantitative data from events with qualitative tools like session replays to validate your assumptions and refine solutions.
3. Segment Your users
Not all users are the same, and treating them as such can lead to misleading insights. Segmentation allows you to focus on specific user groups and tailor their experiences.
Examples of useful segments include:
New vs. returning users: Understand onboarding challenges for new users versus feature engagement for returning users.
User personas: Track behavior by user roles, such as power users vs. casual users.
Device types: Compare mobile, tablet, and desktop interactions to optimize experiences.
| Segment Type | Key Insights | Actionable Example |
|---|---|---|
| New Users | Challenges during onboarding | Simplify sign-up and onboarding flows. |
| Returning Users | Features driving retention | Improve underused but critical features. |
| Device-Based Users | Platform-specific pain points | Optimize mobile usability if drop-offs are high. |
Use advanced segmentation tools like those in UXCam to isolate specific behaviors, identify patterns, and personalize improvements.
Automate and scale
Manual data analysis can slow you down, especially as your product grows. Automating repetitive tasks helps you scale analysis without compromising on quality.
Look for analytics platforms with automation features, such as:
Autocapture: Automatically track basic events to ensure no data gaps.
Automated Dashboards: Get real-time updates on key metrics without manual reporting.
AI Insights: Leverage tools that surface anomalies or suggest optimizations.
UXCam’s automation capabilities, like one-click cohort reports and AI-driven funnel suggestions, make it easier to scale your efforts without adding complexity.
Conclusion
User behavior tracking is no longer optional—it's a cornerstone for creating products that users love. By understanding how people interact with your product, you can uncover hidden opportunities, fix pain points, and improve overall user satisfaction.
Tracking user behavior effectively helps you make data-driven decisions that drive growth. Whether it’s optimizing your onboarding flow, increasing feature adoption, or reducing churn, the insights you gain can transform your product and business.
Are your current analytics solutions providing the depth and clarity you need? Are you combining quantitative and qualitative data for a complete picture of user behavior? These questions can help you determine if it’s time to upgrade your approach.
If you’re ready to simplify your tracking and analysis, consider trying UXCam. Start your free trial of UXCam today and see the difference it can make in your product journey!
FAQs
User behavior tracking FAQs
You might also be interested in these;
How to Find Active Users of an App
UX Optimization: 4 Steps to deliver a better user experience
21 Website Visitor Tracking Tools with Top-Rated User Reviews
6 Best User Engagement Tools for Product Teams
5 Most Important User Adoption Metrics to Track and Measure
User Adoption Dashboard Examples And How To Use Them
AUTHOR

Tope Longe
Product Analytics Expert
Ardent technophile exploring the world of mobile app product management at UXCam.
What’s UXCam?
Related articles
Conversion Analysis
Top 7 Best Mobile App Usability Testing Tools Compared (2026)
Discover the best tools for mobile app usability testing. Compare UXCam, UserTesting, Maze, and more to capture real user behavior and boost...

Jonas Kurzweg
Product Analytics Expert
Conversion Analysis
Top 51 Mobile App KPIs: Ultimate List 2026
51 mobile app KPIs — determine the KPIs and metrics that matter the most for your...

Jonas Kurzweg
Product Analytics Expert
Conversion Analysis
The Flutter Session Replay Tool: UXCam
Optimize your Flutter app's performance with UXCam's session recording and replay tool. Easy integration, optimized features, and strong...

Jonas Kurzweg
Product Analytics Expert


