Back to blog
9 MIN READ
7 Best AB Testing Tools for Mobile Apps
PUBLISHED
26 November, 2024

Product Analytics Expert

Being confident in what you don’t know is the start of any successful A/B testing campaign. Business decisions based purely on gut feelings or past experiences are biased and may not have the end user’s best interest in mind.
A/B testing mobile apps and an overall culture of experimentation help mobile app product managers and marketers reduce the cost of new ideas and optimize conversion rates.
Purely quantitative A/B testing tools can provide statistics about what the best performing variation from your test was. But these numbers are more powerful when paired with qualitative — non-numerical data — that unfurls the how and why of user behavior, and that’s what all customer success stories are made of. A great experimental product hypothesis uses the preliminary research of both methods.
Summary - Best AB testing tools for mobile apps
Let's review the best mobile app a/b testing tools and software for running mobile app experiments to improve app conversion rates.
| Tool | Use Case | Platform |
|---|---|---|
| Firebase | Quantitative A/B Testing | Web and Mobile Apps |
| Optimizely | Quantitative A/B Testing | Web and Mobile Apps |
| Apptimize | Quantitative A/B Testing | Web and Mobile Apps |
| UXCam | Qualitative & Quantitative Analytics | Mobile Apps only |
| VWO | Qualitative & Quantitative Testing | Web and Mobile Apps |
| Hotjar | Qualitative Analytics | Web and Mobile Web Only |
| Crazy Egg | Qualitative & Quantitative Testing | Web and Mobile Web Only |
Firebase
Firebase is Google’s mobile and web app development platform that offers developers several different tools and services. You can use it to manage backend infrastructure, monitor performance and stability, and mobile app A/B tests.
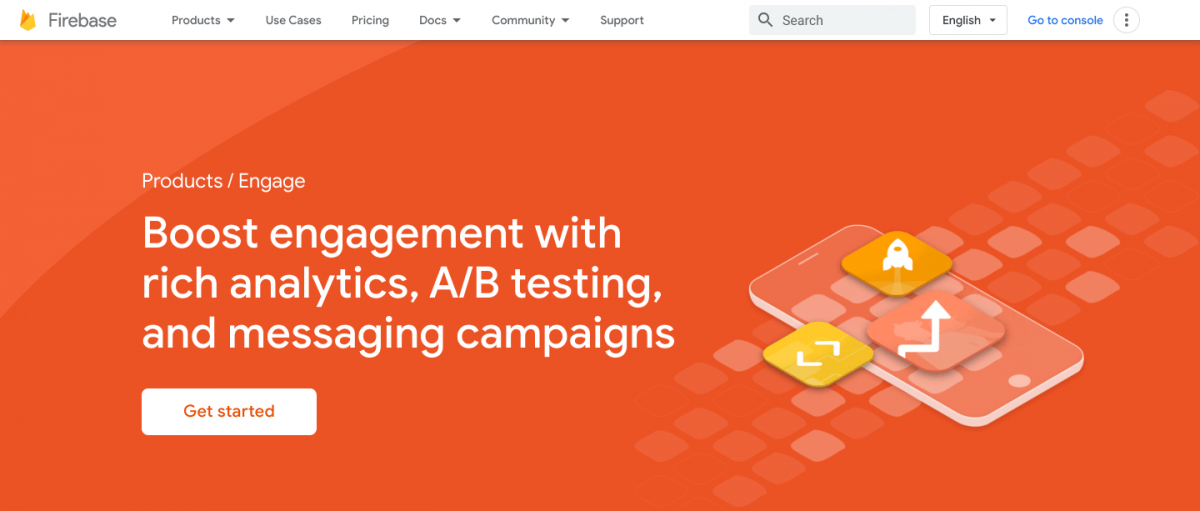

For: Websites and mobile. Features: Google Analytics, prediction, A/B testing, authentication, crashlytics. Pricing: Free and custom-paid plans.
Optimizely
Optimizely is an experimentation platform that makes it possible to build and run A/B and multivariate tests on websites and mobile apps. You can create a variety of Optimizely experiments for your web pages. Optimizely Classic Mobile allows you to run Optimizely experiments in your iOS or Android app.
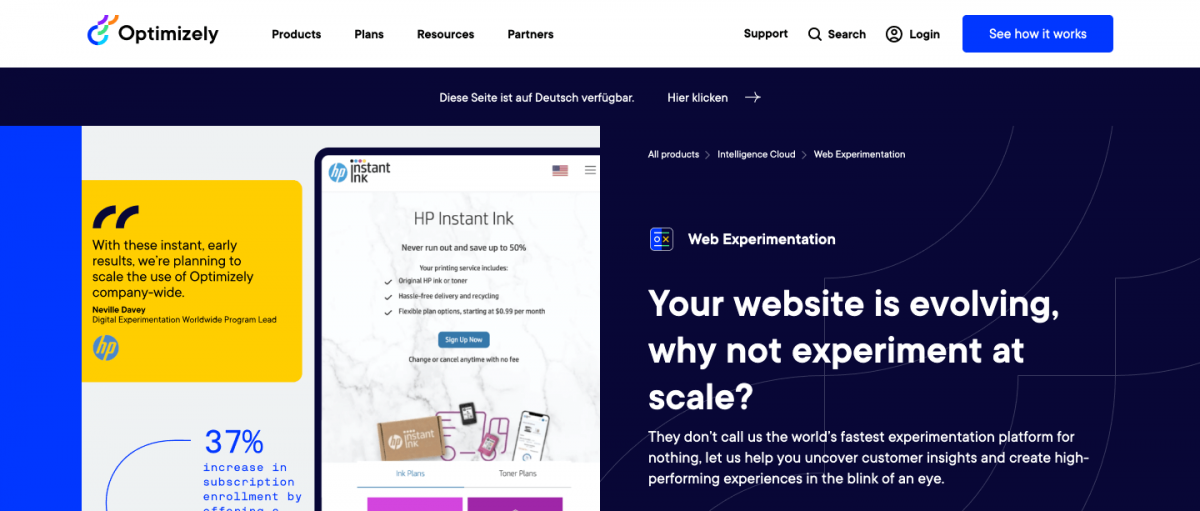

For: Websites and apps. Features: A/B tests, basic reporting. Pricing: Various plans are available, with a focus on large enterprises.
Apptimize
Apptimize is a cross-platform tool for experimentation, optimization, and feature releases. You can run A/B tests across multiple platforms through a centralized dashboard. The tool also manages releases with staged rollouts.

For: Website and apps. Features: A/B testing, feature flags. Pricing: 30-day free trial, custom pricing.
There you have it, our list of the best mobile app ab testing tools. Next, we will explore the best qualitative analytics tools to support your mobile app a/b testing software.
The best qualitative analytics software to use with A/B testing platforms
UXCam
Of course, we’re biased, but you’d be hard-pressed to find a more comprehensive tool just for mobile apps. UXCam offers event analytics, but more than that, you can click through into individual experiences. Within the dashboard, you can tag user sessions and filter for issues like rage taps, and unresponsive tap heatmaps, see where users drop off in the funnel, and manually investigate and review sessions.
This incredible level of detail enables conversion rate optimization (CRO) professionals, marketers, and developers to form solid hypotheses and decide what to test. UXCam integrates with:
Native Android
Native iOS
Flutter
React Native
Cordova
Xamarin
Nativescript
Check out our developer page to learn how to use UXCam alongside A/B testing platforms like Firebase, Crashlytics, Intercom, and Amplitude.
For: Mobile apps. Features: Heatmaps, session recording, funnels, user analytics, events, issue analytics. Pricing: Free trial, price upon request.
Sign up for a free UXCam account here.
Why use a qualitative tool like UXCam?
The A/B test took a lot of planning, meetings, and analysis. Developing a shorter sign-up flow and rolling it out is time- and resource-consuming. The team could have saved a lot of time if they had validated their hypothesis before rolling out the experiment.
As you can see from our restaurant example, even when data events are triggered in your app, it’s still hard to understand the motive behind certain decisions. You can better understand why people weren’t moving on to the next screen, not just that they weren’t progressing in onboarding. Widen the context of behavior by viewing heatmaps and session recordings from specific events. With this information, you can understand the user’s frustration a bit more and strengthen your assumption.
VWO
VWO is a comprehensive A/B testing and analytics tool that businesses use for experimentation, conversion rate optimization, usability testing, and more. It is possible to set up and run A/B tests and multivariate tests directly in the VWO editor.
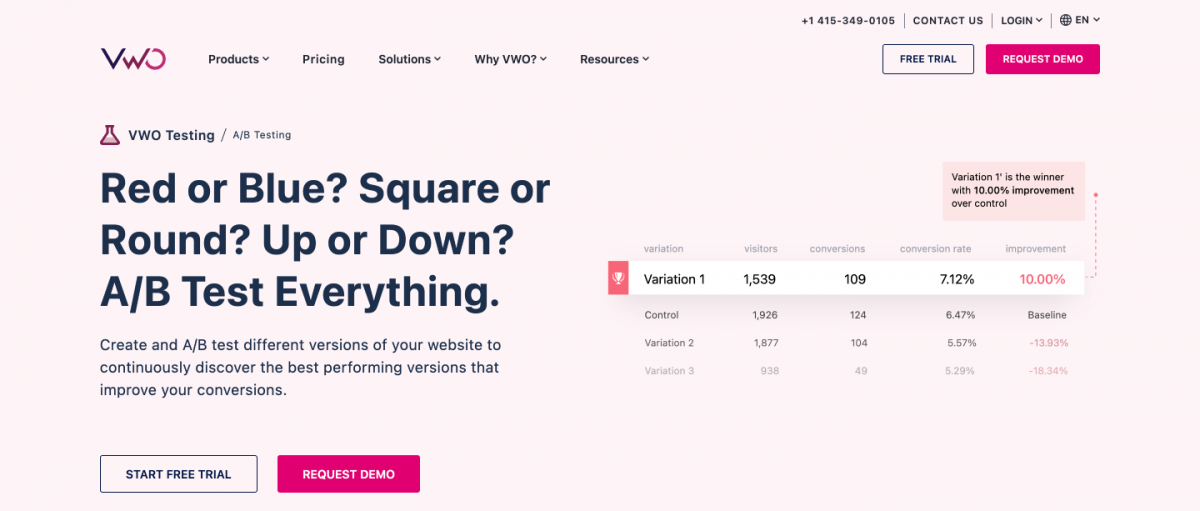

For: Websites and apps. Features: A/B tests, heatmaps, surveys, form analytics. Pricing: Three plans are available based on the features required.
Hotjar
Hotjar is only available for mobile web, but we still wanted to give it an honorable mention. It aims to give you the big picture of how to improve user experience. The tool combines many sources of qualitative data, including heatmaps, session recordings, and user surveys. Its best-known feature is probably the heatmaps, featuring mouse clicks, moves, and scrolls. While Hotjar is an extremely popular and powerful tool for websites, it is not compatible with mobile apps. If you're looking for a tool that offers heatmaps and session recordings for mobile apps, check this out.
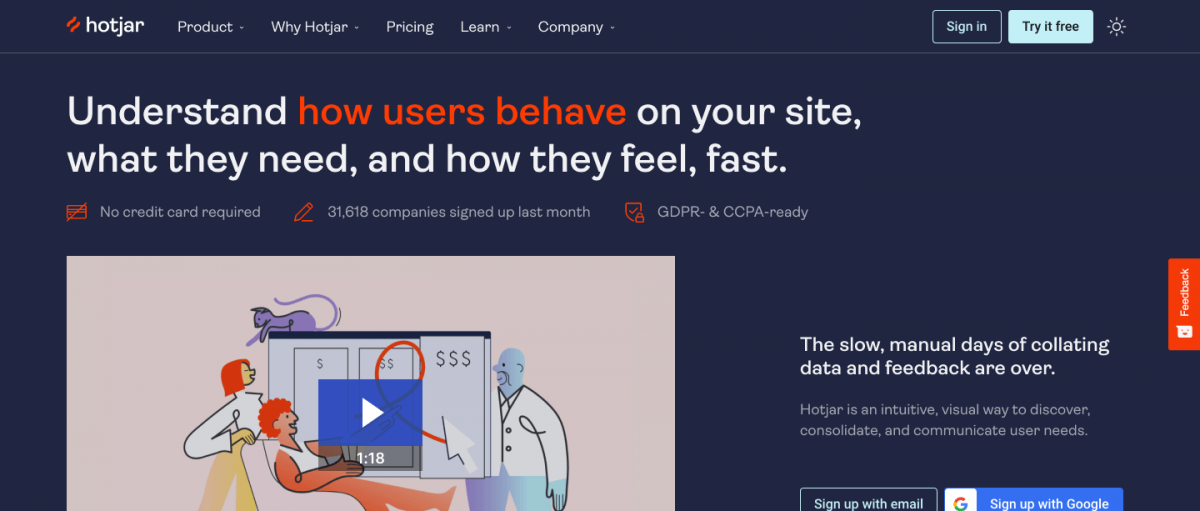

For: Websites and mobile web only. Features: Heatmaps, session recording, incoming feedback, surveys. Pricing: Offers personal, business, and agency plans.
Crazy Egg
Crazy Egg, also only available for mobile web, offers similar functionality to Hotjar, with heatmaps and session recordings available, as well as built-in A/B testing. According to CrazyEgg, over 300,000 websites use their tool to improve what’s working, fix what isn’t, and test new ideas.
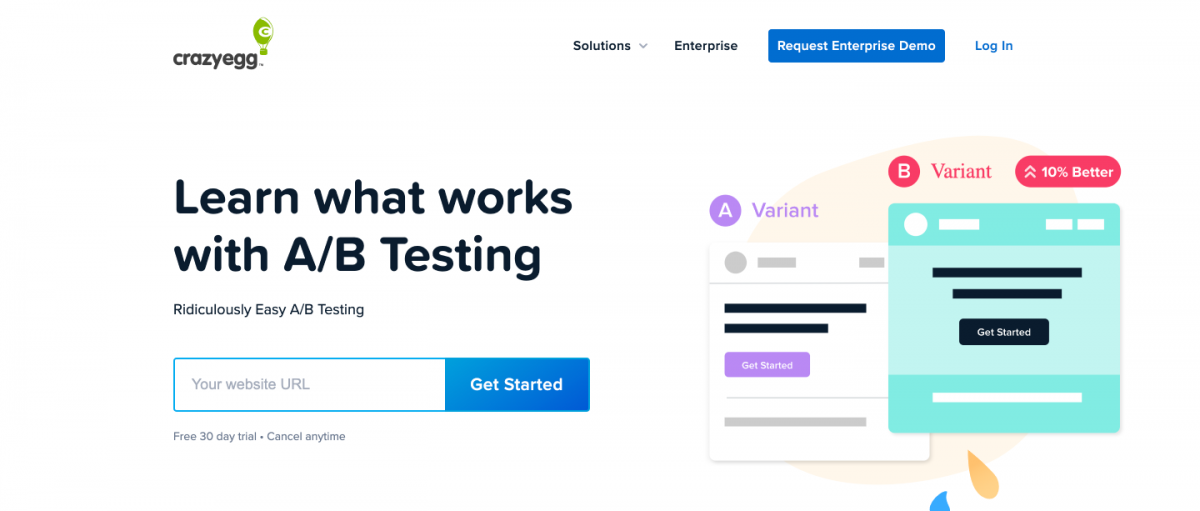

For: Websites and mobile web only. Features: Heatmaps, session recording, A/B testing. Pricing: Starts at $24 per month for their basic plan with tailored pricing for enterprise.
What is A/B testing?
In mobile app marketing, A/B testing is often used to optimize conversion rates. It’s a controlled experiment where a sample size of users is randomly split into two groups. One group is exposed to the treatment. The latter is used as a control to measure changes.
Group A is exposed to the variant, such as different font colors on the screen, whereas Group B’s environment experiences no changes from the original. If a difference is detected and there’s a high enough statistical significance, the product managers usually confirm or reject their hypothesis.
What questions can A/B testing help me answer?
Asking qualitative questions can lead to highly successful A/B tests. At best, quantitative numbers can indicate the user experience, but numbers used alone can be misleading. They tempt us to draw our conclusions too early.
Once you’ve reached statistical significance with your quantitative results, it’s time to move on to questions that behavioral analytic tools can help you answer:
Behavioral attribution: Was the improved onboarding a result of darkening the color of the buttons? What other factors influenced changes in behavior on the app?
Source of frustration: At what point and why did they decide to leave without completing onboarding?
Motivation: What was the user looking for when they opened up the app?
Use case
Enhancing quantitative A/B testing: How qualitative data helped find the root cause of a low-performing conversion funnel for this mobile app.
The situation:
A restaurant chain has just launched its new app, migrating its website to mobile for online orders. The company has done competitor analysis and some user research about how the new user sign-up flow should be designed. They conclude that the process would be more user-friendly if they only ask for one data entry field per screen, like this:
Screen 1: Enter email address
Screen 2: Enter name
Screen 3: Set up a password
Screen 4: Confirmation of email verification done by the user
Screen 5: Accept privacy policy & optional marketing newsletter opt-in
After enough data flows in, the registration funnel shows that the conversion rates are below expectations and industry averages. There’s a high drop-off rate after the password setup screen.
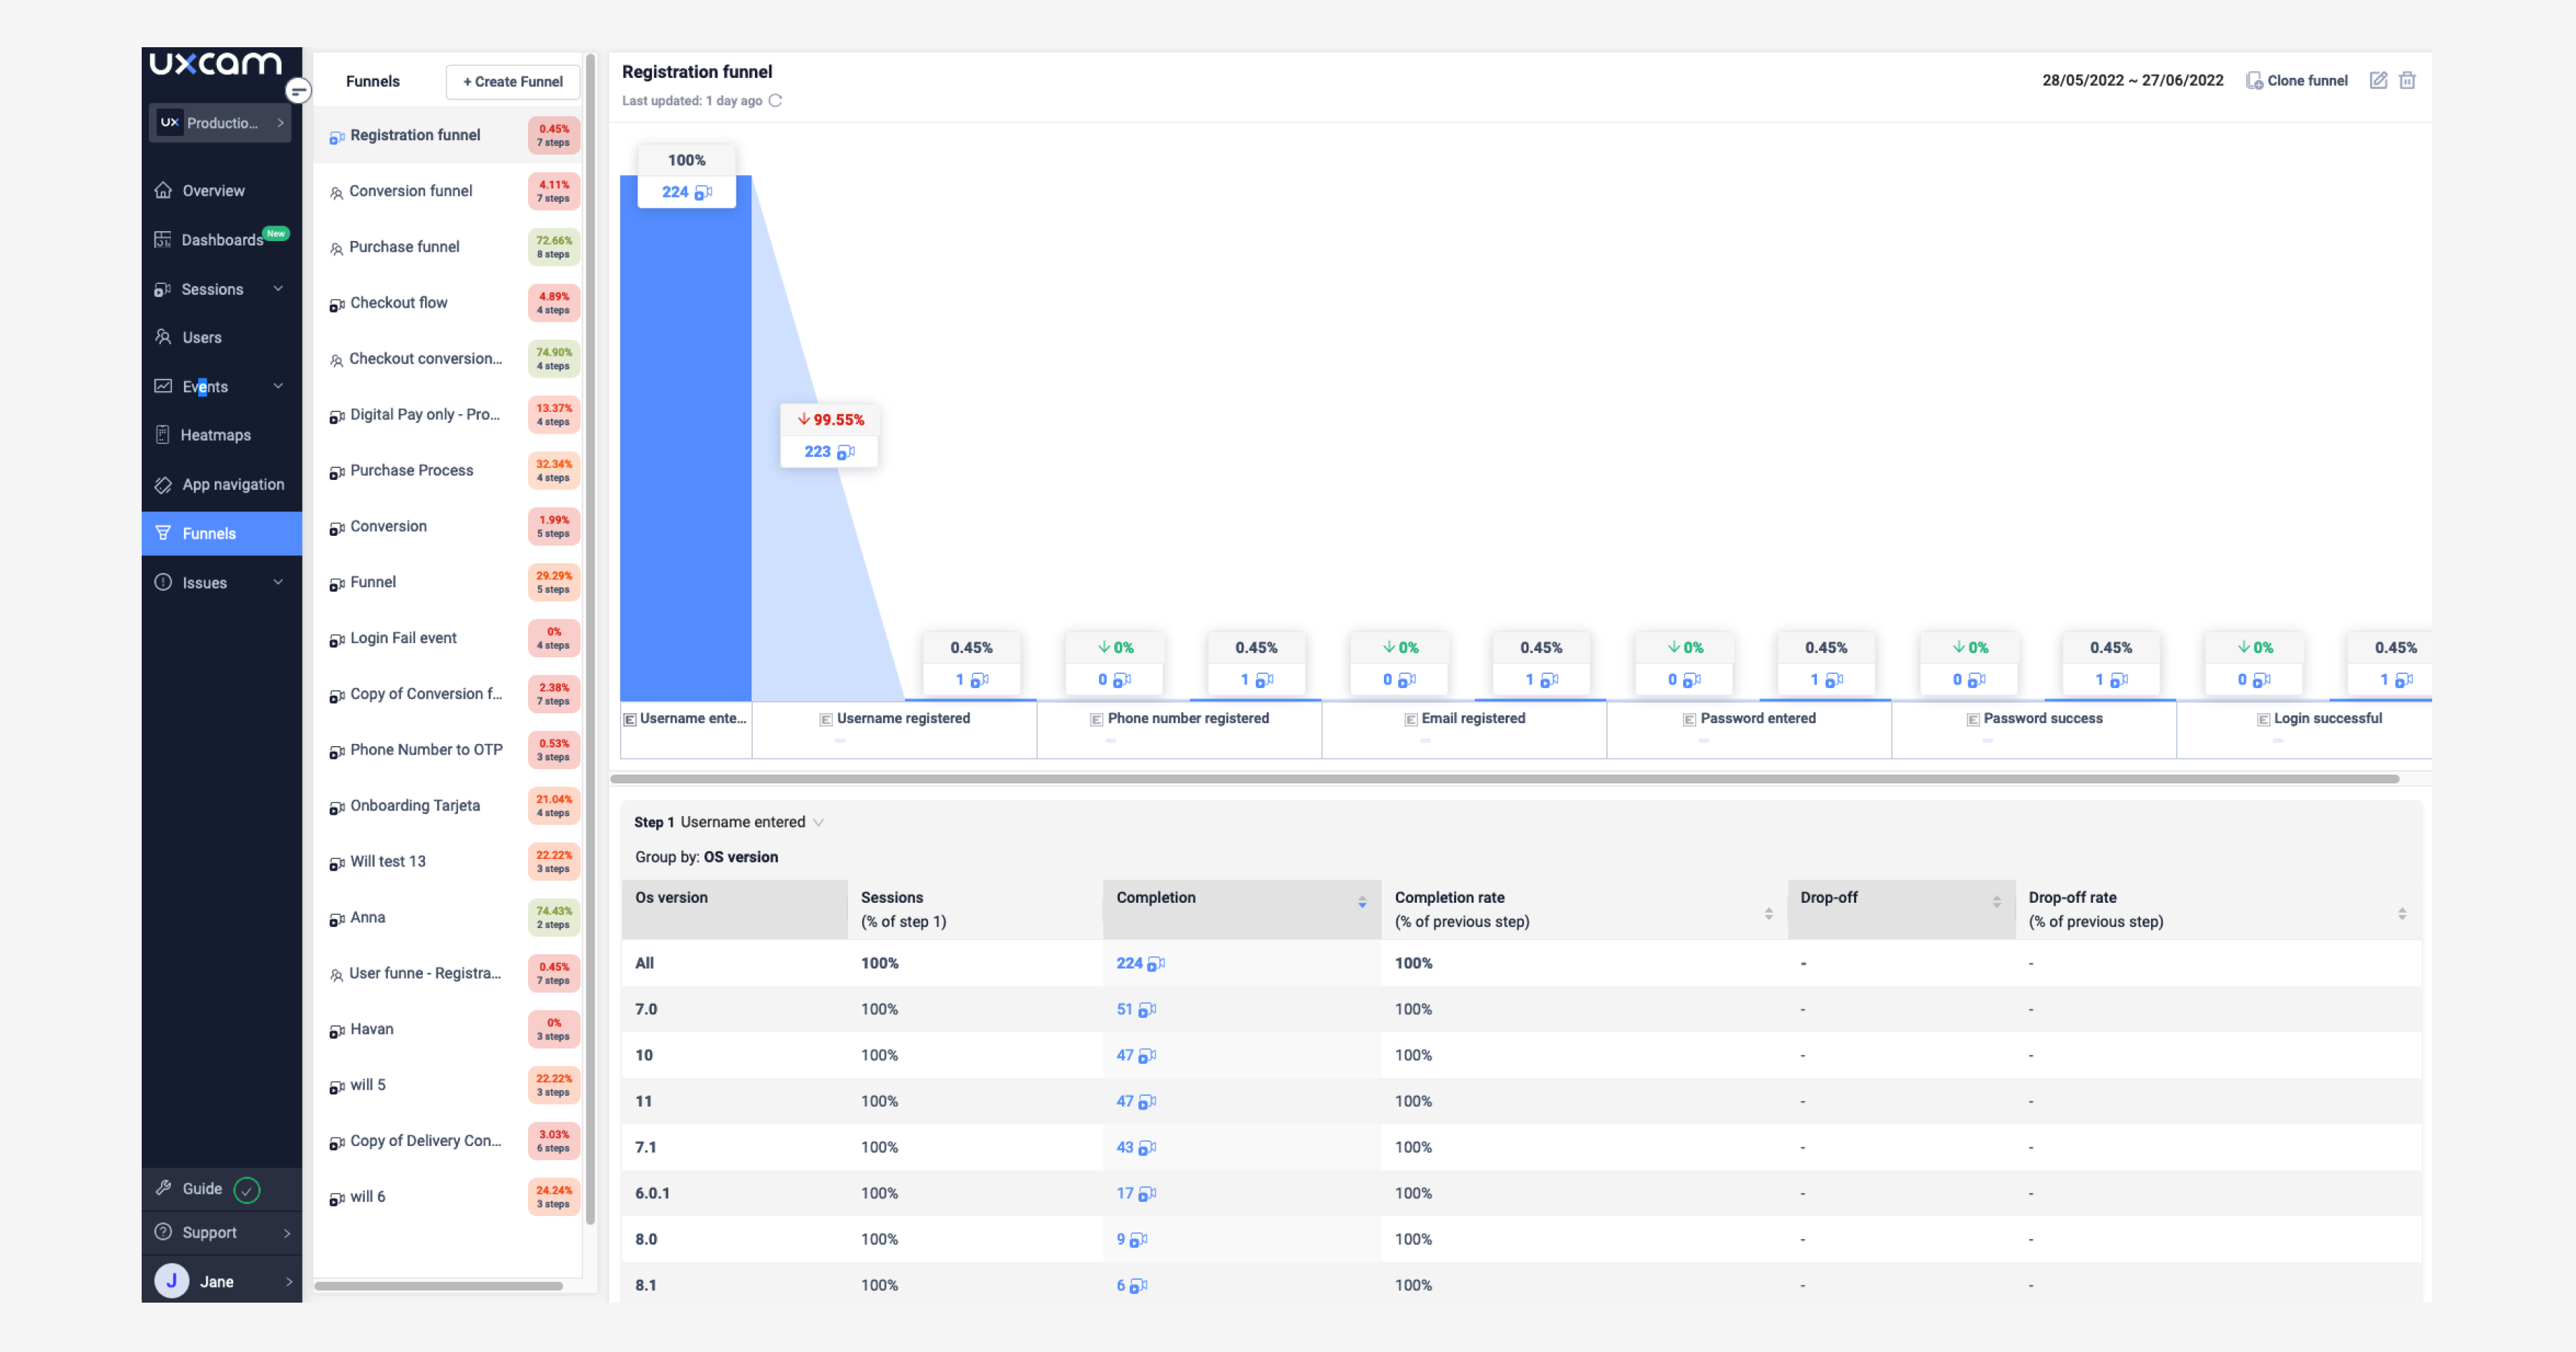

Breadcrumbs were also shown to users (e.g., they could see they were on step 3 of 5) about their progress. Based on the numbers and a few user interviews, the team assumes that the users expected some steps to be skippable or completed on one screen. But when the users saw that there were still two more steps left upon setting up the password, they abandoned the process.
Forming a hypothesis based on past experiences:
The product lead had previously worked with a competitor restaurant mobile app. The app she worked on had 3 registration screens in total. The registration conversion rate was 20% higher than the current conversion rate. She argued that if they shortened the process and combined the following screens:
Screen 1: Name and email
Screen 2: Password setup and opt-in
Screen 3: Confirmation of email verification done by the user
…they would be able to increase the conversion rate.
Quantitative hypothesis: Reducing the registration process from 5 to 3 screens will increase the registration conversion rate by 20%.
The UX/UI design team countered that these proposed changes would overwhelm the user and further damage conversion rates. Therefore simply switching to 3 screens was not feasible. To quash this debate, the product manager decided to run an A/B test to measure the impact of the proposed simplification in the sign-up flow.
A/B testing outcome:
After testing the hypothesis on a treatment group, the team found that the reduced number of screens did not solve the problem. There was still a high drop-off rate at the password creation step. Thus the hypothesis was rejected.
The product team had asked the engineering team to set up a custom event that tracks password errors. The number of password errors has increased significantly since the team launched the new sign-up flow. After diving into the data, and segmenting by app version, the team has found that password setup errors were only high in the latest version (e.g.: version 1.4 vs. 1.3). Considering that the password requirements did not change since the update, the team did not understand what was the issue.
This is where the qualitative data comes to the rescue and provides vital context to understand the root cause of the low-performing funnel:
The team uses a second product analytics tool to deep dive into session replays of the password creation step — the stage with a high drop-off rate. The recorded videos show users repeatedly entering passwords after continuously seeing the “password not strong enough” banner.
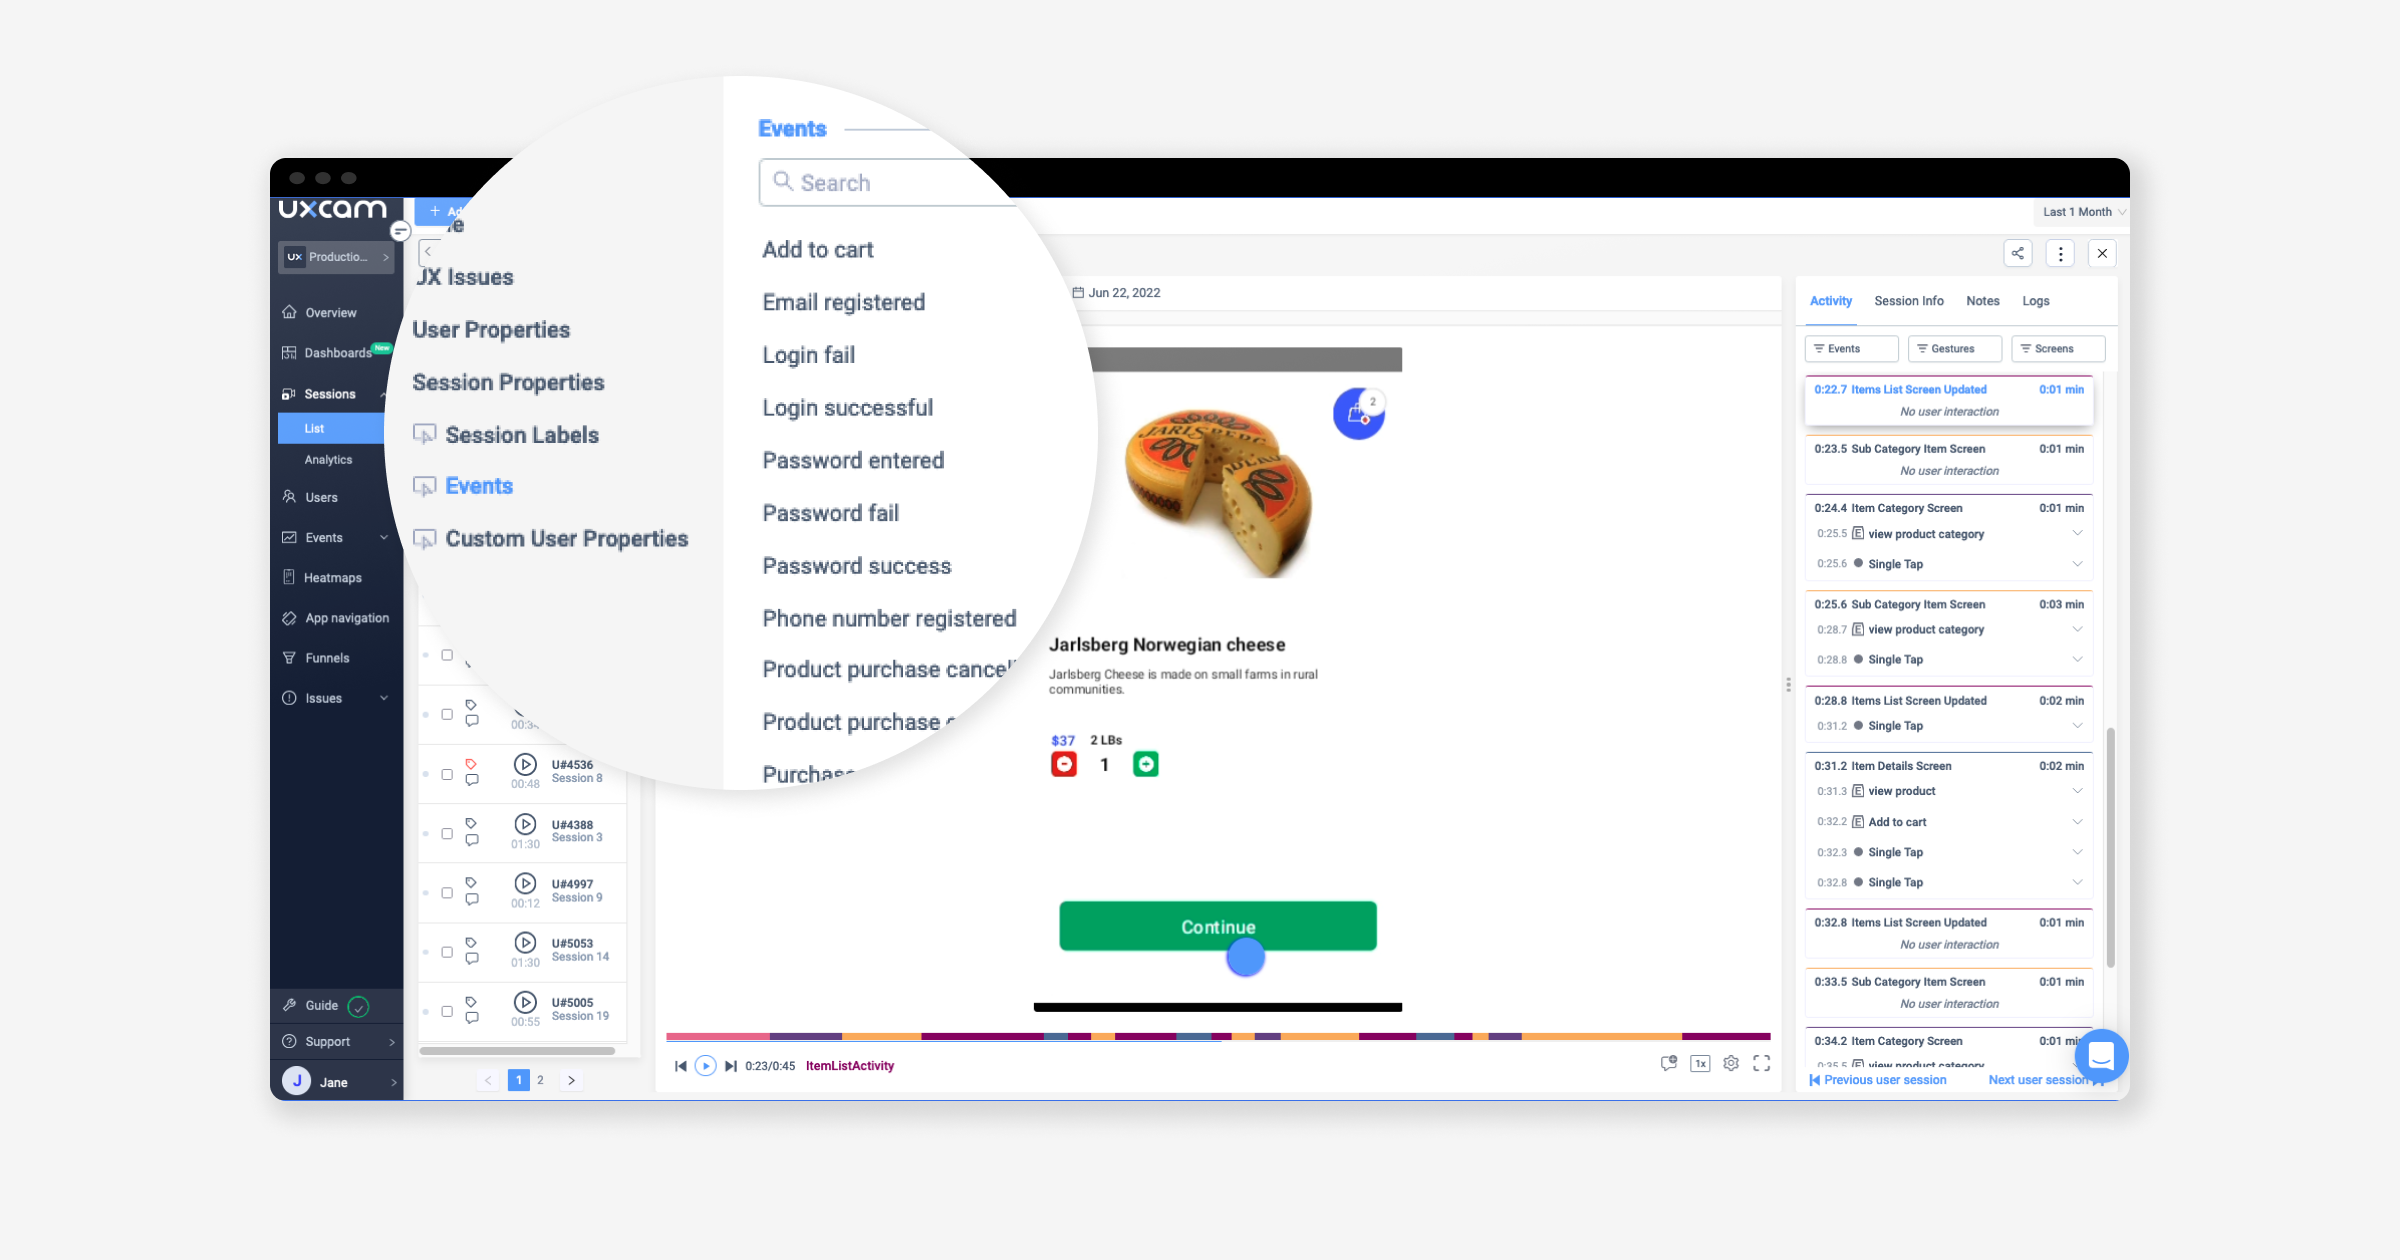

Upon further investigation, it turns out that the engineering team’s password security setup required users to use capitals and special characters. However, the UI in the latest version didn’t communicate this to the user. It just kept sending error messages that “the password isn’t strong enough.”
And there’s the aha moment. They tested the following changes in the treatment group:
Made the password requirements less strict by removing the need for a capital letter but enforced only special characters.
Added microcopy under the password field of the requirements, “
Must include at least one special character.”
Set up a weak, medium, and strong indicator below the password field, revealing a real-time update of the strength as users type their passwords.
After the updates, they immediately noticed an uplift in conversion rates.
So the initial quantitative hypothesis that the number of screens was impacting the conversion rate could not be proven. Instead, the real problem needed to be uncovered by qualitative analysis of the user behavior in the conversion funnel.
How do I create my own A/B testing hypothesis?
Creating a valid, testable hypothesis is how product managers and marketers can ensure they’re testing with the customer in mind. A hypothesis is a statement that looks something like: “If x, then y will increase by z.” As mentioned in our introduction, qualitative tools can help you write this.
A compelling hypothesis is always a result of several different data points and recommendations for a change that will positively affect your conversion rate. Craig Sullivan, conversion rate optimizer, offers this excellent template for writing a data-backed hypothesis that:
Explains the data
Lists the impact
Specifies the primary deciding metric that will tell if the change makes an impact
To learn more about forming a hypothesis, check out the section “Step #2: Forming Hypothesis” in our full guide to mobile website conversion optimization.
Which behavioral analytics tools can I use to craft my hypothesis?
If you’re trying to increase the conversion rate of a mobile app, you’re likely already using a quantitative analytics tool like Firebase or Optimizely (more on those later). These quantitative reports give you insights into the results of how different audiences reacted to different variables that you’ve set up. Using an additional SDK that focuses on behavioral analytics will complete the picture.
Here’s what matters
For some app marketers, qualitative data is seen as an afterthought because it can be time-consuming to collect — endless interviews, recordings, and surveys can be overwhelming. Fortunately, in 2021 there are plenty of behavioral analytics tools that will help you scale and optimize your research process.
If you’d like to know more research and tools, check out our other articles:
5 fantastic remote usability testing tools you can use now
Top 11 mobile app analytics tools
Qualitative vs. Quantitative Analysis (Exclusive Infographic)
Top 5 product Analytics Tools (Expert Guide)
AUTHOR

Jane Leung
Product Analytics Expert
Jane is the director of content at UXCam. She's been helping businesses drive value to their customers through content for the past 10 years. The former content manager, copywriter, and journalist specializes in researching content that helps customers better understand their painpoints and solutions.
What’s UXCam?
Related articles
Curated List
FullStory alternatives - Top 10 analytics tools to choose
Interested in FullStory but curious to know what alternatives are out there? Learn how analytics solutions like Mouseflow, UXCam, Datadog, and Chartbeat size...

Adelina Karpenkova
Curated List
Top 19 Mobile App Analytics Tools in 2026
Discover the top mobile analytics tools in 2026. Compare features, pricing, and reviews to choose the right platform for app tracking, behavioral insights, and data-driven...

Jonas Kurzweg
Product Analytics Expert
Curated List
Best 15 Heatmap Analysis Tool for Web and Mobile Apps in 2026
Discover the best heatmap analysis tools and how these platforms help teams visualize user behavior and improve UX across mobile, web, and hybrid...

Begüm Aykut
Growth Marketing Manager

