Back to blog
7 MIN READ
How to Set Up Google Analytics for Mobile Apps
PUBLISHED
31 October, 2024


Tools like Google Analytics help you provide a friction-free user experience to improve your mobile app.
To get Google Analytics for mobile apps, you must install Google's Firebase SDK. However, there are alternatives that might be a better fit for you.
We’ve made it easier for you to make an educated decision about the right analytics platform and present you with a comparison of Google Firebase and UXCam.
Let’s start with what these three have in common. They all:
Work well for iOS and Android users
Segment users based on your priority in-app events
Offer options to personalize reports
Any three options will give you detailed mobile app analytics about user interactions that can help you hit your mobile app KPIs.
More important are the differences between the tools when considering the right mobile app analytics tool. A mobile app analytics dashboard that gives you general trends with quantitative analytics might be enough.
However, for tracking app KPIs, a mobile-first option like UXCam, which combines quantitative analytics and qualitative data like heatmaps and session replay, is more likely to give you the big picture of the user experience.
You can install:
Google Analytics provides statistics and basic analytical tools. A lot of the time it's used for SEO and marketing purposes.
Firebase helps build and ship apps. It's a Google-backed app development software that provides detailed documentation and cross platform SDKs.
UXCam is a mobile app analytics platform that provides a deeper understanding of user behaviour.
Universal Analytics (UA) is the previous version of Google Analytics. This was the default up until October 2020.
Google Analytics 4 (GA4) replaced UA as the default platform for measuring digital analytics. Google has announced that from July 2023, GA4 will be the only option.
There are a few differences between UA and GA4. One of the biggest is the measurement modal they use. UA uses sessions and page views, whereas GA4 measures events and parameters. Now events are split into four categories: auto-captured events, enhanced events, recommended events and custom events.
Google analytics 4 for mobile apps
Google released Google Analytics 4 (GA4) in 2022 to replace its legacy platform Universal Analytics (UA), which was first released in 2005.
Let’s get into the pros and cons of using GA4 as a mobile app analytics tool.
GA4’s core advantage is that it collects website and app data in one dashboard. This can help you understand your cross-platform user journey and track a user’s engagement with your site across multiple devices.
Setting up tracking with GA4
If your user acquisition strategy relies heavily on marketing with Google, it’ll be easy to track how user segments are converting across touchpoints. However, you can also use tags on your ads to integrate this data with other analytics platforms.
GA4 has enhanced data privacy. It automatically anonymises IP addresses to comply with GDPR, and your data in GA4 will automatically expire after 14 months. It’s ‘free to access’ GA4, but if it’s important for you to store data for longer than 14 months you might end up paying for that separately.
Speaking of costs, you might need to pay someone to configure GA4. Where UA captures user interactions as distinct types, such as pageview or transaction, GA4 captures every user interaction as an event. This means you might need to do some manual setup using Google Tag Manager which can be time consuming. In fact, some people have complained that configuring and using GA4 is not user friendly. As one strategy director puts it:
If Universal Analytics was like driving an automatic car, GA4 is like piloting a helicopter in manual mode.
It takes time adjusting to any new tool. Working with engineers, BI teams, and data analysts, will make the implementation and set up easier for the product team. There is also additional support over at the Google Analytics help center for GA4 configuration.
To sum up:
Pros:
GA4 has a strong advantage when it comes to tracking users across touchpoints, making it an effective tool to optimize conversion.
GA4 introduces Explorations, which is a tool for ad-hoc free-flow analysis, which is especially useful for funnel analyses.
Cons:
It’s not a mobile-first analytics platform. GA4 doesn’t cover the granular analytics data that will help you understand and remove in-app user experience friction.
GA4’s collaboration features are limited - Explorations can’t be shared or edited across multiple users for example.
In comparison to the previous Google Analytics version, GA4 does not have custom channel groupings.
GA4 requires a lot of manual event tagging to be useful.
For examples of mobile-first dashboards, see the UXCam mobile app KPI dashboard.
Setting up tracking with UXCam
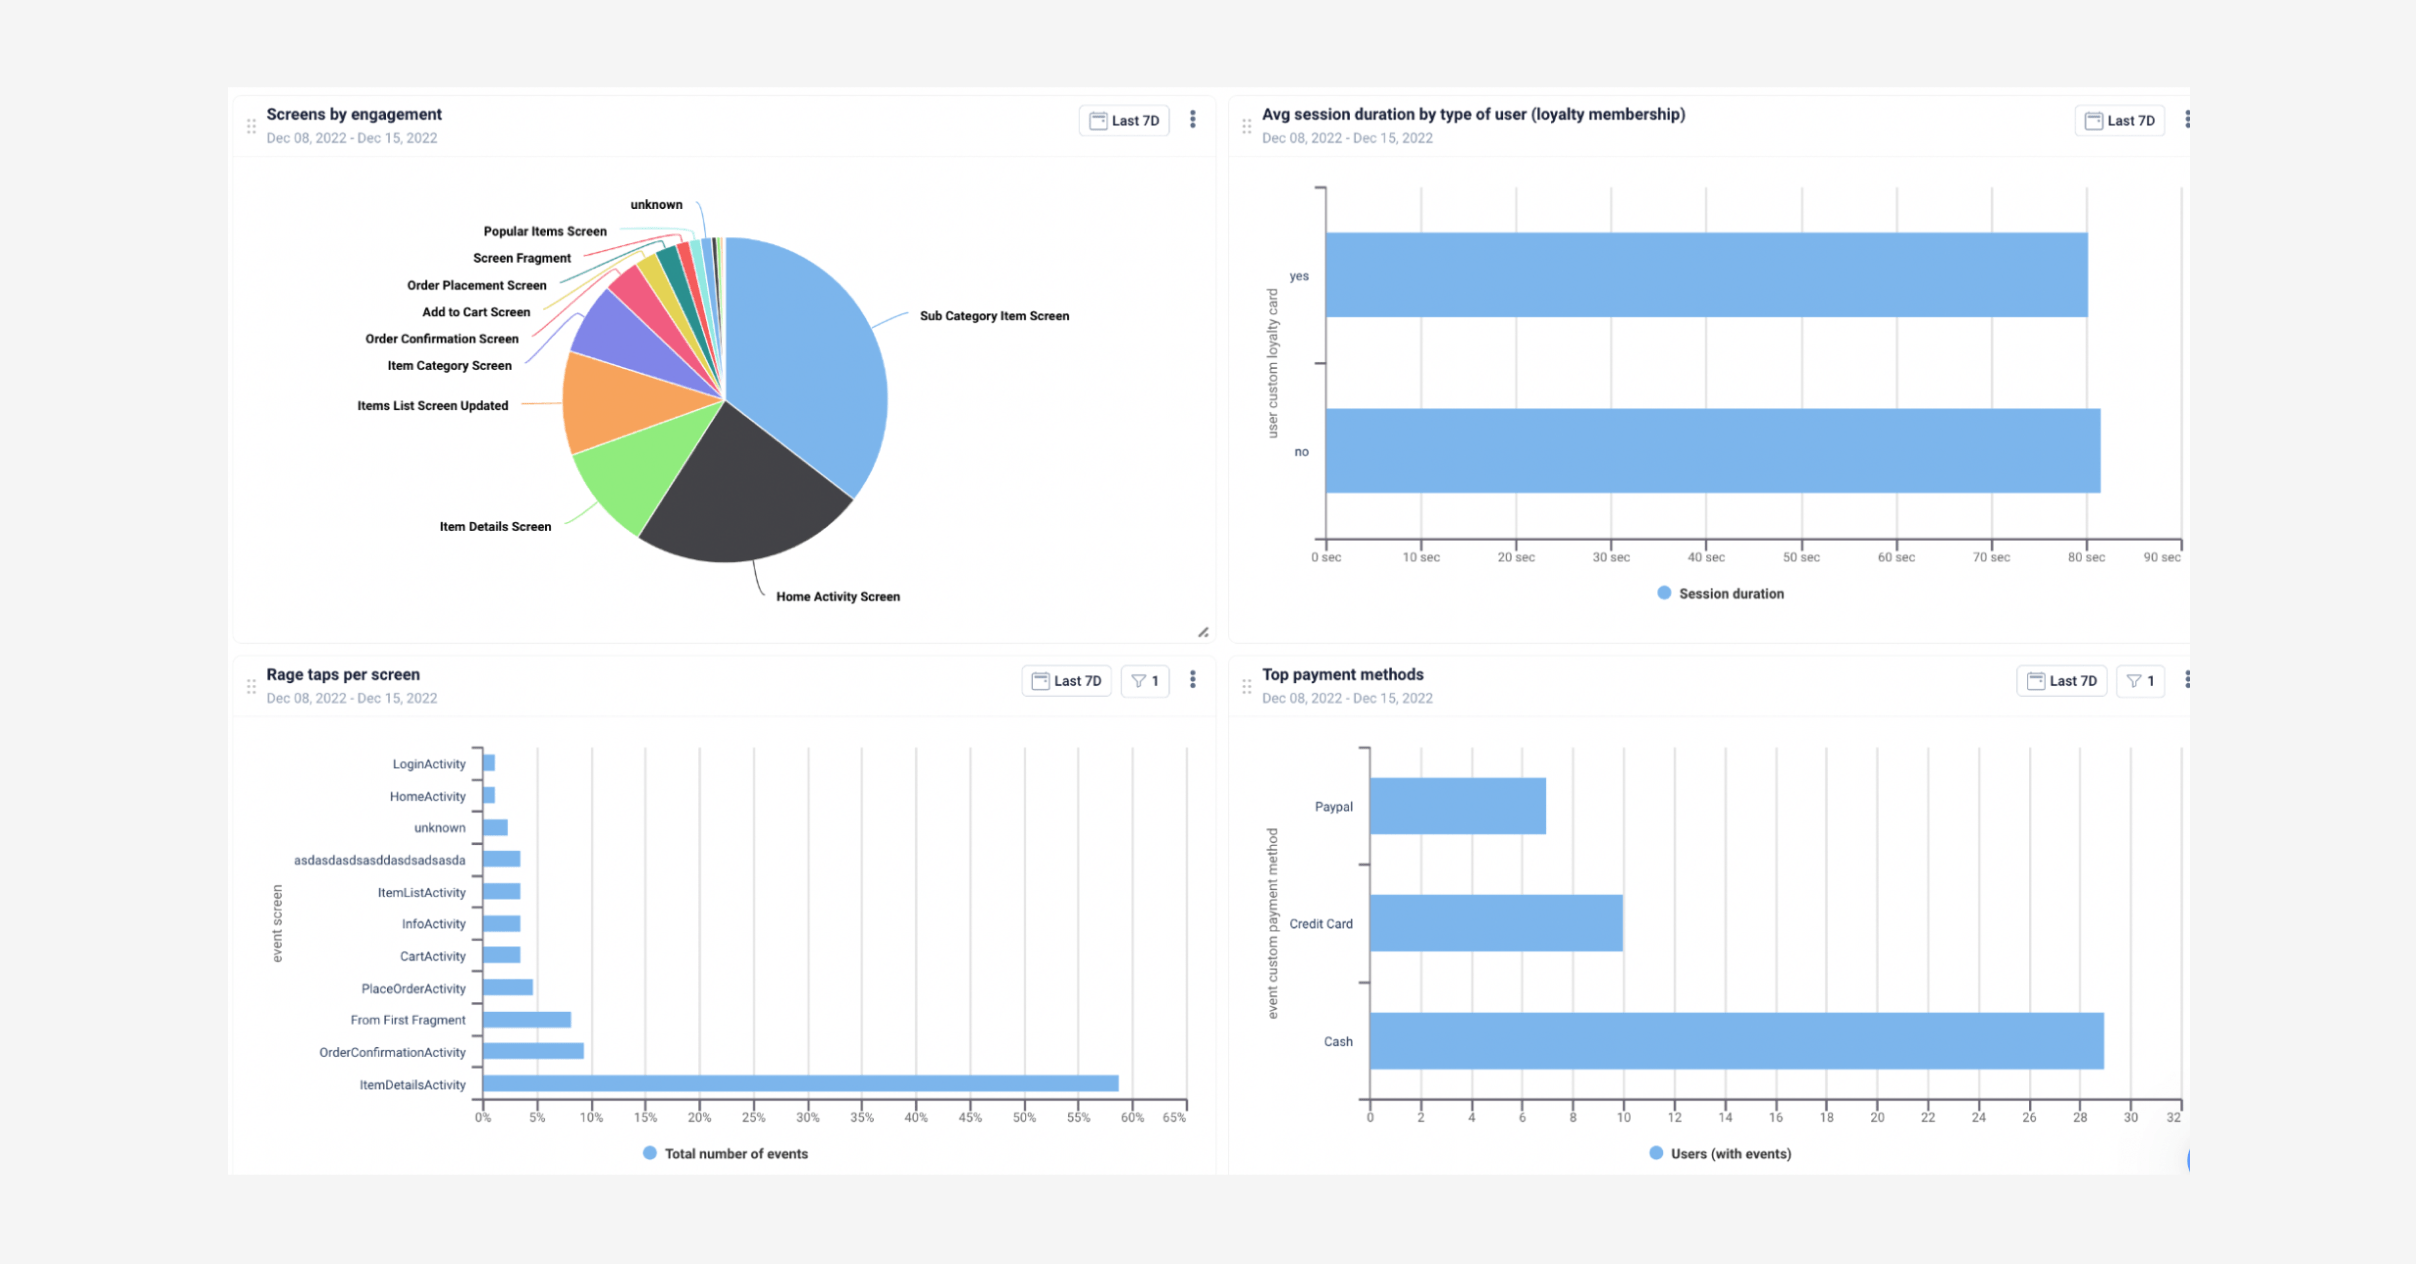
If you’re short of time and resources but want to track analytics, UXCam automatically captures all your user behavior data, technical issues, and screen properties with a single snippet of code. You can set up dashboards out of the box with preconfigured widget templates. Other than the single line of code, no data analysis experience is required to examine heatmaps or build customizable dashboards.
If you’re interested in learning more details about the simple implementation of UXCam’s SDK, read on here.


UXCam’s dashboard with preconfigured widget templates.
Google analytics for Firebase
Firebase is an app development platform that helps ‘build, improve, and grow’ apps. As one developer puts it, the Firebase platform covers:
“a large portion of the services that developers would normally have to build themselves, but don’t really want to build, because they’d rather be focusing on the app experience itself.” Google acquired Firebase in 2014. In 2021, Google replaced Firebase Analytics for mobile data with Google Analytics for Firebase, which looks exactly the same as GA4. That’s because GA4 is deployed using the Firebase SDK for app tracking.
GA4 and Firebase have the same data model. For example, they both capture user interactions as ‘events’. The main difference between Firebase Analytics vs. Google Analytics comes down to where you first set up the iOS and Android data streams. They’re automatically synced with Firebase if you first create them in GA4. If you already have Firebase, there’s one integration step to take before you have the analytics data you need.
Setup: GA4 for mobile apps
If you’re ready to set up GA4 for your mobile app, Google recommends you use the Firebase SDK for the most up to date mobile app reporting. For more help with choosing and implementing the right SDK, read the UXCam guide to all industry-leading SDKs.
You can find the detailed instructions to set up Google Analytics for iOS apps and Android apps at Firebase. Here’s a brief overview of the instructions for iOS so you know what to expect:
Install Xcode 13.3.1. Your project needs to target iOS 11 or later.
Use an Apple device to run your app and sign into Firebase.
Go to the Firebase console then click add project. Clickcontinue, then create project.
Go back to the Firebase console. Click the iOS+ icon on the project overview page.
Click add app, then enter your app’s bundle ID. Click Register app.
Click ‘Download GoogleService-Info.plist’ and add it to the root of your Xcode project.
Keep your project open in Xcode and go to File, then Add packages.
Add the Firebase SDK and choose the SDK you want to use.
Choose FirebaseAnalytics from the library.
Import the FirebaseCore module in your UIApplicationDelegate.
Configure a FirebaseApp shared instance in your app delegate's application (_:didFinishLaunchingWithOptions:).
Run your app to send verification to the Firebase console that your installation was successful.
Let’s compare this to UXCam’s SDK implementation:
Install a couple of lines of code. Then, UXCam is available straight out of the box, with auto capture features that do the time-consuming event tagging for you. This allows users to jump straight in and start looking into qualitative analytics like heatmaps or session replay as well as having critical data like crash reports.
To dig deeper, users can still implement customized events into UXCam to measure certain user properties or features that help them better understand the motives behind user behavior. This is also done with just a simple line of code.
For all the technical details on the implementation of UXCam’s SDK, APIs and 3rd party integrations, follow this guide.
Mobile-first analytics for mobile apps
UXCam is an analytics platform specifically designed for mobile app improvement that can complement your GA4 app tracking.
UXCam easily integrates with Firebase for features like heatmaps and session replays that give you valuable user experience insights you won’t find in GA4 alone.
Mobile heatmaps
Heatmaps offer insight into user behavior that can help you optimize for conversion.
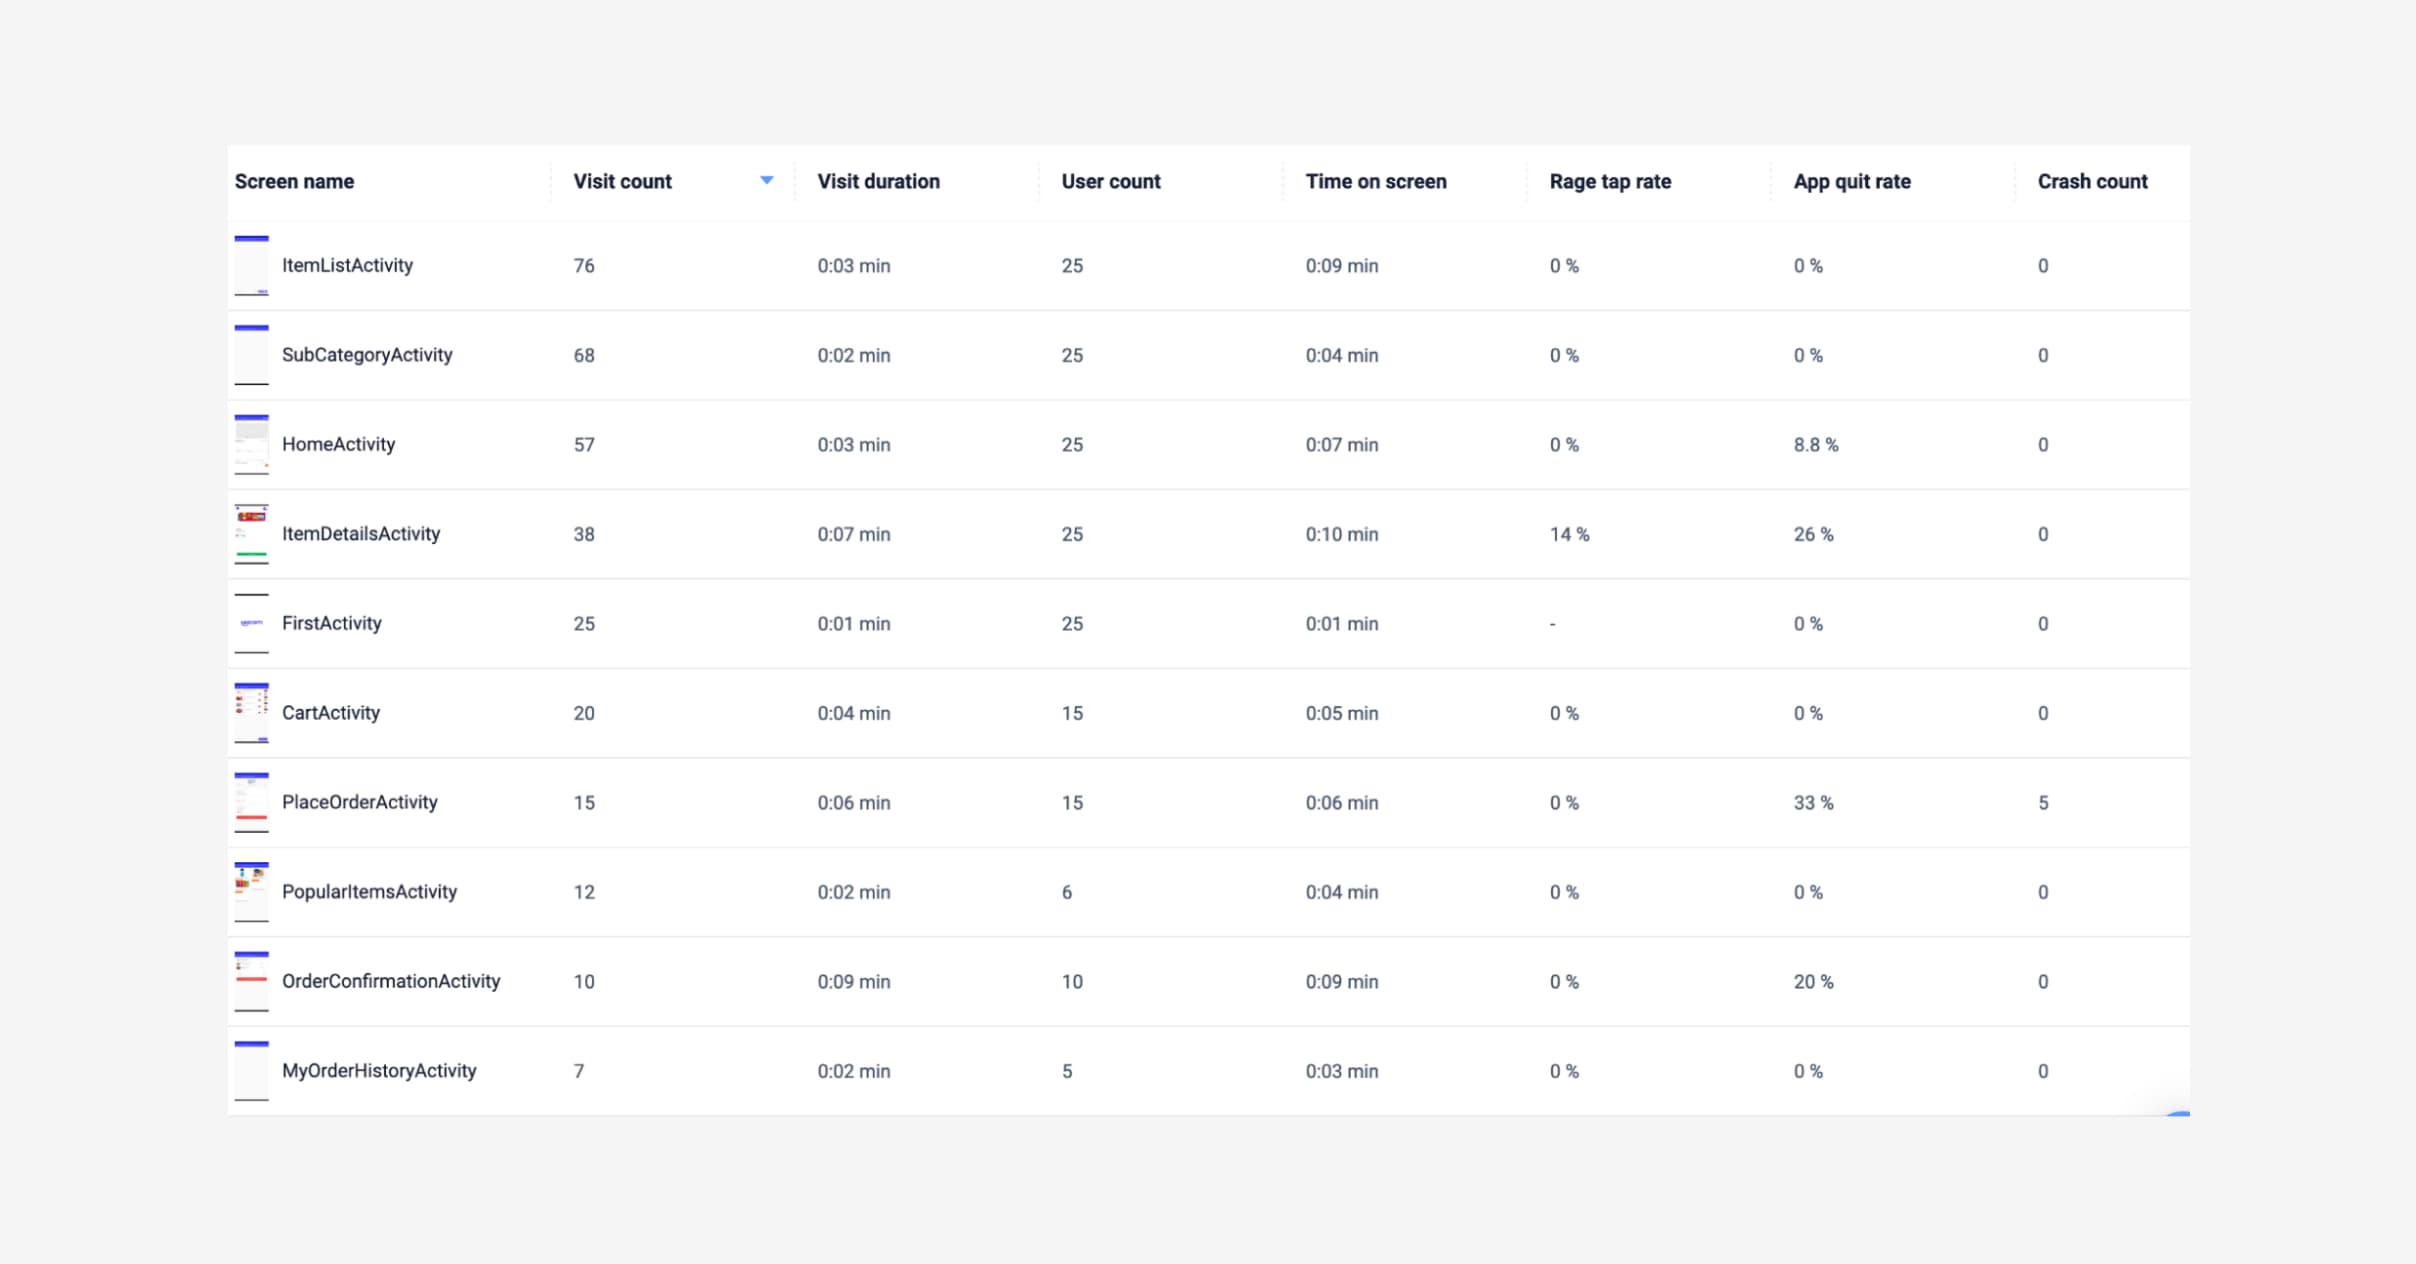
Let’s take an example. Your product team has just launched a redesign of your app. To get an idea of how users are responding to the new UI, you go to screens and filter by rage taps, quit rates, and crash counts. You notice a screen with a particular high rage tap rate.


Example of screens list in UXCam
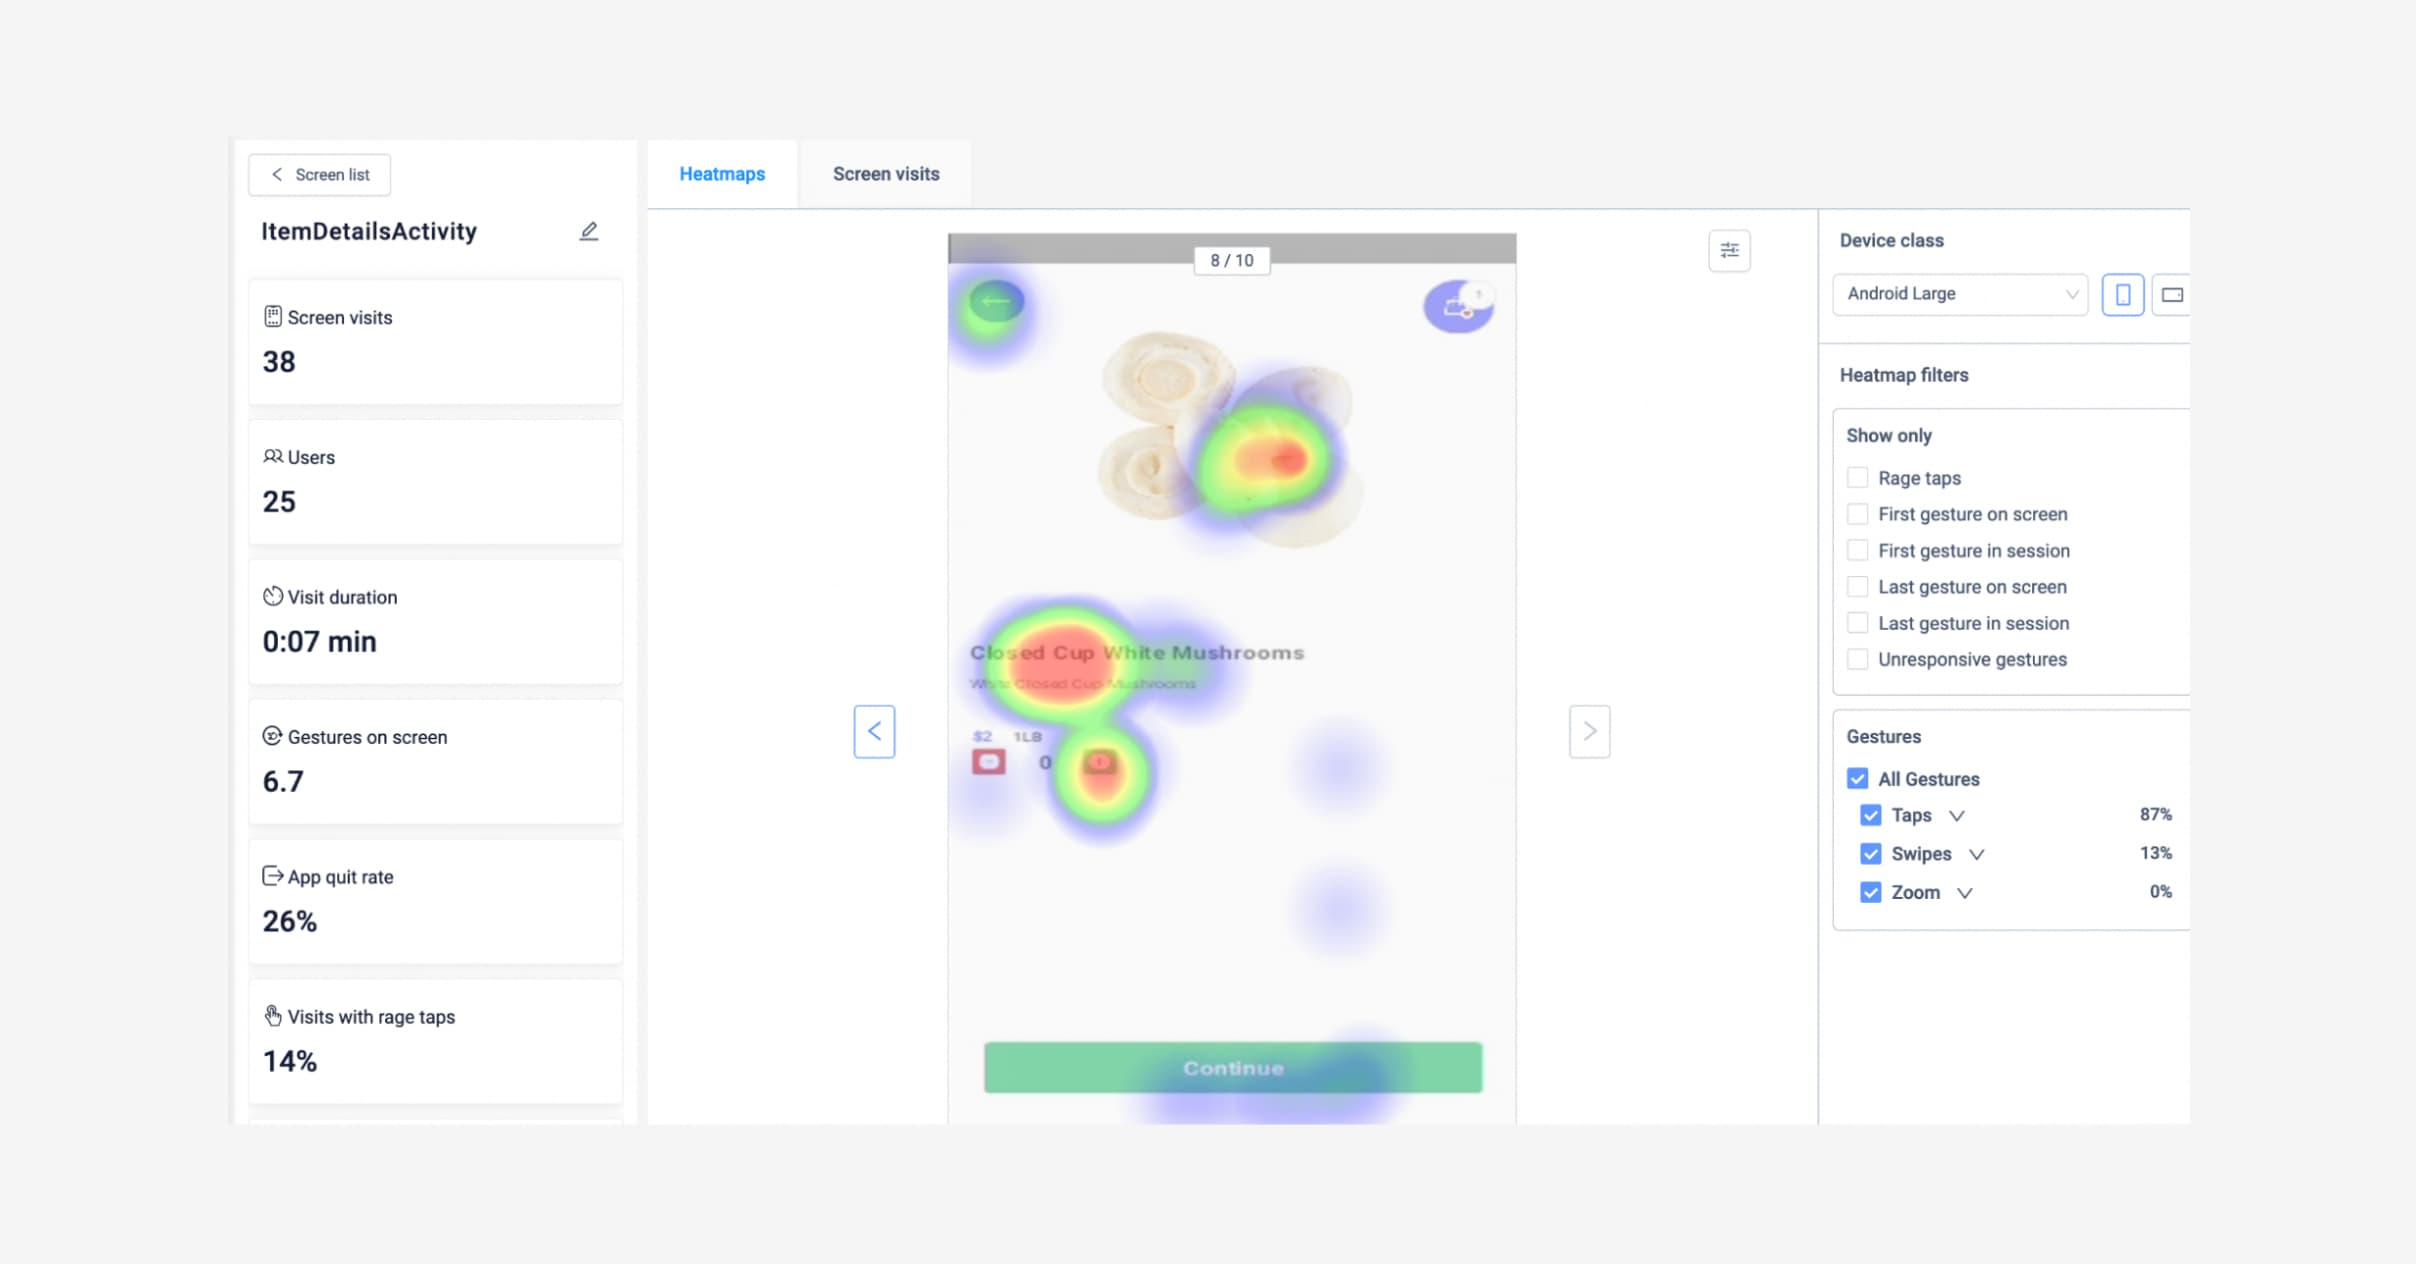
To see what’s going on, we can click on that screen and go straight to the heatmaps for that screen.


UXCam heatmaps displaying rage taps
Now from this image it’s clear where users are rage tapping, making it easier to draw hypotheses to test and find improvements. From this specific example, taps are focused on the product name but nothing is happening, therefore, it could be assumed that users are expecting to be shown more details about a product.
If there are several hypotheses, or the resolution is more complex, product owners can run A/B tests in UXCam, segmenting users into different groups to see how they respond to the changes.
Without the visualization of a heatmap to complement the numerical data or funnels, it’s much more difficult to test and find improvements to optimize design and app performance.
Session recording and replays
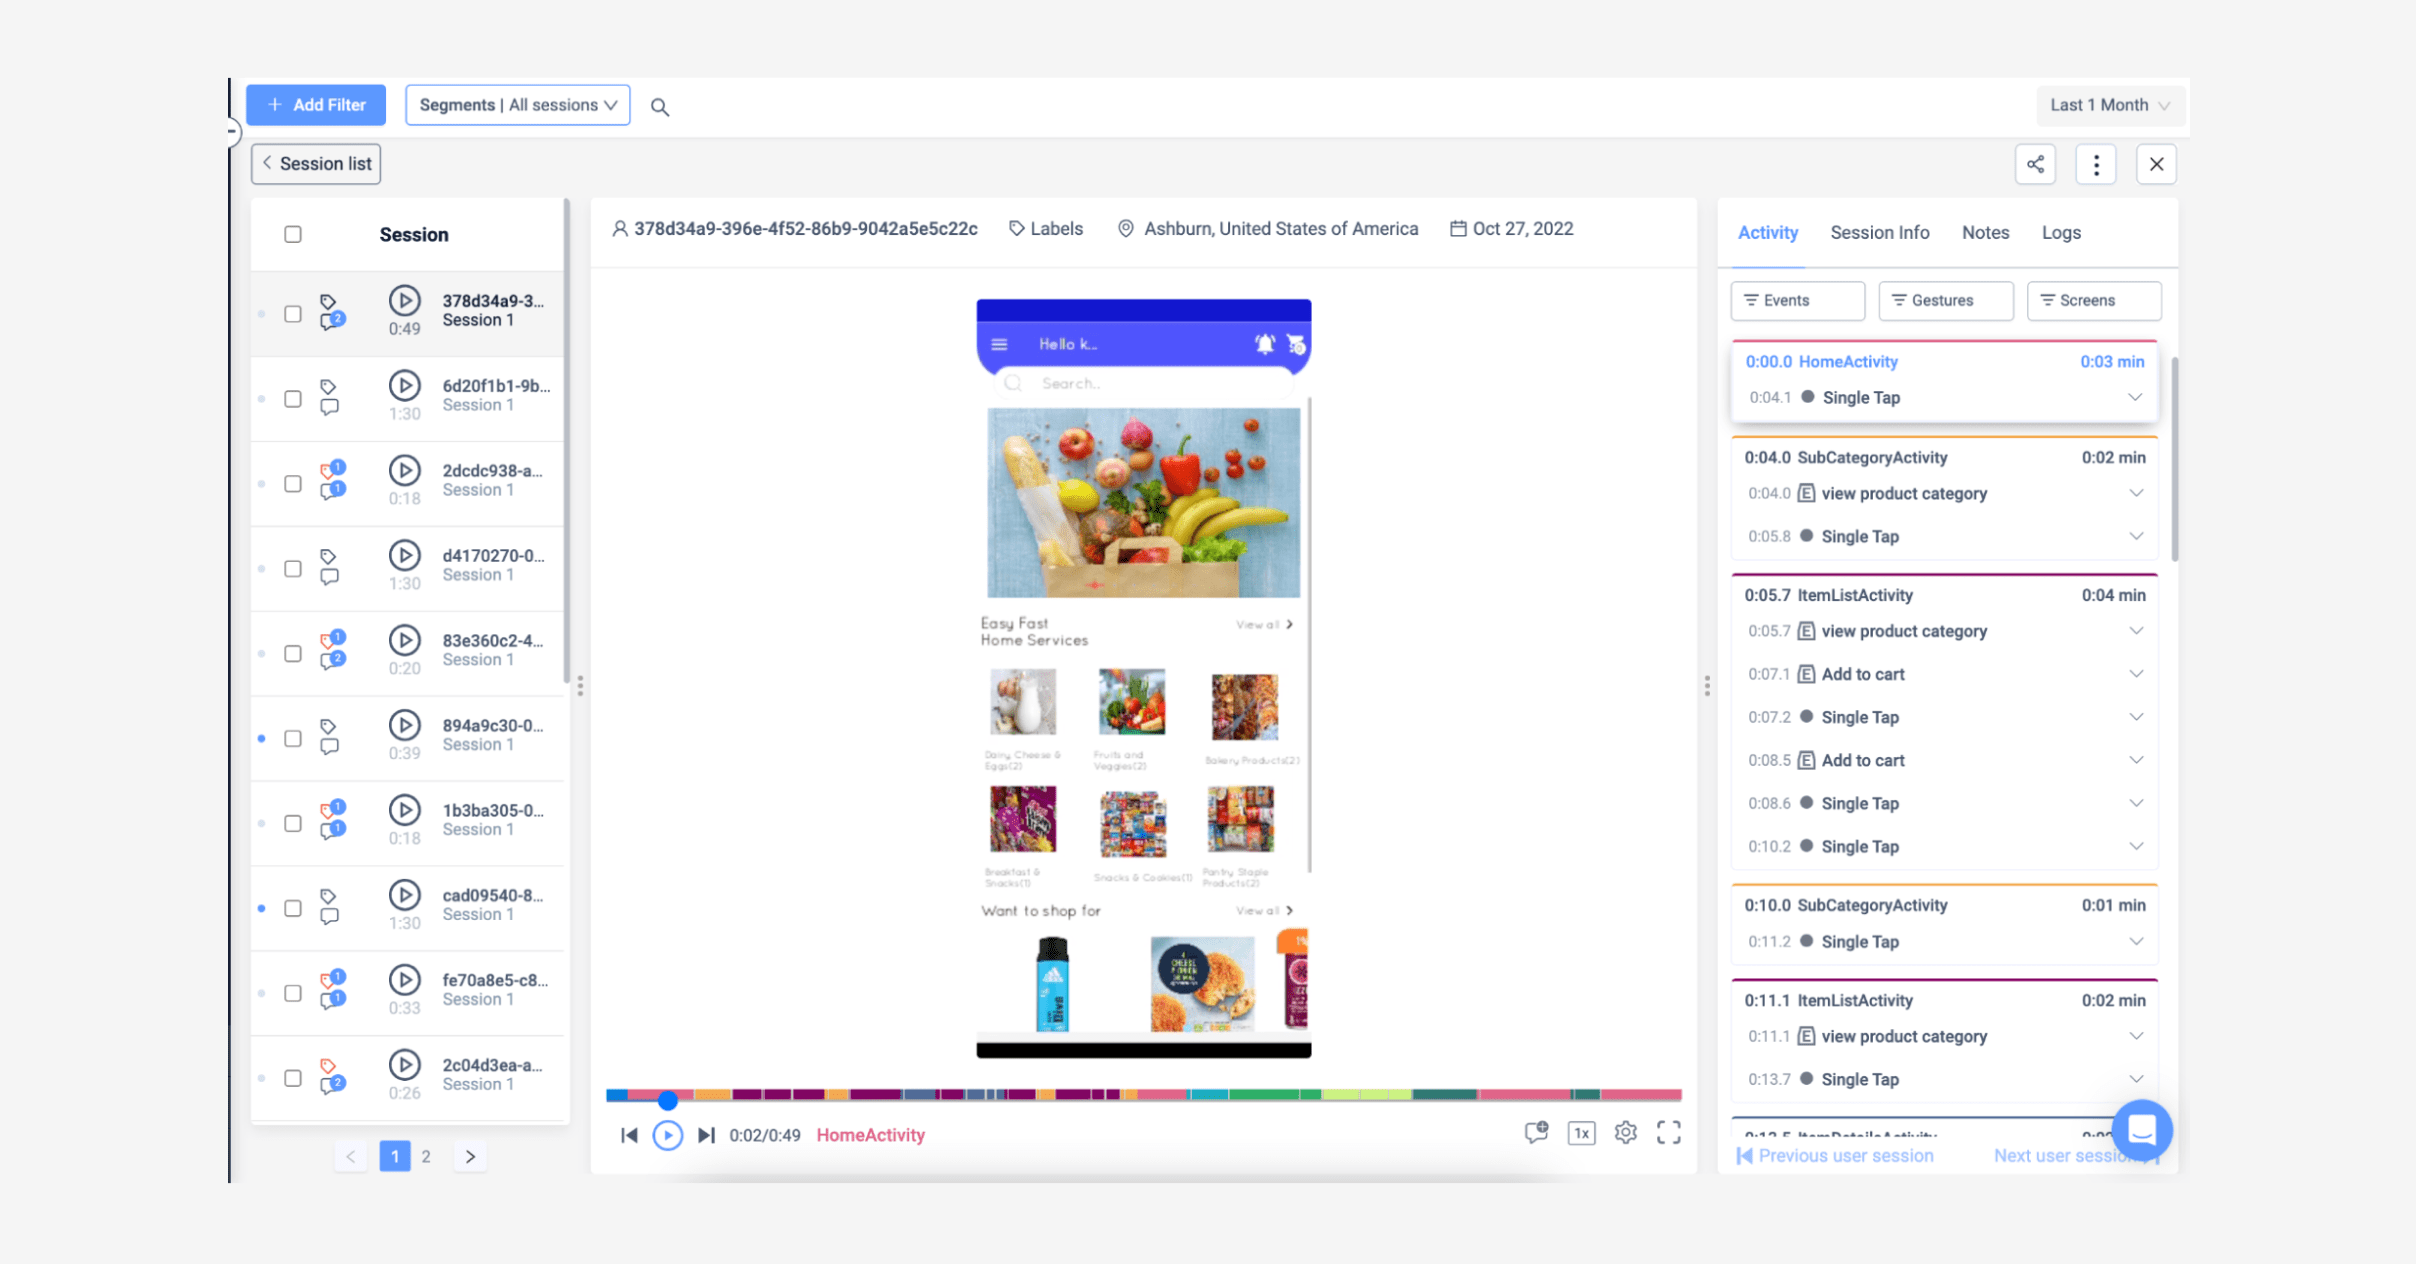
UXCam’s session recording and replay feature shows you exactly what a user did in your app during a session and how they did it. For example, session replay can show:
Events - add to cart, add delivery, purchase complete
Gestures - single tap, swipe up/down, long press
Screens visited - home activity, order confirmation activity


Example of session replay in UXCam
Unlike a typical usability testing setup, such as UserZoom, UXCam’s feature reveals unusual app behavior from users ‘in the wild’. For example, you can select a recording of a session that took much longer than your average session duration and replay it to discover the ‘why’.
You might uncover new super user behavior or a usability issue. Either way, you can share your discoveries with a colleague and leave a tag, comment, and share a session about something that should be investigated further so you can collaborate on the dashboard findings together.
See a preview of UXCam session replay analytics or request a demo of UXCam session recording.
GA4 is particularly impressive when it comes to analyzing user journeys across platforms and touchpoints. For the deep insights into the in-app user experience that improve app performance, a mobile-first platform such as UXCam is a powerful alternative or complement to GA4.
If you’re looking for a broader overview that includes other analytics options, such as Amplitude and Adobe Analytics, read the guide to the top 11 mobile app analytics tools.
Ready to give UXCam a try? Start a free 14-day trial now. No credit card required.
AUTHOR

Celia Murray
Celia is a UX writer based in Europe. For the past 5 years, she has worked for mobile apps focused on health and psychological care.
What’s UXCam?
Related articles
Product best practices
App Onboarding Guide: Top 10 Onboarding Flow Examples 2026
Take a look at 10 examples of apps that get user onboarding flows right. Get inspired by proven app onboarding approaches and improve your...

Jonas Kurzweg
Product Analytics Expert
App Analytics
Mobile App Tracking: Practical Guide & Best Tools [2026]
The best tracking tools for mobile...

Jonas Kurzweg
Product Analytics Expert
Product best practices
Top 11 Remote Usability Testing Tools You Can Use Now
Usability testing tools that will put your mind at...

Jonas Kurzweg
Product Analytics Expert


