Mobile App Tracking: Practical Guide and the 8 Best Tools for 2026
TABLE OF CONTENTS
- Key takeaways
- What is mobile app tracking?
- How mobile app tracking works
- How we evaluated these tools
- The 8 best mobile app tracking tools for 2026
- Tools by category
- 13 patterns, tactics, and pitfalls I see in real tracking setups
- Industry-specific considerations
- Common mistakes I see teams make
- Getting started: a four-stage maturity model
- How to set up mobile app tracking the right way
- Turn mobile app tracking into shipped improvements
Mobile app tracking is the layer of instrumentation that tells you what real users do inside your Android, iOS, or hybrid app, and, more importantly, why they drop off, rage tap, or never come back. I've reviewed hundreds of tracking setups across product teams at fintech, retail, and fitness apps, and the pattern I see most often is the same: teams either track too much and drown in dashboards, or track too little and ship features blind.
This guide is the version I wish every product manager and mobile engineer had before they picked a vendor. It walks through how mobile tracking SDKs actually work, what to measure before you install a single line of code, and the 8 tools I'd put on a shortlist in 2026. UXCam is one of them, I work here, and I'll explain exactly where it fits and where it doesn't.
Key takeaways
Mobile app tracking combines quantitative event data (taps, screens, funnels) with qualitative context (session replay, heatmaps, rage taps) so you can see behavior and explain it.
Your SDK choice directly affects app size, crash rate, battery use, and App Store approval. Pick a lightweight, compliant one.
Define 3-5 goals and the events that map to them before integration. Autocapture tools like UXCam reduce tagging work, but you still need a measurement plan.
No single tool covers attribution, product analytics, and UX research equally well. Most mature teams run two: one for acquisition (AppsFlyer, Firebase) and one for in-app behavior (UXCam, Mixpanel, Amplitude).
UXCam is installed in 37,000+ products and is for mobile apps and the web with full web support, making it the best fit when you need session replay, heatmaps, and funnels in one place.
What is mobile app tracking?
Mobile app tracking is the process of capturing, storing, and analyzing user interactions inside a mobile app, session starts, screen views, gestures, conversions, crashes, and frustration signals, so product, growth, and engineering teams can make evidence-based decisions.
It typically relies on an SDK embedded in the app that streams events to an analytics backend. From there, the data is turned into dashboards, funnels, cohort reports, session replays, and heatmaps.
The categories of data most teams capture:
| Category | Examples |
|---|---|
| Behavioral | Taps, swipes, scrolls, screen views, session length |
| Conversion | Sign-ups, purchases, feature adoption, funnel steps |
| Technical | Crashes, ANRs, UI freezes, API latency, device/OS |
| Attribution | Install source, campaign, cost-per-install, LTV |
| Frustration | Rage taps, dead taps, repeated error screens |
Done well, tracking answers questions like: Why is the cart abandonment rate 63% on Android but 41% on iOS? Which onboarding step burns the most users? Is the new paywall actually lifting conversions, or just hiding them?
How mobile app tracking works


Every mobile analytics stack has the same four pieces:
The SDK. A small library you compile into your iOS, Android, React Native, or Flutter build. It listens for interactions and lifecycle events.
The data pipeline. The SDK batches events and sends them to the vendor's servers, usually over HTTPS with retry logic for offline sessions.
The processing layer. Events are enriched (user ID, device, app version), deduplicated, and stored in a warehouse-like structure.
The presentation layer. Dashboards, funnels, replays, and AI analysis (in UXCam's case, Tara AI surfaces the friction worth looking at without you asking).
Your SDK choice is not a trivial decision. A bloated or badly-written SDK will:
Inflate your binary size and slow cold starts
Drain battery, hammer the network, and tank your Play Store rating
Trigger crashes that affect crash-free session rates
Potentially breach App Store or Play Store policies around data collection
The best SDKs are under a few MB, asynchronous, and follow Apple's App Tracking Transparency and Google Play's data safety guidelines by default.
How we evaluated these tools
I rated every tool below against five criteria, weighted in this order:
Depth of in-app behavioral data (session replay, heatmaps, issue analytics) – 30%
Quantitative analytics (funnels, retention, segmentation, cohorts) – 25%
SDK performance and ease of integration (size, autocapture, framework support) – 15%
Pricing transparency and total cost at mid-market scale – 15%
Customer evidence (G2 reviews, named case studies, documented outcomes) – 15%
I excluded tools that are pure attribution-only (without any in-app analytics) unless they dominate their category, and tools without an active mobile SDK in 2025-2026.
The 8 best mobile app tracking tools for 2026
Quick shortlist:
UXCam – best overall for in-app behavior, session replay + funnels in one
Mixpanel – best for event-based product analytics
Amplitude – best for enterprise behavioral analytics and predictive modeling
Firebase Analytics – best free tool for developer-led teams on Google stack
CleverTap – best for lifecycle messaging tied to behavior
AppsFlyer – best for marketing attribution and MMP
Apple App Analytics – best zero-setup baseline for iOS-only apps
App Radar – best for App Store Optimization and pre-install tracking
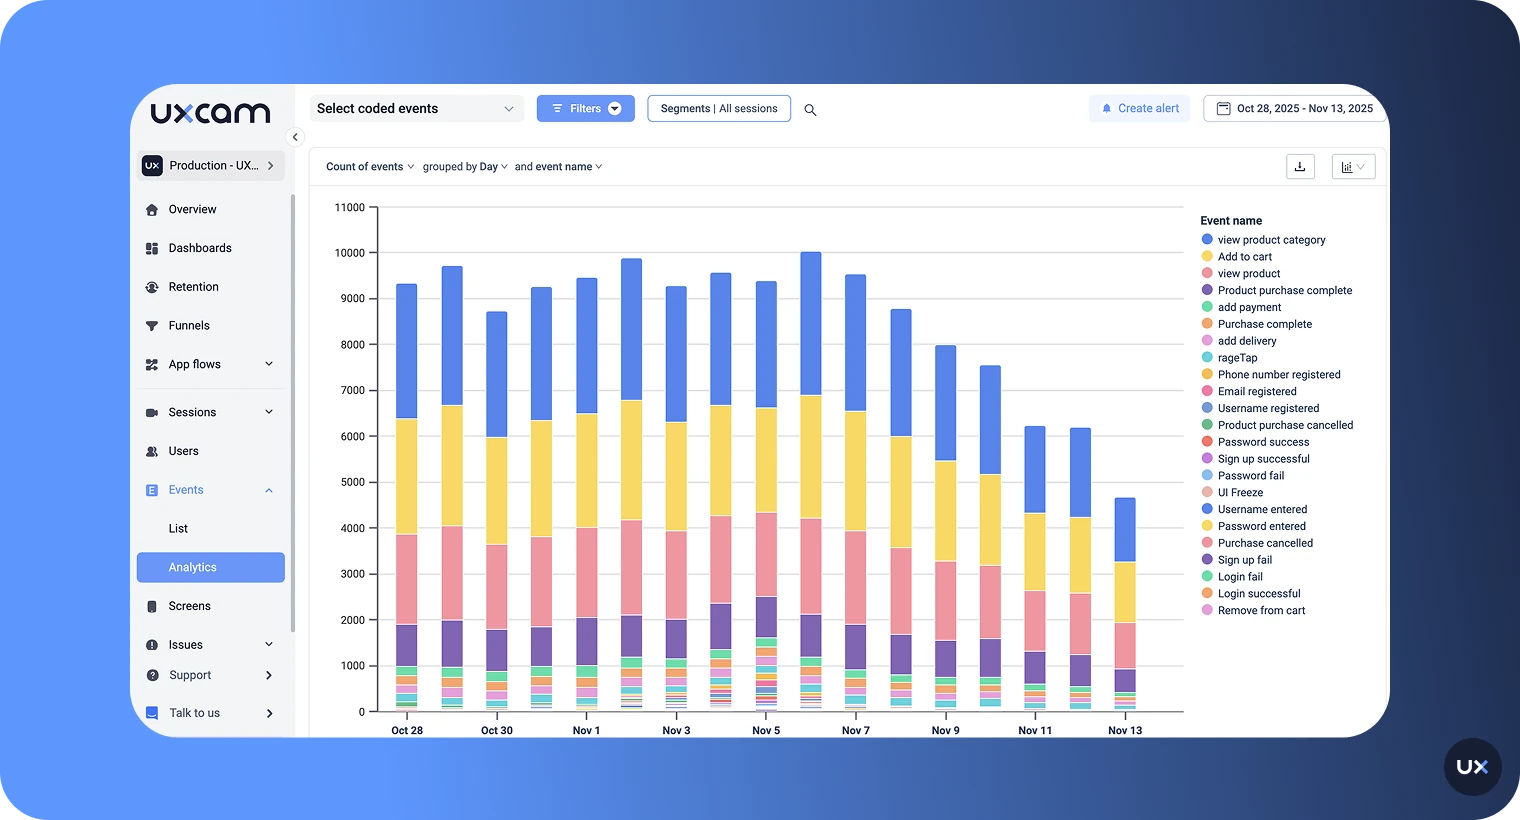
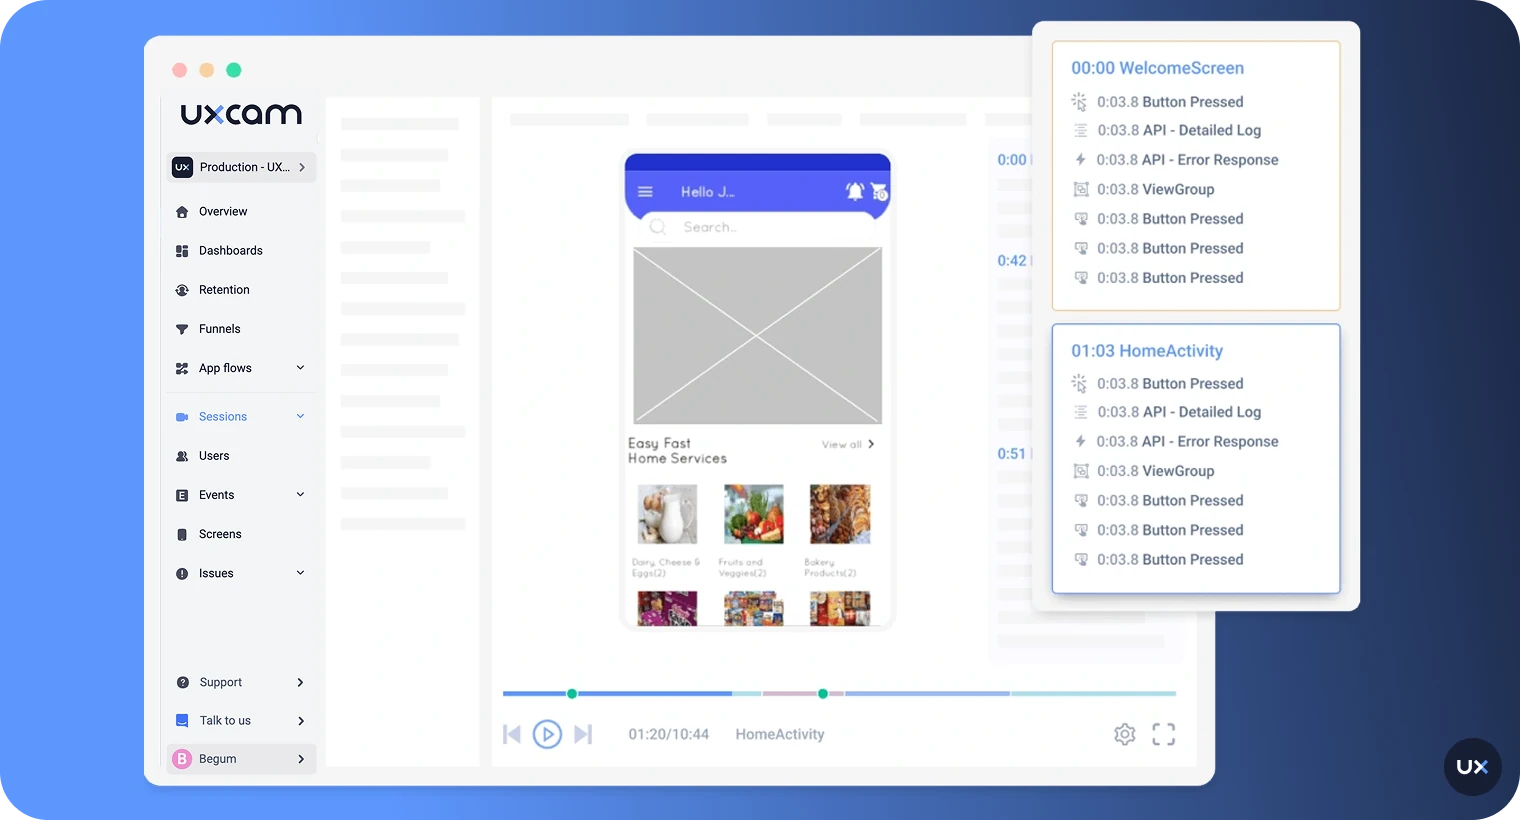
1. UXCam
UXCam is a product intelligence and product analytics platform built for mobile apps and the web and now fully web-ready. It combines qualitative tools (session replay, heatmaps, issue analytics including rage taps and UI freezes) with quantitative analytics (funnels, retention, segmentation). It's installed in 37,000+ products and holds a 4.7 rating on G2.
Best for: product, design, and CX teams who need to see both the numbers and the behavior behind them without running two separate tools.


Key features
Session replay for iOS, Android, React Native, Flutter, Ionic, Xamarin, and web
Heatmaps showing taps, swipes, and scroll depth per screen
Issue analytics that auto-detect rage taps, UI freezes, and crashes
Funnels and retention analytics with replay attached to each drop-off
Tara AI, the AI analyst that processes sessions, surfaces the biggest friction points, and recommends actions
Autocapture of every gesture and screen, no manual tagging to ship
Privacy by design: sensitive views masked automatically, GDPR and CCPA compliant
Pricing: free plan up to 3,000 sessions per month. Paid plans scale with volume. Request a demo or start free.
Pros
Session replay and product analytics in one SDK (most competitors need two)
Autocapture means engineers don't have to instrument every button
Tara AI turns sessions into shipped insights without a dedicated analyst
Strong for mobile apps and the web engineering; lightweight SDK with minimal performance cost
Cons
Free plan session cap is tight for high-volume apps
Attribution is not the product focus; pair with AppsFlyer or Adjust for paid acquisition tracking
Customer outcomes
Recora reduced support tickets by 142% after session replay surfaced a press-and-hold gesture users couldn't discover.
Inspire Fitness boosted time-in-app by 460% and cut rage taps by 56% using heatmaps and issue analytics.
Housing.com grew feature adoption from 20% to 40% by fixing friction identified in funnel drop-offs.
Costa Coffee raised registrations by 15% after redesigning an onboarding screen flagged by UXCam.
2. Mixpanel
Mixpanel is a mature event-based product analytics tool popular with growth and product teams. It's strong on flexible queries, cohort building, and real-time dashboards.
Best for: teams that live inside funnels, flows, and retention curves and want to self-serve SQL-free analysis.


Key features
Event-based tracking with custom properties
Funnels, flows, and retention reports
Cohort builder and behavioral segmentation
Experiment and JQL support for advanced analysts
Pricing: free plan with core analytics, Growth from $0.28 per 1,000 events, Enterprise custom.
Pros
Mature query and dashboard experience
Strong experimentation and cohort tools
Cons
No native session replay for mobile (recently added web replay only)
Requires manual event planning and instrumentation
Costs climb fast as event volume grows
Read our deeper Mixpanel alternatives breakdown.
3. Amplitude
Amplitude is enterprise-grade behavioral analytics with strong predictive and data governance features. It's where large product orgs end up when they outgrow simpler tools.
Best for: mid-market and enterprise teams that need predictive analytics, data governance, and dozens of seats.


Key features
Behavioral cohorts and Pathfinder user journey analysis
Predictive models for churn and LTV
Data governance, taxonomy, and schema enforcement
Warehouse-native deployments and reverse ETL
Pricing: free up to 10M monthly events, paid plans from ~$61/month, enterprise custom.
Pros
Deep quantitative analytics and prediction
Strong data governance for larger teams
Cons
Steep learning curve; often needs an in-house analyst
No session replay for mobile; pair with UXCam or FullStory
Expensive past the free tier
See our Amplitude alternatives guide for side-by-side comparisons.
4. Firebase Analytics
Firebase Analytics (Google Analytics for Firebase) is the default free option for mobile teams already using the Google Cloud ecosystem.
Best for: startups and developer-led teams that need basic event tracking tied to Google Ads and BigQuery.


Key features
Unlimited event tracking (free)
Crashlytics integration for crash reporting
Remote Config and A/B testing
Native BigQuery export
Pricing: free. Related Firebase services (Crashlytics, Remote Config) pay-as-you-go.
Pros
Free and well-integrated with Google Ads and Play Console
Reliable crash reporting via Crashlytics
Cons
No session replay, no heatmaps, no rage tap detection
Data sampling and 14-month default retention can bite analysts
UI is limited; most serious analysis requires BigQuery + SQL
Compare the top Firebase alternatives.
5. CleverTap
CleverTap combines analytics with lifecycle messaging, push, in-app, email, and WhatsApp. It's marketing-led rather than product-led.
Best for: retention and CRM teams who want to act on behavioral segments with multi-channel campaigns.


Key features
Behavioral segmentation (RFM analysis)
Multi-channel campaign automation
Predictive churn scoring
Funnels and cohorts
Pricing: Essentials from $49/month up to 5,000 MAUs; Advanced and Cutting Edge tiers are custom-quoted.
Pros
Strong lifecycle messaging tightly coupled to analytics
Good AI-powered segmentation and prediction
Cons
No session replay or heatmaps
Complex setup for advanced features
Pricing can be opaque at scale
6. AppsFlyer
AppsFlyer is the dominant mobile measurement partner (MMP) for attribution. It answers "where did this install come from?" better than anyone else.
Best for: user acquisition and growth marketing teams managing paid campaigns across multiple networks.


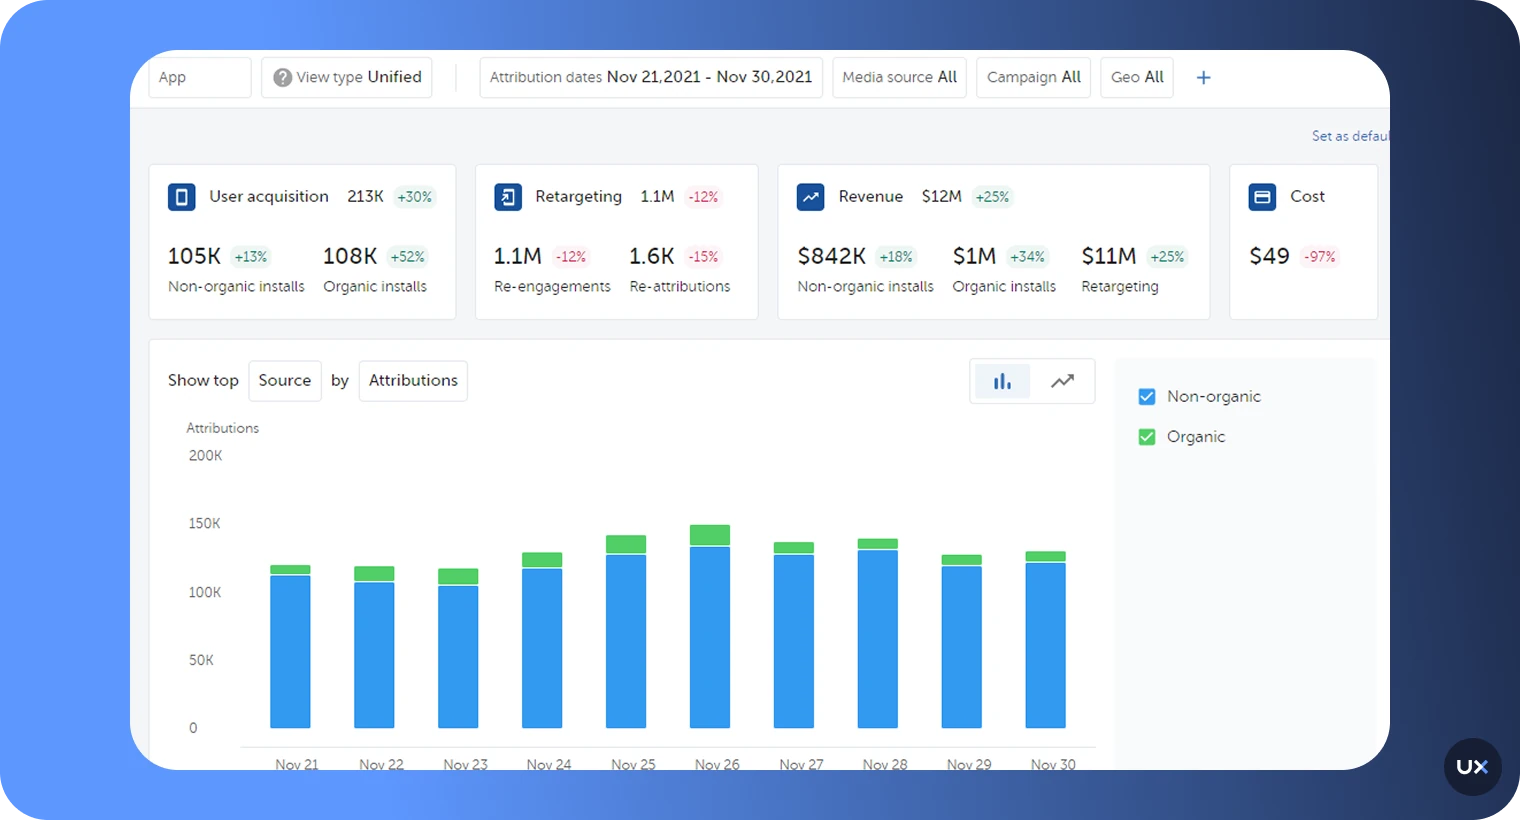
Key features
Multi-touch attribution across 12,000+ integrated partners
SKAdNetwork and Apple ATT support
Protect360 fraud prevention
LTV, ROAS, and cohort reporting
Pricing: free plan available, pay-as-you-go based on conversions, enterprise custom.
Pros
Industry-standard attribution accuracy
Strong fraud detection and SKAN handling
Cons
Focuses on acquisition, not in-app behavior; no replay or heatmaps
Costs scale with conversion volume, not MAUs
Overkill for apps without significant paid spend
7. Apple App Analytics
Apple App Analytics is free inside App Store Connect. No SDK, no setup, just first-party iOS data.
Best for: iOS-only teams who want a privacy-safe baseline for installs, engagement, and App Store performance.


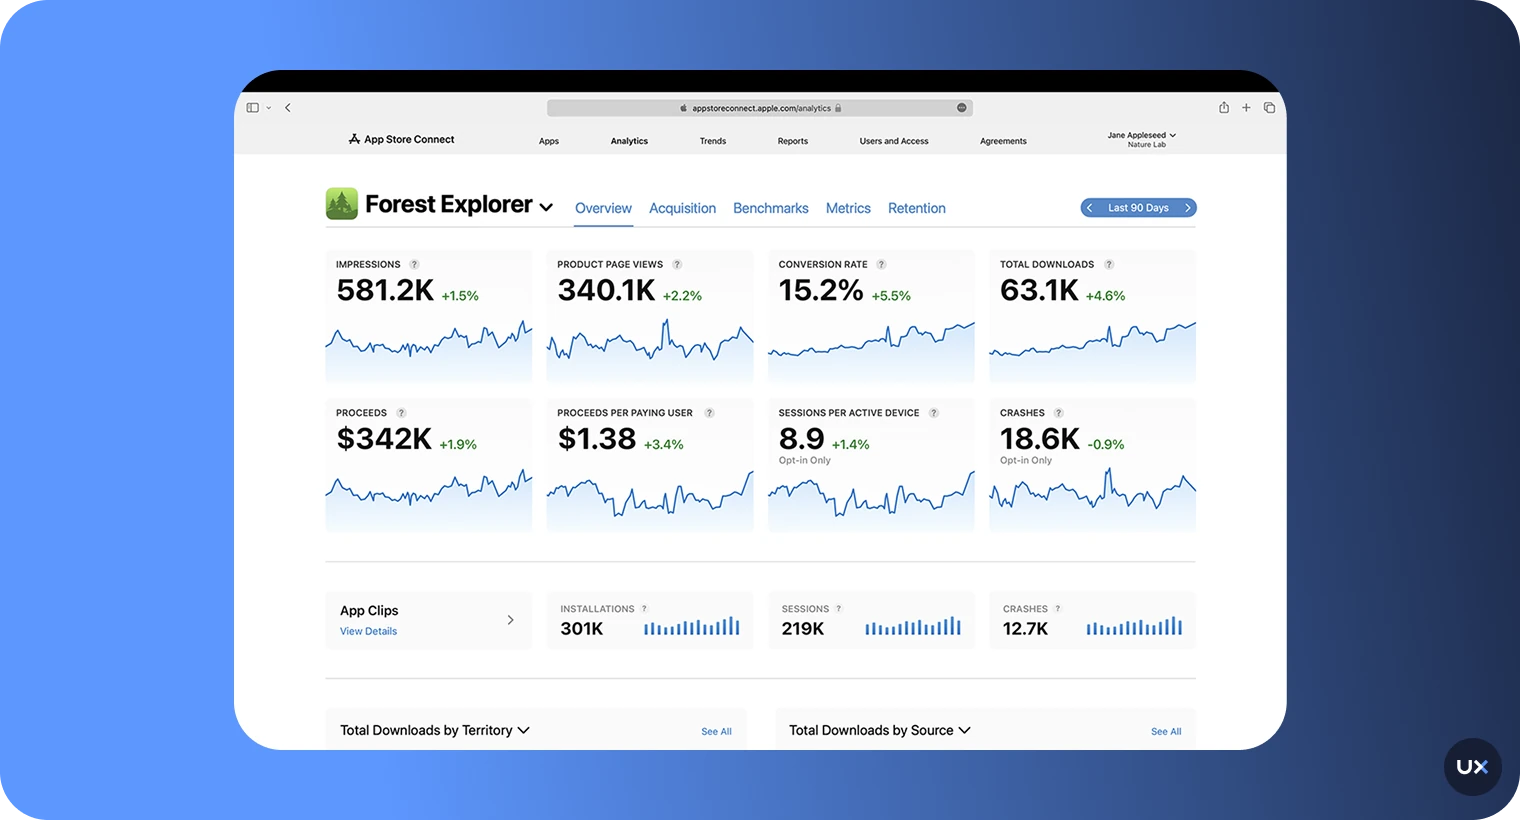
Key features
App Store page impressions, conversion, and source breakdown
Sessions, active devices, retention
Sales, in-app purchases, subscriptions
Crash reports
Pricing: free with Apple Developer Program membership ($99/year).
Pros
Zero setup, first-party and privacy-compliant
Accurate App Store funnel metrics
Cons
iOS and tvOS only
No custom events, no session replay, no cross-platform view
8. App Radar
App Radar is an App Store Optimization (ASO) platform with keyword tracking and store performance analytics.
Best for: ASO and app marketing teams optimizing store listings and organic installs.


Key features
Keyword research, tracking, and AI ASO suggestions
Competitor intelligence
Review management
Store performance analytics
Pricing: free trial, paid plans from €69/month for two apps.
Pros
Purpose-built for keyword and store optimization
Good review management
Cons
No in-app behavior tracking
Focused only on pre-install funnel
Tools by category
Most mature product teams run a two or three tool stack rather than betting on one platform to do everything. Here is how the landscape breaks down when you slot vendors against the job to be done.
In-app behavior and qualitative research. UXCam, FullStory, Hotjar, and LogRocket all sit in this category. UXCam leads on mobile depth (native session replay, heatmaps, rage taps, UI freezes) with full web coverage. FullStory and LogRocket skew web-first with mobile bolted on. Hotjar is web-only.
Event-based product analytics. Mixpanel, Amplitude, Heap, and PostHog own this space. PostHog is worth a look if you want an open-source, self-hostable option with replay built in.
Attribution and MMP. AppsFlyer, Adjust, Branch, Kochava, and Singular dominate paid UA measurement. Most teams pick one and stick with it because the switching cost is painful.
Crash and performance monitoring. Firebase Crashlytics, Sentry, Instabug, Bugsnag, and New Relic Mobile cover crashes, ANRs, and network latency. Pair these with your product analytics tool rather than expecting one vendor to do both well.
Customer messaging and lifecycle. CleverTap, Braze, Iterable, and OneSignal turn behavioral segments into push, email, and in-app campaigns.
App Store Optimization. App Radar, AppTweak, Sensor Tower, and data.ai (formerly App Annie) focus on keywords, competitive intelligence, and store conversion.
Experimentation. Statsig, LaunchDarkly, Optimizely, and Firebase Remote Config handle feature flags and A/B tests. UXCam integrates with most of these so you can watch replays segmented by experiment variant.
13 patterns, tactics, and pitfalls I see in real tracking setups
After sitting through hundreds of implementation reviews, the same patterns keep coming up. Some are worth copying, some are worth avoiding.
Start with the metric, not the event
Teams that write a tracking plan by brainstorming "events we might want" ship hundreds of useless properties. Teams that start with "what metric moves the business?" ship twenty events that actually get used. Jeff Lawson's framing from Ask Your Developer applies here: tie every instrumentation request back to a product decision.
Autocapture first, custom events second
Manual instrumentation is where tracking plans go to die. Engineers deprioritize it, QA misses it, and three sprints later half your events are broken. Autocapture tools like UXCam and Heap record every tap and screen by default, so you can retroactively define events from historical data. Use custom events only for business-critical signals like
or .Version every tracking plan
Your tracking plan is code. Put it in Git, require PR review for changes, and tag each version to the app release where it shipped. This is the single biggest fix for the "our data went weird three weeks ago and nobody knows why" problem.
Instrument the unhappy paths
Most teams track the golden path and ignore errors, retries, and dead ends. The unhappy paths are where retention leaks live. Track
, , , and with as much rigor as your purchase events. Baymard Institute research puts average cart abandonment at 70.19%, and most of that is fixable friction.Never send PII through your analytics SDK
Email addresses, phone numbers, payment details, and even free-text search queries can leak personal data into your analytics vendor. Hash or tokenize identifiers before they hit the SDK and use server-side identity resolution. UXCam masks text input and sensitive views by default; confirm this is on in your config.
Match properties across platforms
If iOS sends
and Android sends , your funnels will silently drop half their users. Agree on a casing convention (snake_case is standard), enforce it in your tracking plan, and validate with Amplitude's schema enforcement or a lightweight linter.Watch ten sessions before touching a dashboard
New PMs who join a product team should spend their first week watching session replays, not building dashboards. You learn more about your users in thirty replays than in thirty funnel reports. This is the single habit I recommend most often.
Attach replay to every funnel drop
A funnel without replay tells you where users leave. A funnel with replay tells you why. UXCam's funnels link every drop-off step to the sessions of users who dropped there. If your current tool can't do that, you're doing twice the work for half the insight.
Budget for data volume, not just seats
Every event-based tool (Mixpanel, Amplitude, Segment) meters on event volume. A careless
event fired every 100ms can 10x your bill overnight. Before enabling any high-frequency event, estimate the annual cost at your projected MAU. Segment's pricing calculator is useful for this.Don't skip the opt-in flow
Apple's App Tracking Transparency prompt opt-in rates hover around 25% globally according to AppsFlyer's State of ATT report. Design the pre-prompt screen carefully. A thoughtful explanation can lift opt-in rates to 50%+, which directly affects your attribution accuracy.
Retention cohorts beat average retention
"Our 30-day retention is 18%" means nothing without cohorts. Slice by install source, country, app version, and onboarding variant. You'll usually find one segment pulling the average down and one holding it up, and your roadmap writes itself.
Validate with QA sessions before launch
Before you trust any new event, run a QA session where you perform each tracked action, then verify the event appeared in the dashboard with correct properties. Mixpanel's Lexicon and UXCam's event inspector make this fast. Skip it and you'll discover the bug the day your VP of Product asks for a report.
Build a weekly review ritual
Tools don't generate insight, rituals do. Pick a 30-minute slot every week where product, design, and engineering watch the top five replays Tara AI surfaced and review funnel movements. Teams that do this ship measurable UX fixes roughly every sprint; teams that don't ship dashboards.
Industry-specific considerations
Tracking priorities shift meaningfully by vertical. The metrics that matter for a fintech app are not the ones that matter for a gaming app, and the compliance surface is completely different.
Fintech and banking
Regulatory exposure is the first constraint. PCI DSS, PSD2, and regional rules like the UK's FCA requirements mean you cannot record card numbers, CVVs, or balances in session replay. Pick a vendor with automatic field masking and documented SOC 2 Type II compliance. Revolut, Monzo, and N26 all publish their stacks; they rely on server-side events for sensitive actions and client-side SDKs for UX telemetry only. Track KYC completion funnels, time-to-first-transaction, and cross-device handoffs carefully, these are the areas where churn hides.
E-commerce and retail
Cart abandonment, checkout funnel drop, search-to-product tap rate, and attach rate dominate the metric set. Baymard's checkout usability research shows the average checkout has 39 design flaws, most of which only surface in replay. Housing.com's jump from 20% to 40% feature adoption happened because funnels plus replay pinpointed which step of their property search flow confused users. Retail teams should also watch for platform skew, iOS users typically convert at higher rates than Android, and investigate when the gap widens.
Gaming and entertainment
Session length, level completion rates, monetization funnel (ad view, IAP purchase), and D1/D7/D30 retention are the core metrics. data.ai's gaming benchmarks are the reference point. Rage taps during tutorials are a leading indicator of D1 churn. Cinema and streaming apps have a different profile: track search abandonment, trailer play-through, and purchase-to-play latency.
Health, fitness, and wellness
Onboarding is everything. Inspire Fitness grew time-in-app by 460% by fixing onboarding friction that heatmaps exposed. HIPAA compliance is non-negotiable for anything touching US health data, so verify BAA availability with your vendor. Track habit-formation signals (streak days, workout completion, logged meals) because they predict long-term retention better than DAU.
Food delivery and on-demand
Latency kills conversion. Track API response times alongside UX events so you can correlate slow restaurant loads with drop-off. DoorDash's engineering blog documents how they built custom latency tracking on top of standard product analytics. Location permission opt-in, delivery address entry, and payment method saving are the three highest-leverage optimization targets.
Media and publishing
Scroll depth, article completion, recirculation, and newsletter signup funnel are the metrics that matter. Heatmaps expose where readers drop off within articles. Cookie consent flows (GDPR, CCPA) heavily affect your available sample size, assume 30-50% of users will reject tracking in EU markets.
Common mistakes I see teams make
Ten patterns that quietly ruin tracking implementations, ranked by how often I see them.
Tracking everything. Four hundred events, none of them reviewed in the last quarter. Audit quarterly and archive anything unused for 60 days.
No owner for the tracking plan. When nobody owns data quality, nobody notices when it breaks. Assign one person, usually a senior PM or analytics engineer.
Shipping events without QA. Events fire, but with wrong properties or on the wrong screen. Always validate in a staging environment before release.
Ignoring SDK version updates. Old SDKs miss bug fixes and new OS compatibility. Schedule quarterly dependency updates the same way you handle security patches.
Mixing test and production data. A single dev device in production dashboards can skew funnels. Use environment properties religiously.
Treating replay as a surveillance tool. Watching individual users to gossip or judge is a privacy and culture failure. Replay exists to find UX patterns, not to monitor people.
Over-indexing on install numbers. Installs are a vanity metric. Activation, retention, and LTV are the ones that predict business outcomes.
Running A/B tests without sufficient power. Most mobile experiments need weeks at realistic traffic levels. Tools like Statsig's sample size calculator keep you honest.
Forgetting to update consent flows. ATT prompts, GDPR banners, and CCPA disclosures change as your stack changes. Review at every major vendor addition.
Not reviewing data weekly. Insights don't surface themselves. The teams that win build a ritual, watch replays, review funnels, discuss findings.
Getting started: a four-stage maturity model
Most product teams I work with sit somewhere on this ladder. Knowing which rung you are on tells you what to invest in next.
Stage 1: Crawl (weeks 1-4)
Install one SDK, turn on autocapture, and ship it. Define three goal metrics: activation, 7-day retention, and one primary conversion event. Watch ten session replays per week. Don't build dashboards yet, you don't have the pattern recognition to know what matters. UXCam's free plan is designed for this stage because it lets you get qualitative and quantitative data flowing in a single afternoon.
Stage 2: Walk (months 2-3)
Write a formal tracking plan covering 20-30 events. Add one funnel per core flow (onboarding, primary conversion, retention loop). Start segmenting by platform, app version, and acquisition source. Introduce a weekly review ritual. Add an attribution tool if you're running paid UA.
Stage 3: Run (months 4-9)
Introduce cohorts, predictive retention modeling, and feature-flag-driven experimentation. Integrate your analytics tool with your CRM and messaging stack. Version-control your tracking plan. Build dashboards tailored to each function: product, growth, CX, engineering.
Stage 4: Fly (month 10+)
Warehouse-native analytics via reverse ETL. Self-serve insights for non-analysts powered by AI (this is where Tara AI earns its keep). Automated anomaly detection on critical funnels. Experimentation culture with 5-10 concurrent tests running. Most teams I meet think they are at Stage 4 and are actually at Stage 2; honest self-assessment is the fastest path forward.
How to set up mobile app tracking the right way
Tools don't fix a bad measurement plan. Before writing any code, run through these four steps.
1. Define goals and the metrics that prove them
Map every tracking event back to a product or business goal. If you can't answer "what decision will this data inform?", don't track it.
For a cinema app, goals might be:
Lift ticket purchase conversion by 20% this quarter
Grow extras attach rate (popcorn, drinks) by 30%
Reduce 7-day churn for first-time buyers
Those goals translate to metrics like purchase funnel conversion, extras attach rate, 7-day retention, rage taps on checkout, and session length by user segment.
2. Plan events and properties
An event is any user action or system signal:
, , . A property adds context: , , , .Write a tracking plan as a simple spreadsheet: event name, trigger, properties, owner, related goal. Keep it to the 20-30 events that matter. UXCam's autocapture handles every gesture, screen, and frustration signal automatically, so your manual tracking plan only needs to cover business events like purchases. See our mobile app event tracking guide for a worked example.
3. Map user journeys with screen flow


Once data is flowing, user journey analysis shows the most common paths through your app. Use it to:
Spot unexpected routes that users take to complete a goal
Compare navigation between paying and non-paying segments
Find screens that act as dead ends
4. Watch real sessions and heatmaps


Quantitative data tells you what happened. Session replay and heatmaps tell you why. Filter sessions by triggered events (crashes, rage taps, funnel drop-offs) so you're watching the 50 most informative replays, not 5,000 random ones.


This is how Recora found the press-and-hold confusion that was silently generating 142% more support tickets than it should have. Pure event data would have shown the support ticket spike, only replay showed the gesture that caused it.
Turn mobile app tracking into shipped improvements
The teams that get value from mobile app tracking aren't the ones with the most dashboards. They're the ones who close the loop: observe behavior, form a hypothesis, ship a fix, measure the change, repeat.
UXCam is built for that loop. Session replay, heatmaps, funnels, retention, and Tara AI all sit inside one SDK that ships in a single afternoon. If you want to see it on your own app data, start a free trial or book a demo.
Frequently asked questions
How do mobile app tracking tools help improve user retention?
Tracking tools expose the moments where users hesitate, get confused, or leave. When you can see funnel drop-off combined with session replay of the users who dropped off, you stop guessing and start fixing. Inspire Fitness used UXCam to identify specific rage tap clusters on their workout flow, redesigned the screen, and grew time-in-app by 460% while cutting rage taps by 56%. Retention follows when friction comes out of the core loops: onboarding, activation, and repeat usage. Without tracking, most teams are shipping retention features based on intuition.
Will a tracking SDK hurt my app's performance?
It depends entirely on the SDK. A well-engineered SDK like UXCam's is a few megabytes, batches events asynchronously, and has negligible impact on cold start, battery, or network. Badly built SDKs can add hundreds of milliseconds to startup, leak memory, and trigger App Store rejections. Before integrating any vendor, ask for their SDK size, CPU profile, battery impact data, and look at their crash-free session rate on public apps. UXCam publishes its performance benchmarks and is used in 37,000+ products, including large-scale consumer apps.
How do I choose between UXCam, Mixpanel, and Amplitude?
Short version: UXCam wins if you need qualitative evidence (session replay, heatmaps, rage taps) alongside quantitative analytics. Mixpanel wins if you're doing heavy event-based analysis and experimentation on web plus mobile. Amplitude wins at enterprise scale where data governance, prediction, and warehouse integration matter most. Many teams run UXCam alongside Mixpanel or Amplitude, numbers in one, the "why" in the other. If you can only afford one tool and you're a product team, UXCam gives you the broadest coverage in a single SDK.
Do I still need an attribution tool like AppsFlyer if I use UXCam?
Yes, if you run paid user acquisition. Attribution tools and product analytics tools solve different problems. AppsFlyer, Adjust, and Branch answer "which campaign, creative, and channel produced this install?" UXCam answers "what happened after the install, and why did they convert or churn?" Growth teams with real paid budgets usually run both: an MMP for the top of the funnel and UXCam for everything that happens inside the app. If you're purely organic, you can start with UXCam plus Apple App Analytics and Google Play Console.
How much data do I need before mobile app tracking becomes useful?
Less than most people think. Session replay and heatmaps surface insights immediately, even at a few hundred sessions you can spot confusion patterns by watching ten replays. Funnel and retention analysis need more volume to trust, typically a few thousand sessions per week per flow, before conclusions are statistically meaningful. Rage tap and UI freeze detection works from day one because they're deterministic signals, not averages. Start capturing data as early in your product's life as possible; analyzing the first thousand real sessions is almost always more useful than the next ten thousand.
Is mobile app tracking GDPR and App Store compliant?
It can be, if you pick the right vendor and configure it correctly. UXCam masks sensitive fields automatically, supports user consent flows, honors Apple's App Tracking Transparency framework, and provides EU data residency. You still need to disclose tracking in your privacy policy, get consent where required, and complete the App Store Connect and Google Play data safety forms accurately. Avoid SDKs that fingerprint devices, transmit personal data without consent, or lack documented data processing agreements, those are the ones that trigger App Store rejections and regulator fines.
How long does it take to implement mobile app tracking?
A basic UXCam integration takes under an hour: add the SDK, initialize with your app key, ship the build. Meaningful instrumentation (custom events, user identification, consent flows) usually takes one to two sprints if you already have a tracking plan. If you're building the tracking plan from scratch, budget another week for stakeholder interviews and documentation. Most teams overestimate the engineering time and underestimate the planning time.
Should I use server-side or client-side tracking?
Both, for different events. Client-side tracking (via SDK) captures UX telemetry like taps, screens, and session behavior. Server-side tracking captures business-critical events like purchases, subscription renewals, and backend state changes. Server-side is more reliable (no ad blockers, no SDK failures) but blind to UX. Most mature stacks use a tool like Segment or RudderStack to route events from both sources to downstream destinations.
What's the difference between DAU, MAU, and active users?
DAU (daily active users) counts unique users per day, MAU counts unique users per month, and "active" is whatever you define it as, usually a session start or a meaningful action like opening a core feature. The key nuance: DAU/MAU ratios are a decent engagement proxy (Facebook popularized the "above 50% is excellent" benchmark), but they hide whether users are returning because they love the product or because of push notifications. Pair with Amplitude's L7 metric or weekly active retention cohorts for a truer picture.
How do I track users across devices and platforms?
Implement identity resolution: assign a persistent user ID at signup and pass it to your analytics SDK on every device the user authenticates on. UXCam, Mixpanel, and Amplitude all support identity merging, so a session on iOS and a session on web attributed to the same user ID roll up into one profile. Without this, your retention numbers understate reality and your cross-platform funnels break.
Can I export my tracking data to a data warehouse?
Yes, with most tools. Amplitude, Mixpanel, and Firebase offer native warehouse exports (BigQuery, Snowflake, Redshift). UXCam offers event exports and webhooks for integrating with downstream systems. If warehouse-native analytics is a priority, look at Heap's Connect or PostHog's warehouse integration. The decision often comes down to whether you want a BI team querying SQL or a product team self-serving in a dashboard.
What metrics matter most for a new mobile app?
For the first 90 days: install-to-activation conversion (did users complete the first meaningful action?), D1 retention (did they come back the next day?), and rage tap rate (how frustrated are they?). These three tell you whether your core loop works. Everything else, LTV, ARPU, K-factor, matters later. Too many early-stage teams build dashboards for Series B metrics while ignoring whether their onboarding even works.
How do I get internal buy-in for investing in tracking?
Run a two-week pilot. Pick one flow (onboarding is usually the best candidate), install a tool with autocapture, watch fifty session replays, and present the top three UX findings to leadership along with projected revenue impact if fixed. Every UXCam customer story I cited, Recora, Inspire Fitness, Housing.com, Costa Coffee, started as a pilot. Evidence of a specific fix with a specific number moves budgets faster than generic arguments about "data-driven culture."
Is it worth building in-house mobile analytics?
Almost never. The engineering cost of building, maintaining, and scaling an analytics pipeline dwarfs the license cost of a vendor. The only teams I've seen succeed with in-house are those with specific privacy requirements (certain fintech, defense, healthcare) that prevent SaaS adoption. For everyone else, the question is which vendor, not whether to buy.
AUTHOR
Silvanus Alt, PhD
Founder & CEO | UXCam
Silvanus Alt, PhD, is the Co-Founder & CEO of UXCam and a expert in AI-powered product intelligence. Trained at the Max Planck Institute for the Physics of Complex Systems, he built Tara, the AI Product Analyst that not only analyzes user behavior but recommends clear next steps for better products.


TABLE OF CONTENTS
- Key takeaways
- What is mobile app tracking?
- How mobile app tracking works
- How we evaluated these tools
- The 8 best mobile app tracking tools for 2026
- Tools by category
- 13 patterns, tactics, and pitfalls I see in real tracking setups
- Industry-specific considerations
- Common mistakes I see teams make
- Getting started: a four-stage maturity model
- How to set up mobile app tracking the right way
- Turn mobile app tracking into shipped improvements


Related articles


App Analytics
Why Do My Apps Keep Crashing? A Complete Guide
Why do your apps keep crashing? A product analyst's guide to diagnosing crash causes, fixing memory leaks, and using session replay to find root...
Silvanus Alt, PhD
Founder & CEO | UXCam

App Analytics
Mobile App Tracking: Guia Prático e as 8 Melhores Ferramentas para 2026
Um guia prático de tracking de app mobile em 2026, cobrindo como os SDKs funcionam, o que medir e as 8 ferramentas que as equipes de produto realmente...
Silvanus Alt, PhD
Founder & CEO | UXCam
App Analytics
Mobile App Tracking: Practical Guide and the 8 Best Tools for 2026
A practitioner's guide to mobile app tracking in 2026, covering how SDKs work, what to measure, and the 8 tools product teams actually...
Silvanus Alt, PhD
Founder & CEO | UXCam