What Is UX Analytics? A Practitioner's Guide (+ 10 Best UX Analytics Tools in 2026)


TABLE OF CONTENTS
- Key takeaways
- What is UX analytics?
- Why UX analytics matters more than it used to
- Quantitative vs qualitative UX data
- Qualitative UX analytics methods
- Quantitative UX analytics methods
- 13 UX analytics patterns, tactics, and pitfalls worth knowing
- Industry-specific UX analytics considerations
- UX analytics tools by category
- How to build a UX analytics strategy that actually works
- A UX analytics maturity model
- The best UX analytics tools in 2026
- 10 common UX analytics mistakes to avoid
- What's next for UX analytics
- Improve your UX analytics with UXCam
UX analytics is the practice of collecting, connecting, and interpreting behavioral and experiential data, like clicks, session replays, heatmaps, funnels, and frustration signals, to understand how real people actually use a digital product and where they get stuck.
I've reviewed hundreds of product teams' analytics stacks over the past few years, and the pattern I see most often is this: teams have plenty of data but very little understanding. Dashboards full of event counts, bounce rates, and DAU charts, yet no one can answer the basic question "why did conversion drop last Tuesday?" in under an hour.
That gap is what UX analytics closes. This guide walks through what UX analytics actually is, the qualitative and quantitative methods worth using, how to build a strategy that sticks, and the 10 UX analytics tools I'd shortlist in 2026, including where each one genuinely earns its spot.
Key takeaways
UX analytics blends quantitative data (events, funnels, retention) with qualitative data (session replays, heatmaps, feedback) so you understand both what users do and why.
The fastest route to usable insight is autocapture plus session replay. Manual event tagging will slow you down and leave gaps.
Frustration signals, rage taps, UI freezes, repeat errors, are the highest-leverage UX metric most teams ignore.
A UX analytics tool is only useful if it connects behavior to specific sessions you can actually watch. Otherwise you're looking at charts with no explanation.
In 2026, AI analysts (like Tara AI inside UXCam) are replacing the manual grind of watching sessions one by one.
The tool you pick should match your platform. Hotjar and Mouseflow are web-only. UXCam, Glassbox, and Contentsquare handle mobile and web.
What is UX analytics?
UX analytics is the discipline of measuring user experience through a combination of behavioral data, experiential data, and feedback, and then turning those signals into product decisions. It sits at the intersection of product analytics and user research.
Two data types make it work:
Quantitative UX data tells you what happened at scale: screen views, tap events, conversion rates, retention curves, session length, funnel drop-offs.
Qualitative UX data tells you why: session replays, heatmaps, survey responses, rage tap and UI freeze events, usability tests.
Traditional web analytics like Google Analytics 4 stops at the aggregate view. UX analytics goes one layer deeper: for any chart you see, you can pull up the specific user sessions behind it and watch what happened.
Why UX analytics matters more than it used to
When I started in this space, teams shipped on a quarterly cycle and A/B tested once per release. Now product velocity has compressed to weekly or daily releases, and the cost of shipping a confusing flow is immediate: users churn, support tickets pile up, and app store ratings slip. Forrester's research on customer experience ROI shows that every 1-point improvement in CX Index scores can translate into hundreds of millions in revenue for large brands, and the same compounding dynamic plays out in smaller products, just at a smaller scale.
A few concrete outcomes teams achieve when they operationalize UX analytics properly:
Find friction before it spreads. Recora cut support tickets by 142% after UXCam replays showed users press-and-holding a button that only needed a single tap. No amount of session count or bounce rate would have surfaced that.
Boost conversion. Costa Coffee raised registrations by 15% after finding and fixing the friction points in their sign-up flow.
Drive retention and engagement. Inspire Fitness boosted time-in-app by 460% and cut rage taps by 56% by systematically watching where users got stuck.
Grow feature adoption. Housing.com moved feature adoption from 20% to 40% by combining funnels with replays to iterate on onboarding.
Prioritize with evidence. Stop debating HiPPOs (highest-paid person's opinions) and point at actual user sessions.
Quantitative vs qualitative UX data


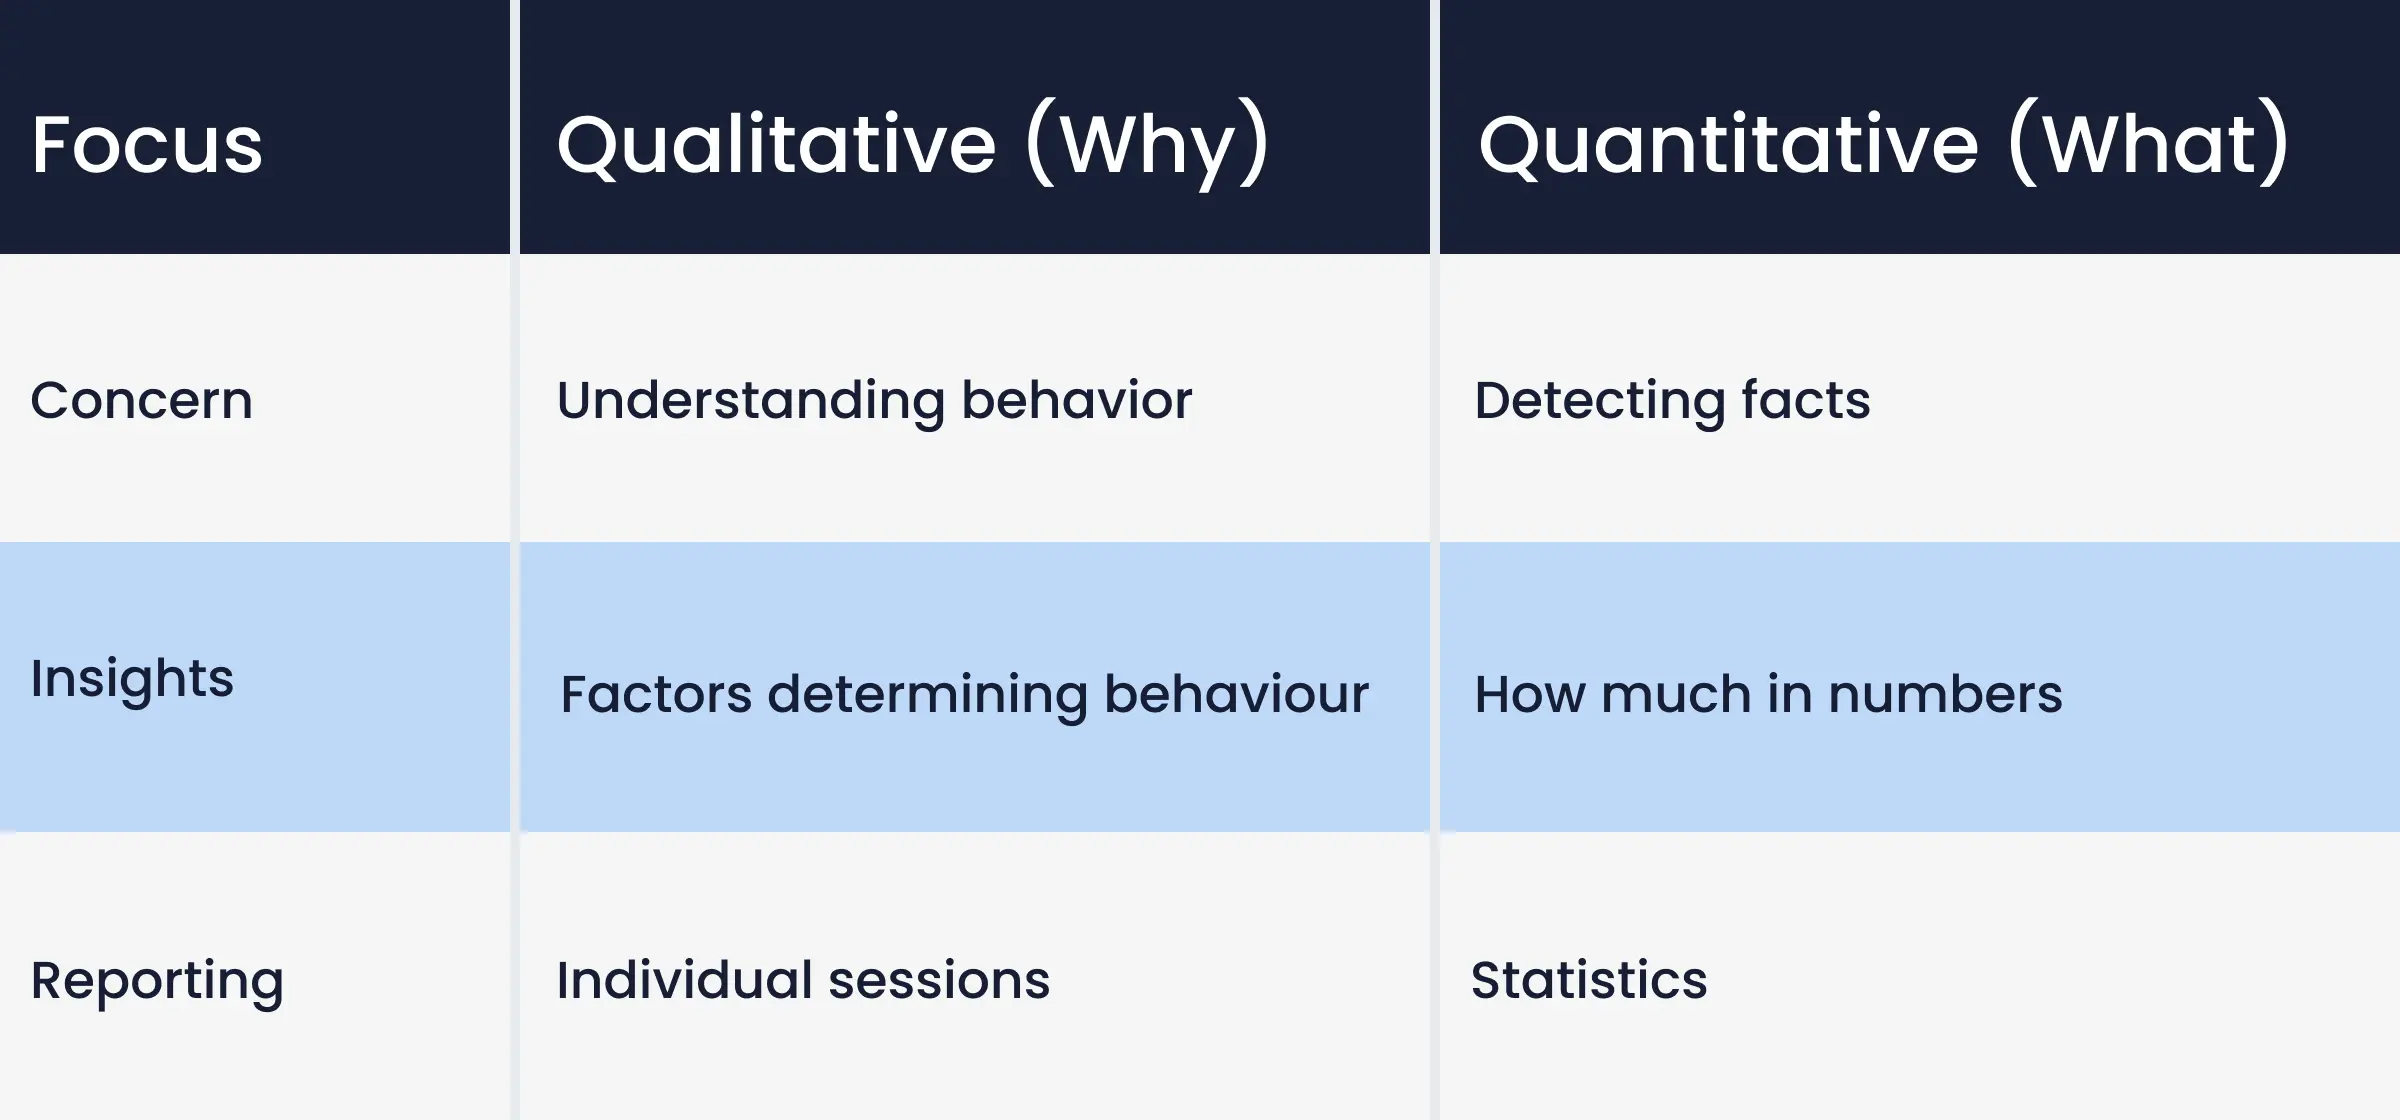
You need both data types. Quantitative shows scale, qualitative shows cause. Running one without the other is the most common mistake I see:
Teams with only quantitative data can tell you the checkout funnel drops 30% at step 3, but not why.
Teams with only qualitative data can describe five specific users who rage-tapped on a pricing toggle, but not whether that represents 0.1% or 20% of sessions.
Modern platforms combine both views in one place. Inside UXCam, any funnel step or retention cohort is one click away from the underlying session replays.
Qualitative UX analytics methods
Session replay
Session replay records real user interactions, taps, scrolls, navigation, hesitation, and plays them back as video. It's the single highest-leverage qualitative method for most product teams because it requires no participant recruiting, no scheduling, no lab, and no moderator.


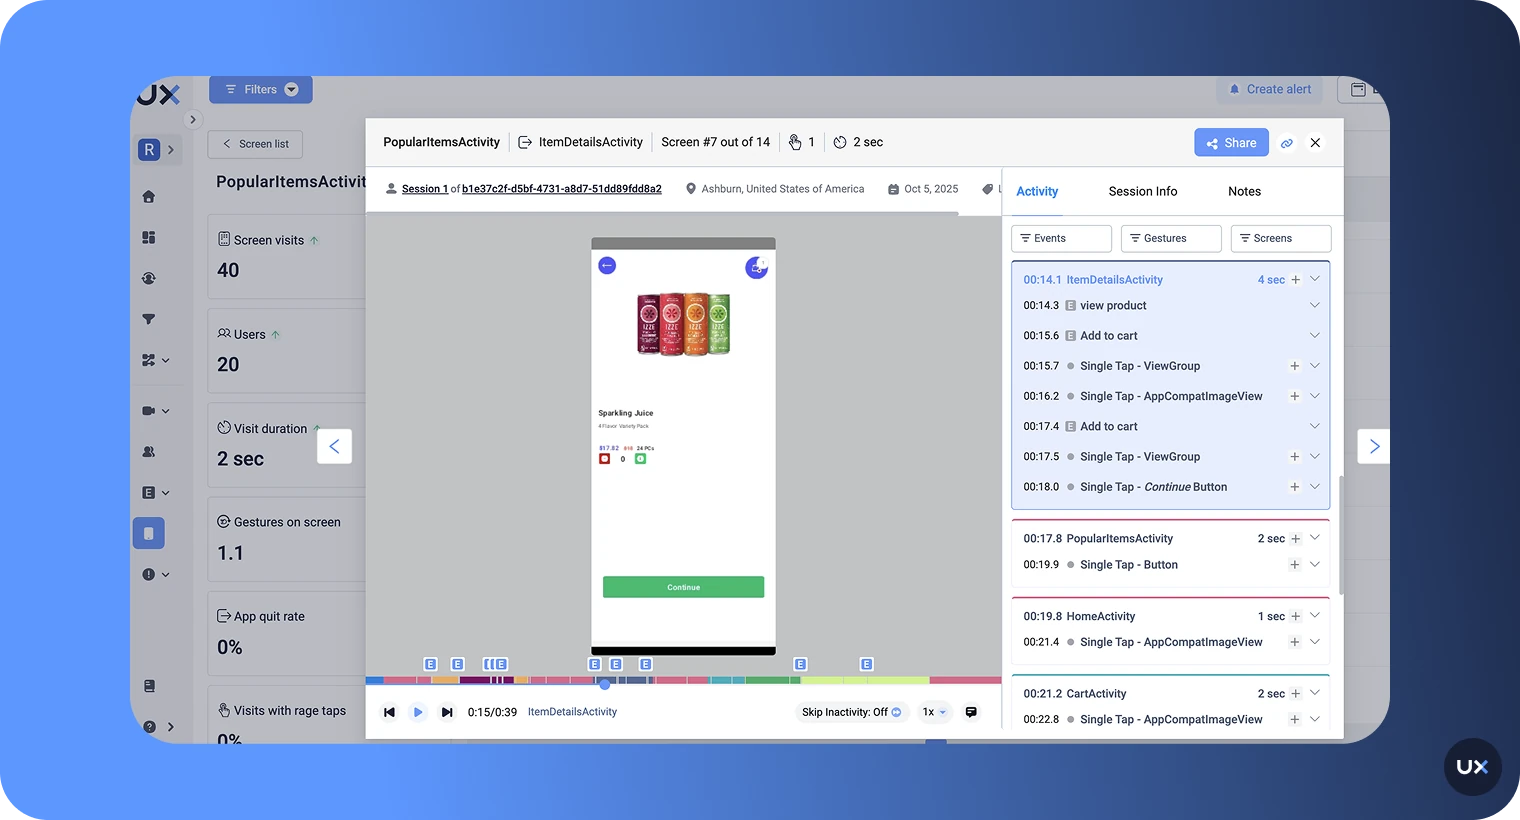
With Tara AI, UXCam's AI analyst, you don't even need to watch sessions manually. Tara processes sessions at volume, surfaces the patterns that matter, and recommends actions.
Heatmaps
Heatmaps overlay tap, scroll, and attention density onto a screen so you can see engagement at a glance. They're the fastest way to spot dead zones, misread CTAs, and layouts where the most-tapped element is not the one you designed the flow around.


Usability testing
Usability testing gives you structured observation of users completing specific tasks. It's slower and more expensive than replays, but it's the right tool when you're validating a new flow pre-launch or testing against a competitor. Pair it with remote usability testing tools to keep costs down.
Focus groups and diary studies
Useful occasionally for generative research. I rarely recommend them for ongoing UX analytics because the signal-to-noise ratio is low compared to replays, and participants' self-reported behavior is often inaccurate.
User feedback and NPS
In-app feedback, NPS surveys, and app store reviews give you direct voice-of-customer input. They're most valuable when connected to the behavioral session behind the comment, so you can see what the user was doing when they rage-tapped their way to a 1-star review.
Quantitative UX analytics methods
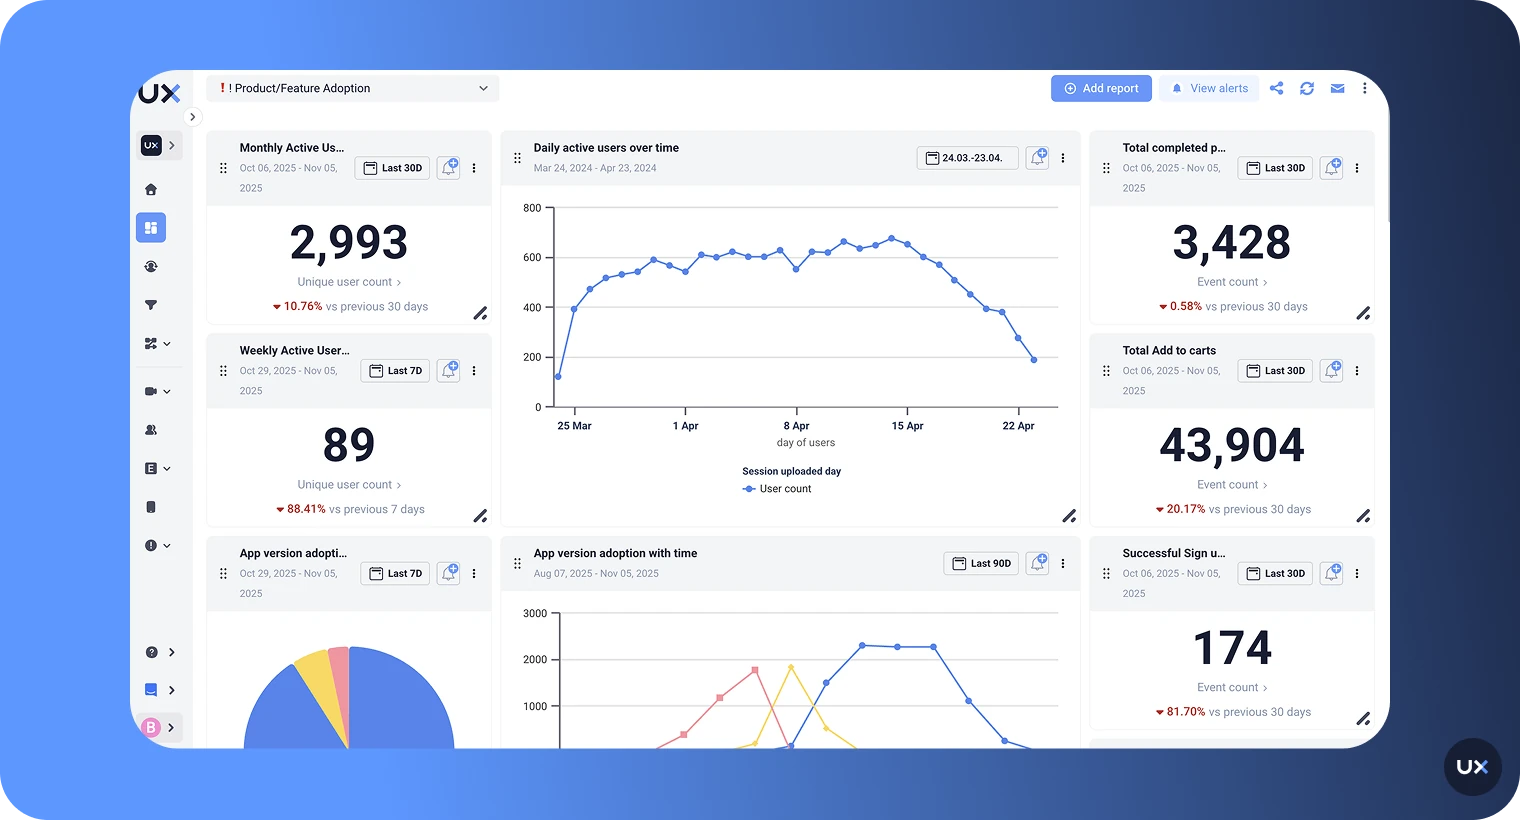
Event and product analytics
Event tracking captures specific user actions: a tap on "Add to cart," a view of the pricing screen, a successful checkout. Modern platforms support autocapture, which records every interaction without requiring engineers to hand-instrument each event.
Funnel analytics
Funnels show you conversion between defined steps and expose where users drop. The difference between a good funnel tool and a great one: can you click on a drop-off and watch the replays of users who abandoned right there?
Retention analytics
Retention analytics tracks whether users come back and what keeps them coming back. Day-1, Day-7, and Day-30 retention cohorts paired with feature-usage data are how you identify your real product-market-fit moments.
A/B testing
A/B testing validates hypotheses with statistical rigor, but you need enough traffic to power it, usually 2,000+ users per variant, and a clear primary metric before you start. See our breakdown of the best A/B testing tools for mobile apps.
Form and click testing
Form analytics measures abandonment at each input field. Click testing records which element gets tapped first on a given screen. Both are narrow-use tools that slot inside a broader UX analytics practice.
13 UX analytics patterns, tactics, and pitfalls worth knowing
Over the last few years of doing this, these are the specific patterns I keep coming back to when I audit a team's setup. Treat this as a checklist you can run against your own practice.
1. Autocapture before manual instrumentation
Teams that start by writing a 200-event tracking plan usually ship nothing for three months. Install an autocapture SDK first, get every interaction flowing, then layer custom events for business-critical moments like "subscription started" or "KYC completed." Segment's tracking plan guide explains why most manual plans decay within a quarter.
2. Connect every chart to a replay
If your funnel tool and your replay tool live in different URLs, you've built a dashboard, not an analytics practice. The highest-leverage integration in any UX stack is "click drop-off step, watch the 20 sessions that dropped." Without it, teams guess.
3. Track rage taps and UI freezes as first-class metrics
Rage taps (repeated taps on the same element within a short window) and UI freezes correlate more tightly with churn than almost any other behavior I've measured. UXCam's issue analytics surfaces both automatically. If your tool doesn't, you're missing the highest-signal frustration indicator available.
4. Segment by acquisition source on day one
A paid-social user behaves nothing like a referral user. Aggregate retention curves hide that. Split every major metric by channel before you draw conclusions, otherwise you'll "fix" onboarding for the wrong cohort.
5. Watch sessions at 2x speed with sound off
Practical tip, not philosophical. You'll process 3-4x more sessions per hour, and your pattern recognition actually improves because you stop over-indexing on individual moments. Reserve 1x speed for the 5-10 sessions you want to dissect.
6. Don't sample if you can avoid it
Sampled session data misses the long tail of weird bugs, which is where most high-impact fixes hide. If your plan caps sessions, prioritize capture of your highest-value flows (checkout, signup, upgrade) and deprioritize everything else.
7. Build friction scores, not dashboards
A weighted composite of rage taps, UI freezes, crashes, and abandonment correlates with support volume better than any single metric. NN/g's research on frustration argues for exactly this kind of composite view.
8. Review sessions as a team, not solo
A solo PM watching replays finds 30% of the insights a PM, designer, and engineer watching together find. The engineer spots the technical glitch, the designer spots the layout issue, the PM spots the intent mismatch.
9. Tag sessions by hypothesis, not by event
After review, tag with labels like "checkout-confusion-shipping" or "onboarding-permission-drop." Event tags get stale. Hypothesis tags compound into a searchable library of known issues.
10. Don't confuse replay volume with insight volume
Watching 500 sessions a week isn't a KPI. Shipping 3 validated fixes per sprint from replay insights is. Measure output, not input. Tara AI collapses the input side so you can focus on output.
11. Instrument error states, not just happy paths
Most teams track "payment_success." Few track "payment_failed_reason." Without the failure taxonomy, your funnel looks like a black box at the exact moment you most need visibility.
12. Treat app store reviews as qualitative data
Reviews are labeled sessions, the user tells you what went wrong in their own words. Connect app store review dates to session data and you'll often find the replay that prompted the 1-star rating.
13. Kill vanity metrics quarterly
DAU is not an outcome. Session length is not an outcome. Do a ruthless metric audit every quarter and retire anything that hasn't influenced a decision in the previous three months. ProductPlan's vanity vs actionable metrics piece is a useful starting framework.
Industry-specific UX analytics considerations
Fintech and banking
Compliance is the hard constraint. PII masking, SOC 2, and often PCI-DSS have to be baked in before a single session is recorded. I've seen fintech teams spend six weeks negotiating SDK installs with their security team. The teams that move faster pick a vendor with automatic on-device masking (UXCam masks input fields by default) and documented compliance posture up front. Watch KYC and funding flows like a hawk, those are where dropout compounds into lost LTV.
E-commerce and retail
Cart abandonment sits around 70% industry-wide, and the reasons vary screen by screen. Instrument shipping selection, address entry, and payment method selection as separate funnel steps. Pair form analytics with session replay so you can see the specific field that caused abandonment. Seasonal traffic spikes (Black Friday, holiday) also mean your baseline conversion shifts, segment before and after to avoid false positives on fixes.
Healthcare and telemedicine
HIPAA compliance is non-negotiable, which rules out several tools on this list unless they sign a BAA. Masking goes beyond credit cards here, you need to mask diagnosis fields, medication names, and provider notes. Appointment booking flows and prescription refills are the highest-value journeys to monitor, and rage taps on booking screens correlate with patients dropping to phone support, which blows up operational cost.
SaaS and B2B
Activation is the metric that matters. OpenView's PLG benchmarks show that Day-30 activation rate is the single strongest predictor of annual retention for self-serve SaaS. Use session replay to watch what your fastest-activating cohort actually does, then optimize onboarding to funnel every new user through that path.
Media and streaming
Engagement and session frequency dominate, and friction shows up as stalling and buffering rather than taps. Pair UX analytics with technical performance data (video start failures, rebuffer ratios), because a user who churns after a buffering incident looks behaviorally like a user who churned over UX. Without the technical overlay, you'll misattribute.
Travel and hospitality
Multi-session journeys are the norm, users research on mobile, book on desktop, manage on mobile again. Cross-device identity stitching matters more here than in most categories. Date picker and map interactions are common friction points, watch the replays of users who tap the search button three or more times without changing inputs.
UX analytics tools by category
Not every team needs a full suite. Here's how the market breaks down by the specific job to be done.
All-in-one product intelligence: UXCam (mobile and web, with AI), Contentsquare, Glassbox, FullStory.
Quantitative-first product analytics: Mixpanel, Amplitude, Heap, PostHog.
Web-only qualitative: Hotjar, Mouseflow, Microsoft Clarity (free, surprisingly capable).
Usability and user research: Maze, UserTesting, Lookback, Dovetail for research repositories.
Feedback and surveys: Qualtrics, Typeform, Sprig, in-app survey modules inside most DXA platforms.
Mobile-specific supporting tools: Firebase Analytics for install attribution, Sentry or Bugsnag for crash reporting, AppsFlyer or Adjust for attribution.
Experimentation: Statsig, LaunchDarkly, Optimizely, VWO.
Data warehouse and modeling layer: Snowflake, BigQuery, dbt for teams building a custom analytics layer downstream.
Most mid-market teams end up with three tools: one product intelligence platform (UXCam or similar), one quantitative analytics tool if they need deeper cohort work, and one survey or feedback tool. Teams with four or more overlapping tools almost always have a consolidation opportunity worth $30-100k annually.
How to build a UX analytics strategy that actually works
Here's the sequence I walk teams through.
1. Define the decision you need to make, not the dashboard you want to build. "Should we redesign onboarding?" is a decision. "Track all events" is not. Start with the question.
2. Pick 3-5 north-star UX metrics. I'd suggest: activation rate, Day-7 retention, key funnel conversion, rage tap rate, and time-to-first-value. More than that and nothing gets attention.
3. Install autocapture first, custom events later. Every day you spend manually tagging events is a day you're not getting insight. Autocapture SDKs like UXCam's capture everything automatically, then you add custom events for business-specific actions.
4. Connect quantitative to qualitative by default. Every chart should be one click from the underlying sessions. If your stack doesn't support that, you have two disconnected tools, not an analytics practice.
5. Make weekly session review a ritual. 30 minutes a week with your PM, designer, and engineer watching replays of confused users beats any quarterly research report. Or let Tara AI do the watching and bring you the top patterns.
6. Close the loop. Every insight gets a ticket, every ticket gets shipped, every shipped change gets measured against the baseline.
A UX analytics maturity model
Use this to figure out where you actually are, not where you wish you were.
Level 1: Reactive. You have Google Analytics or Firebase, you look at dashboards weekly, and most product decisions are driven by opinion or HiPPO. When conversion drops, you spend days guessing at causes.
Level 2: Instrumented. You've installed a product analytics tool and tagged your core funnel. You can answer "what happened" questions but not "why." Session replay, if you have it, lives in a separate tool that nobody opens.
Level 3: Connected. Quantitative and qualitative live in one platform. Weekly session reviews are a ritual. Rage taps and UI freezes are tracked. You ship changes based on evidence and measure them against a baseline.
Level 4: Proactive. An AI analyst layer (Tara AI or equivalent) surfaces patterns without you asking. Friction scoring is a board-level metric. New features ship with UX hypotheses and pre-defined success criteria. You catch issues in pre-release monitoring before most users ever see them.
Level 5: Embedded. UX analytics is how the whole company talks about users, not a specialty. Support, marketing, and engineering all pull from the same behavioral data. Every ticket, campaign, and release decision has a specific session or cohort behind it.
Most teams I audit are at Level 2 thinking they're at Level 3. The fastest jump is Level 2 to Level 3, and it's usually one platform consolidation away.
The best UX analytics tools in 2026
How I evaluated these tools
I scored every tool on five weighted criteria:
Depth of qualitative data (session replay quality, heatmap fidelity, frustration signals), 30%
Quantitative analytics (events, funnels, retention, cohorting), 25%
Platform coverage (mobile, web, hybrid, enterprise), 15%
Setup and time-to-insight (autocapture, AI, ease of instrumentation), 15%
Pricing transparency and value at mid-market scale, 15%
I also factored in public G2 ratings and the customer outcomes teams actually report. I did not include tools I couldn't access or that are primarily marketing automation with an analytics tab bolted on.
1. UXCam
Best for: for mobile apps and the web product teams that also need web, plus anyone who wants qualitative and quantitative analytics without running two tools.
UXCam is a product intelligence and product analytics platform installed in 37,000+ products. It combines session replay, heatmaps, issue analytics (rage taps, UI freezes, crashes), funnels, retention, and Tara AI, the AI analyst that watches sessions for you and surfaces patterns and recommendations automatically. UXCam covers both mobile apps and the web.


Pros
Autocapture SDK, no manual event tagging needed to get started
Tara AI summarizes behavior patterns and flags friction automatically
Session replays linked to every funnel, retention, and issue chart
Rage tap and UI freeze detection out of the box
GDPR, CCPA, and HIPAA compliant with automatic data masking
4.7 stars on G2
Cons
Enterprise-level custom integrations may require solutions engineering
Most powerful on mobile, though web parity is now live
Pricing: Free plan up to 3,000 sessions/month. Paid plans customized by volume. See UXCam plans.
Proof it works: Recora cut support tickets by 142%. Inspire Fitness lifted time-in-app by 460% and cut rage taps by 56%. Housing.com doubled feature adoption from 20% to 40%.
2. Mixpanel
Best for: Product teams that want event-based quantitative analytics and are willing to pair it with a separate qualitative tool.
Mixpanel is a well-established product analytics platform known for flexible event tracking, funnels, cohort analysis, and retention reporting. Strong quantitative engine, no native session replay (they have a replay feature but it's lighter than specialist tools).


Pros
Powerful funnel and cohort analysis
Strong SQL-free querying interface
Generous free tier
Cons
Event instrumentation requires engineering time
Qualitative depth (replays, heatmaps, frustration signals) is limited
Costs scale steeply with event volume
Pricing: Free plan included. Growth plan starts at $0.28 per 1,000 events. Enterprise custom.
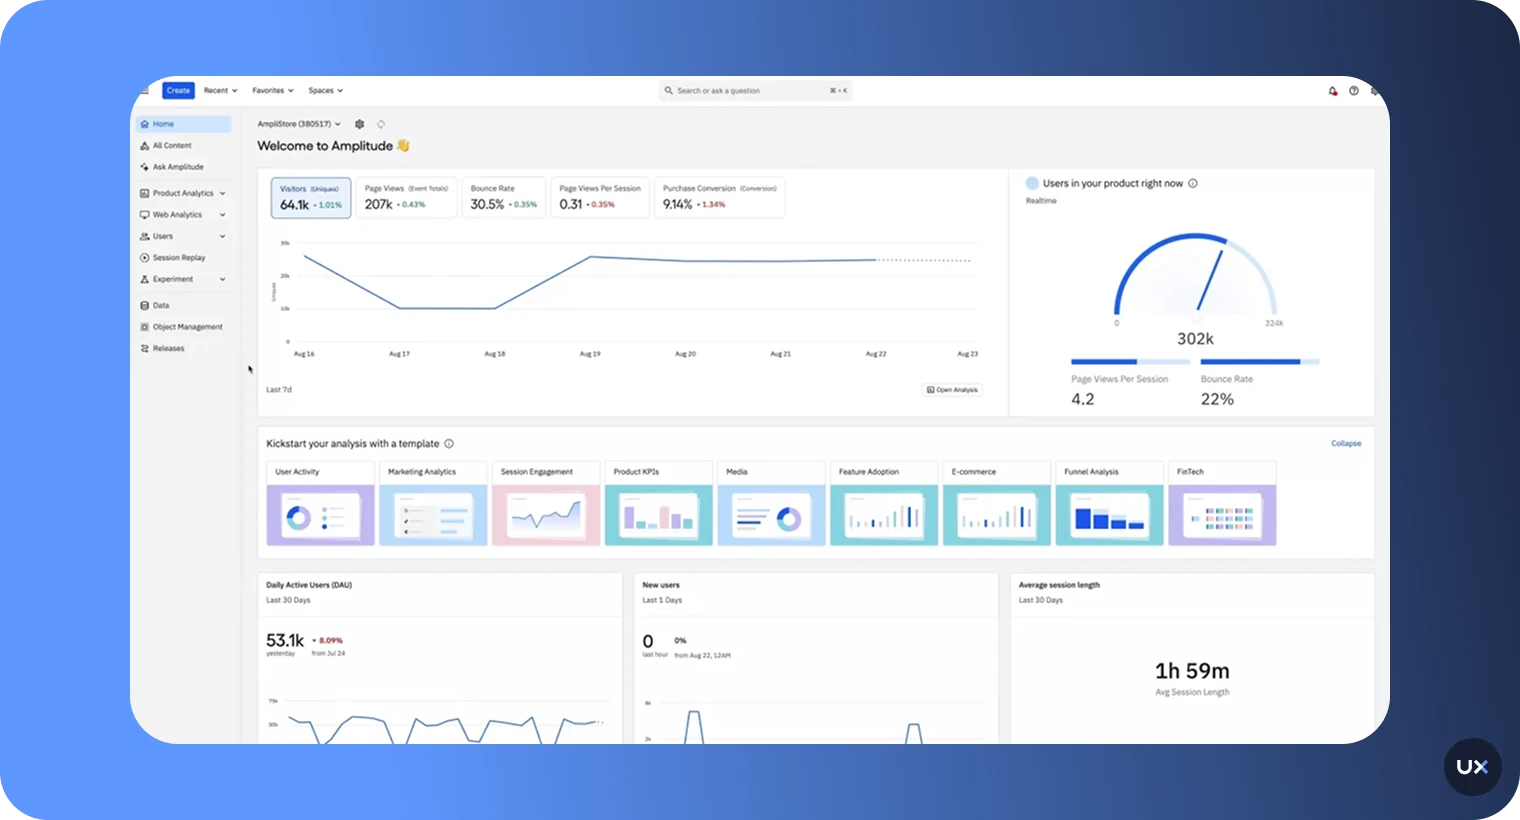
3. Amplitude
Best for: Large teams with a dedicated data function and a heavy focus on behavioral cohorts and predictive analytics.
Amplitude is a leader in product analytics with strong pathfinder, cohort, and predictive tooling. Like Mixpanel, it's quantitative-first and most powerful when paired with a qualitative platform.


Pros
Best-in-class behavioral cohort analysis
Pathfinder flow visualization
Predictive churn and engagement models
Free plan up to 10M monthly events
Cons
Steep learning curve for non-analysts
Session replay is a newer, less mature add-on
Enterprise pricing gets expensive fast
Pricing: Free up to 10M events/month. Plus plan from ~$61/mo. Enterprise custom.
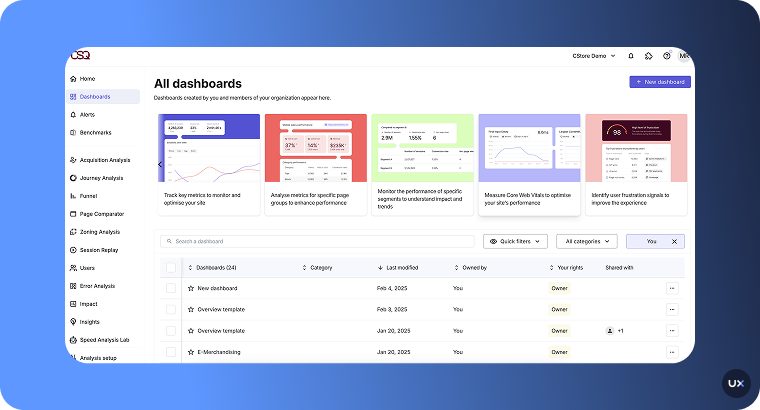
4. Contentsquare
Best for: Enterprise digital experience teams with budget for a full-suite platform.
Contentsquare is a comprehensive digital experience analytics platform combining session replays, heatmaps, journey mapping, frustration scoring, and AI insights. It acquired Hotjar, so there's some product overlap, Hotjar serves the SMB, Contentsquare the enterprise.


Pros
Deep journey and zoning analysis
AI-powered "Sense" insights
Strong on both web and mobile web
Cons
Enterprise pricing, not accessible for smaller teams
Implementation can take months
Native mobile app coverage is less mature than for mobile apps and the web tools
Pricing: Custom quote only.
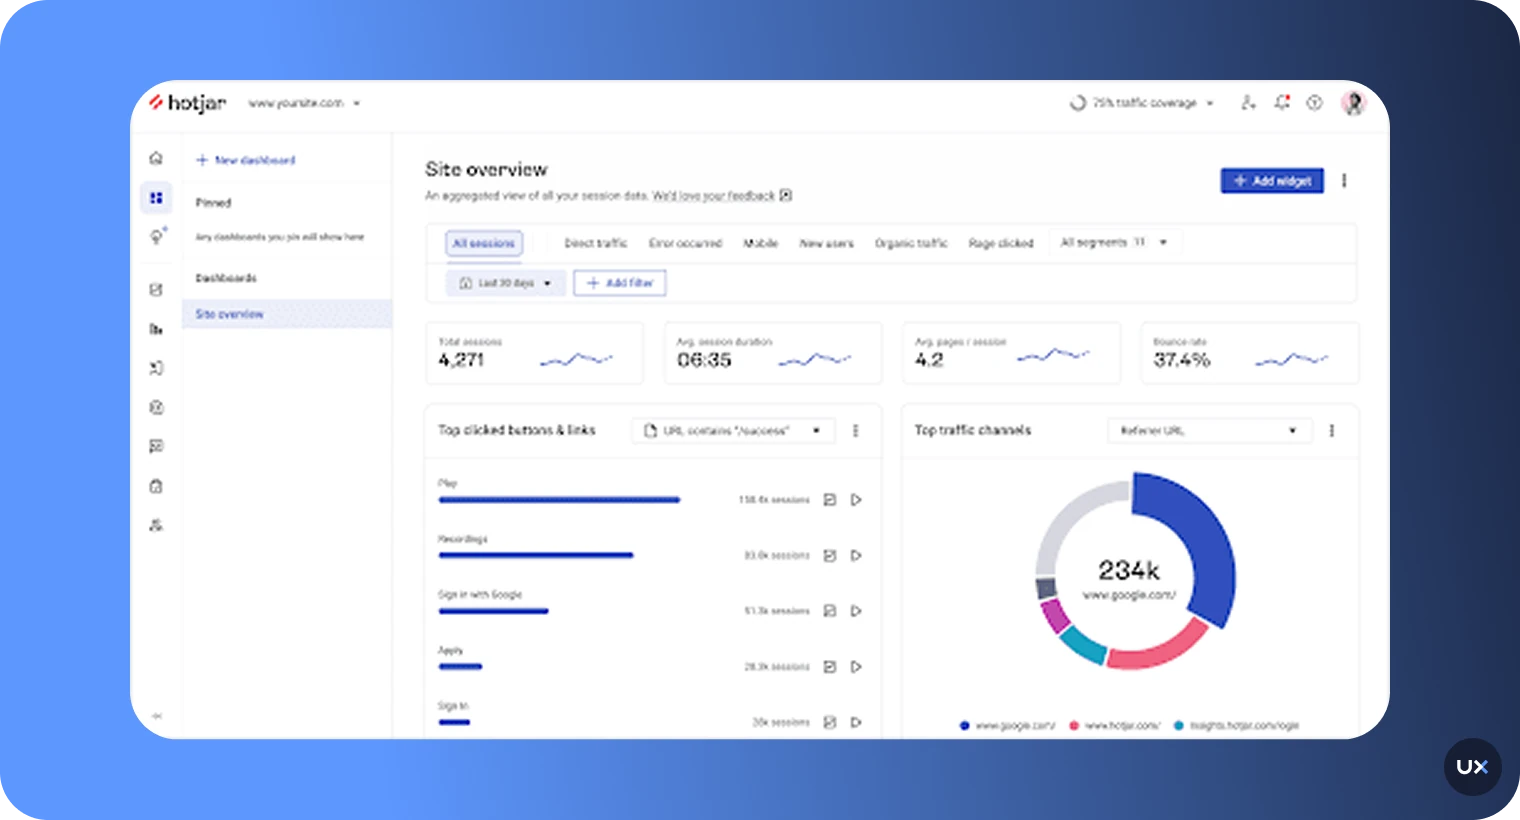
5. Hotjar
Best for: Small-to-mid web teams that want heatmaps, replays, and surveys in one lightweight tool.
Hotjar (now part of Contentsquare) is the most widely adopted qualitative web analytics tool for SMBs. Heatmaps, session recordings, and on-site surveys. Web only, so mobile-app teams need to pair it with something else.


Pros
Easy to set up, friendly UI
Generous free tier
Solid heatmap and replay basics
Cons
No native mobile app support
Quantitative analytics (funnels, cohorts) are shallow
Session limits on lower plans hit fast on high-traffic sites
Pricing: Free forever plan. Paid from $49/mo.
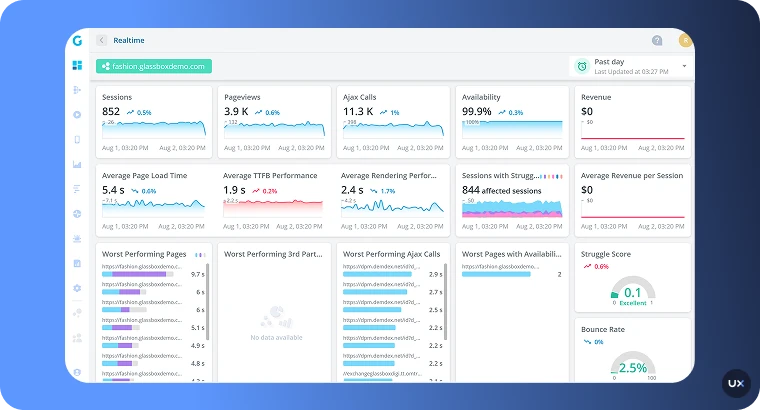
6. Glassbox
Best for: Regulated enterprises (finance, healthcare, insurance) that need 100% session capture and strict compliance.
Glassbox (which acquired SessionCam) captures every user interaction across web and mobile with enterprise-grade data governance. Built for organizations where you need every session, not a sample.


Pros
Full session capture, no sampling
ISO/IEC 27001 certified, strong compliance
Struggle detection and journey analytics
Cons
Enterprise pricing and implementation
Overkill for most mid-market teams
UI is dense and requires training
Pricing: Custom.
7. Mouseflow
Best for: Web marketing teams focused on conversion optimization.
Mouseflow offers session replay, six types of heatmaps, funnels, and form analytics for websites. A solid Hotjar alternative with stronger heatmap variety.


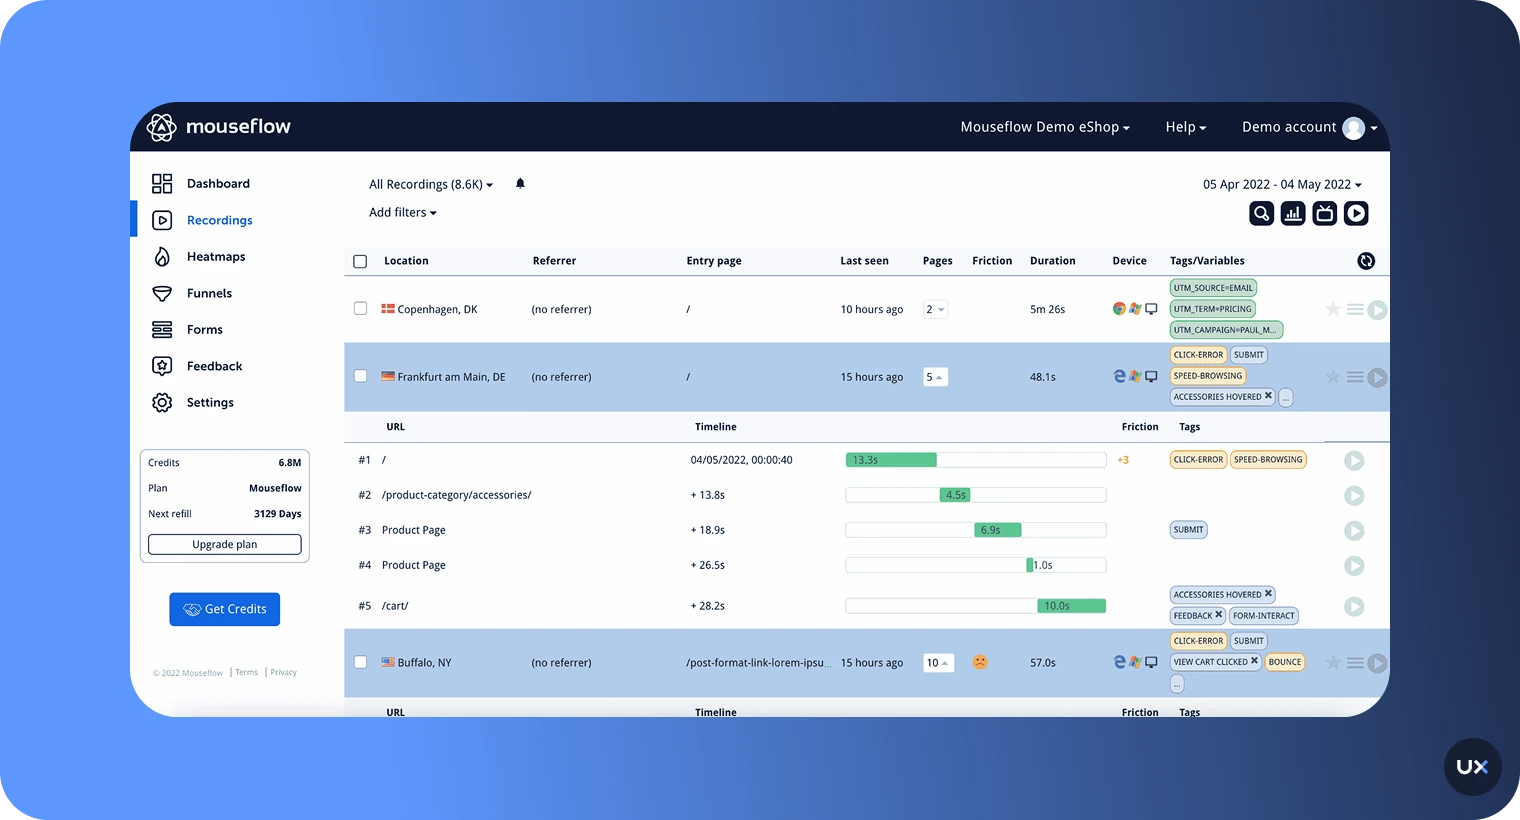
Pros
Six heatmap types including attention and geo
Friction scoring on sessions
Affordable entry pricing
Cons
Web only, no mobile app analytics
Free tier capped at 500 sessions/mo
Quantitative depth is limited
Pricing: Free up to 500 sessions/mo. Paid from $39/mo.
8. Adobe Analytics
Best for: Large enterprises already inside the Adobe Experience Cloud ecosystem.
Adobe Analytics is a heavyweight enterprise analytics platform with advanced segmentation, attribution modeling, and AI forecasting via Adobe Sensei.


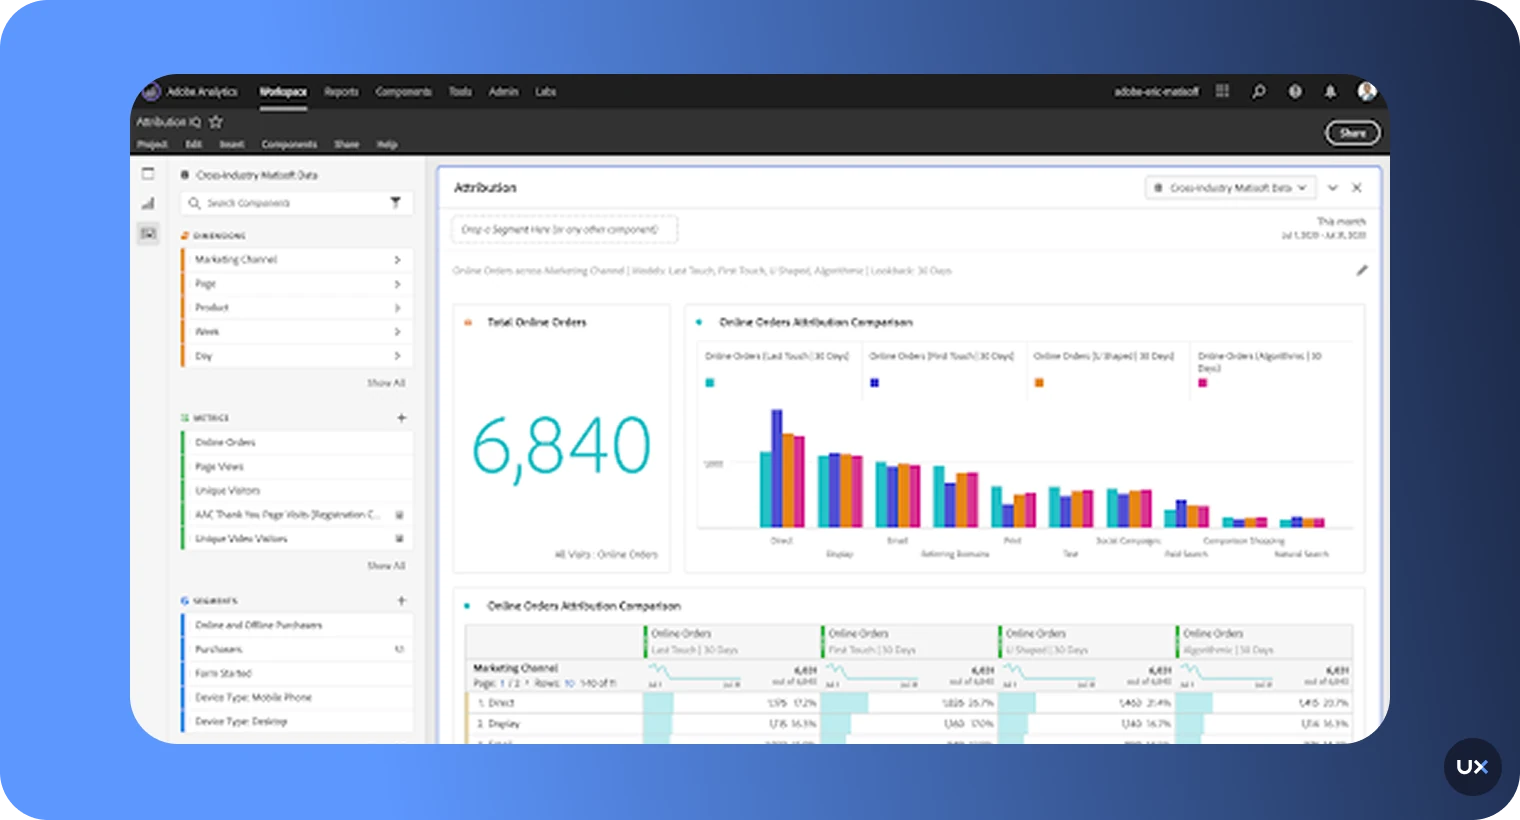
Pros
Extremely deep segmentation and attribution
Tight integration with the rest of Adobe Experience Cloud
Enterprise-grade governance
Cons
Steep learning curve, requires specialists
Expensive, quote-only pricing
Qualitative tools are limited without adding other Adobe products
Pricing: Custom quote.
9. Firebase Analytics
Best for: Early-stage mobile apps that need free, lightweight event tracking.
Firebase Analytics (part of Google Firebase) gives you basic event tracking, audience segmentation, and attribution for mobile apps. Good as a starting point, but it's a reporting tool, not a UX analytics tool.


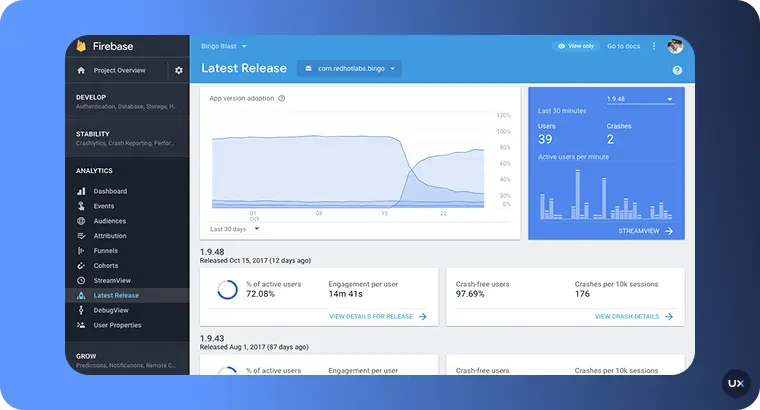
Pros
Free to start
Native integration with Google Ads and BigQuery
Good for install attribution and crash reporting
Cons
No session replay or heatmaps
Sampling on high-volume apps
Data latency makes real-time analysis awkward
Pricing: Free tier, pay-as-you-go for advanced features.
10. FullStory
Best for: Web-heavy teams that want session replay with a strong quantitative layer.
FullStory is a digital experience platform with autocapture, session replay, heatmaps, and funnel analytics. Traditionally web-first, with growing mobile coverage.
Pros
Strong autocapture and retroactive analysis
Clean replay UI
Good frustration signal detection
Cons
Mobile parity behind for mobile apps and the web tools
Enterprise pricing opaque
Can feel heavy for small teams
Pricing: Custom quote.
Quick comparison
| Tool | Best for | Mobile | Web | Free plan | Starting price |
|---|---|---|---|---|---|
| UXCam | Mobile + web product teams | ✅ | ✅ | 3,000 sessions/mo | Custom |
| Mixpanel | Event-based product analytics | ✅ | ✅ | Yes | $0.28/1k events |
| Amplitude | Enterprise behavioral analytics | ✅ | ✅ | 10M events/mo | ~$61/mo |
| Contentsquare | Enterprise DXA | Limited | ✅ | No | Custom |
| Hotjar | SMB web teams | ❌ | ✅ | Yes | $49/mo |
| Glassbox | Regulated enterprise | ✅ | ✅ | No | Custom |
| Mouseflow | Web CRO | ❌ | ✅ | 500 sessions/mo | $39/mo |
| Adobe Analytics | Adobe-stack enterprise | ✅ | ✅ | No | Custom |
| Firebase | Early-stage mobile | ✅ | Limited | Yes | Free |
| FullStory | Web DXA | Limited | ✅ | No | Custom |
10 common UX analytics mistakes to avoid
Tagging 200 events before watching 20 sessions. Instrumentation without observation produces dashboards no one reads. Flip the order.
Treating session replay as surveillance theater. If you're watching sessions to validate a decision you've already made, you'll find what you want. Go in with a hypothesis, not a verdict.
Ignoring PII masking until legal raises a flag. Retrofitting masking across a mature codebase is painful. Configure it on day one, even if you're a two-person team.
Measuring session length as a success metric. Long sessions can mean engagement or confusion. Without frustration signals overlaid, you can't tell which.
Running funnel analysis on a single date range. Funnels shift with seasonality, marketing campaigns, and releases. Always compare week-over-week or against a control cohort.
Trusting self-reported survey data over behavioral data. Users routinely describe behavior that doesn't match their replays. When the two conflict, behavior wins.
Building a custom data warehouse before validating the questions. Six-month Snowflake implementations are a favorite procrastination move for teams that don't want to face their actual UX issues.
Only watching sessions from churned users. You also need to watch power users. The delta between a confused user and a fluent one tells you where to invest design effort.
Skipping mobile-specific metrics on a mobile-heavy product. Tap targets, gesture conflicts, and permission prompts behave nothing like web clicks. Instrument for the platform you're actually on.
Hoarding insights inside the product team. Support, marketing, and sales all benefit from session evidence. Set up a Slack channel or weekly email where the best 3 replays of the week get shared.
What's next for UX analytics
A few shifts I'm watching closely in 2026:
AI analysts replace manual replay watching. Tools like Tara AI inside UXCam process thousands of sessions and surface the 5 patterns that matter. The manual review workflow is going away.
Frustration scoring becomes the primary UX metric. Rage taps, UI freezes, and repeat errors give you a composite "friction score" that correlates tightly with churn and support volume.
Unified mobile and web analytics. Teams are consolidating from 3-4 separate tools into one platform that covers every surface.
Privacy-first by default. With evolving regulation in the EU, US, and APAC, automatic PII masking is no longer a premium feature, it's table stakes.
Improve your UX analytics with UXCam
If you're tired of watching dashboards that don't explain themselves, start a free UXCam trial. You'll get 3,000 monthly sessions, full session replay, heatmaps, funnels, issue analytics, and Tara AI. Installed in 37,000+ products, for mobile apps and the web, and covering the web too.
Frequently asked questions
What is the difference between UX analytics and web analytics?
Web analytics tools like Google Analytics focus on aggregate traffic metrics: page views, sources, bounce rate, sessions. They tell you how many people came and roughly what they did. UX analytics goes further by connecting behavioral data to specific user sessions, so for any chart you see, you can watch the actual replays of users who generated that data. UX analytics also includes qualitative signals like heatmaps, rage taps, UI freezes, and survey responses that web analytics tools don't capture. If web analytics answers "what happened," UX analytics answers "why it happened."
Which UX analytics tool is best for mobile apps?
For mobile and web products, UXCam is the most comprehensive option. It's installed in 37,000+ products and combines session replay, heatmaps, funnels, retention, issue analytics (rage taps, UI freezes), and Tara AI in a single platform. Customers like Recora cut support tickets by 142%, Inspire Fitness boosted time-in-app by 460%, and Housing.com doubled feature adoption from 20% to 40%. Firebase is free but only covers basic event tracking with no replay or heatmaps. Amplitude and Mixpanel offer strong quantitative analytics but require a separate qualitative tool. Contentsquare and Glassbox are enterprise-tier and priced accordingly.
How much does UX analytics cost?
Pricing varies widely. Free tiers exist at UXCam (3,000 sessions/month), Mixpanel, Amplitude (10M events/month), Hotjar, and Firebase, which are enough to get a team started. Mid-market paid plans typically run $50-$500/month depending on volume. Enterprise platforms like Contentsquare, Adobe Analytics, and Glassbox are quote-only and usually start in the low five figures annually. The biggest hidden cost isn't license fees, it's the engineering time to instrument manual events. Platforms with autocapture SDKs save weeks of that work.
Do I need both qualitative and quantitative UX analytics?
Yes. Quantitative data tells you what's happening at scale (30% of users drop off at step 3 of checkout), but not why. Qualitative data tells you the cause (users misread the shipping options and bail out), but not whether the pattern is widespread. Using one without the other leads to either statistical abstractions you can't act on, or anecdotes you can't prioritize. The best UX analytics platforms let you move between the two in one click: see a drop-off in a funnel, click to watch the replays of users who dropped, then ship a fix and measure the impact.
How do I start a UX analytics practice from scratch?
Start small and sequence it. First, install a tool with autocapture so you're not blocked on manual event tagging. Second, pick 3-5 north-star UX metrics, activation, Day-7 retention, key funnel conversion, rage tap rate, time-to-first-value, and nothing else for the first quarter. Third, make weekly session review a standing 30-minute ritual with your PM, designer, and engineer. Fourth, every insight you find gets turned into a ticket with a measurable target. Fifth, use an AI analyst like Tara AI to scale beyond what manual review can cover. You'll move from "we think users are confused" to "we know, here's the replay, here's the fix" within a month.
What UX metrics should I track?
The ones that map to product outcomes, not vanity numbers. I'd start with activation rate (did new users reach the aha moment?), Day-7 and Day-30 retention, conversion rate on your primary funnel, rage tap or frustration rate, and time-to-value for new users. Beyond those core five, add feature adoption for any feature you've invested significant build time into, and customer effort score (CES) for critical flows like onboarding and checkout. Avoid drowning in metrics. Five well-understood numbers beat fifty dashboards nobody opens. See our full UX metrics guide for deeper definitions.
How many sessions do I need to capture for UX analytics to be useful?
Enough to see patterns, not necessarily every session. For most mid-market products, 10,000-50,000 sessions per month gives you statistical significance on your top flows and enough replay volume to spot friction. If you're under 3,000 sessions a month, prioritize capturing your highest-value journeys (signup, checkout, upgrade) rather than sampling across the whole product. Regulated industries (fintech, healthcare) often need 100% capture for audit reasons, which is why Glassbox and UXCam are common picks there.
Is UX analytics GDPR and CCPA compliant?
The platform can be, your implementation is what matters. Any serious UX analytics tool offers on-device PII masking, IP anonymization, and data processing agreements. UXCam is GDPR, CCPA, and HIPAA compliant with automatic masking of input fields by default. What trips teams up is not the SDK, it's failing to update their privacy policy and cookie consent flows to disclose session recording. Work with legal before you ship, not after.
How is AI changing UX analytics?
Fundamentally. Until recently, session replay required a human to watch sessions and extract patterns, which caps insight at whatever the team has time to review. AI analysts like Tara AI process thousands of sessions in minutes, cluster similar friction patterns, and surface the top recommendations automatically. The shift is from "we watched 50 sessions and think this is the issue" to "the AI watched every session and flagged three patterns, here are the replays behind each." That collapses the time from data to decision by about 10x in my experience.
Can I use Google Analytics as a UX analytics tool?
Partially, but you'll hit ceilings fast. GA4 gives you events, funnels, and basic cohort analysis, and it's free, so it's a reasonable starting point. What you won't get: session replay, heatmaps, rage tap detection, UI freeze tracking, or the ability to watch the actual user sessions behind your funnel drop-offs. For most teams, GA4 handles acquisition and traffic analysis well, and a dedicated UX analytics tool handles behavior and experience inside the product. They complement, they don't substitute.
What's the difference between UX analytics and product analytics?
Significant overlap, different emphasis. Product analytics focuses on quantitative behavioral data, events, funnels, retention, cohorts, and answers "how is the product being used." UX analytics includes all of that plus qualitative signals (replays, heatmaps, frustration) and answers "why is the product being used that way." Modern platforms like UXCam combine both under one roof, which is why the distinction matters less than it used to. Pure-play product analytics tools (Mixpanel, Amplitude) sit on the quantitative side, pure-play experience tools (Hotjar, FullStory) sit on the qualitative side.
How often should I review UX analytics data?
Weekly at minimum for active product development, daily for high-traffic consumer products during major launches. The rhythm I recommend for most teams: a 30-minute weekly session review with PM, designer, and engineer, a monthly metrics review against your north-star KPIs, and a quarterly deep-dive looking at cohort trends and retention curves. Any less frequent and you'll miss drift. Any more frequent and you'll over-react to noise. An AI analyst layer flattens this by surfacing real anomalies in between scheduled reviews.
Do I need a dedicated analyst to get value from UX analytics?
No, and that's the point of modern platforms. Ten years ago, you needed a data analyst to write SQL and build dashboards. Now, autocapture plus AI analysts plus SQL-free query interfaces mean a PM or designer can self-serve 80% of UX analytics questions. What does change with scale: once you're past a few hundred thousand users, a dedicated data or research role pays for itself in the complexity of cohort analysis and cross-platform attribution. Under that, your PM and designer can run the practice themselves.
AUTHOR
Silvanus Alt, PhD
Founder & CEO | UXCam
Silvanus Alt, PhD, is the Co-Founder & CEO of UXCam and a expert in AI-powered product intelligence. Trained at the Max Planck Institute for the Physics of Complex Systems, he built Tara, the AI Product Analyst that not only analyzes user behavior but recommends clear next steps for better products.


TABLE OF CONTENTS
- Key takeaways
- What is UX analytics?
- Why UX analytics matters more than it used to
- Quantitative vs qualitative UX data
- Qualitative UX analytics methods
- Quantitative UX analytics methods
- 13 UX analytics patterns, tactics, and pitfalls worth knowing
- Industry-specific UX analytics considerations
- UX analytics tools by category
- How to build a UX analytics strategy that actually works
- A UX analytics maturity model
- The best UX analytics tools in 2026
- 10 common UX analytics mistakes to avoid
- What's next for UX analytics
- Improve your UX analytics with UXCam


Related articles


Product best practices
User-Centered Design: Definition, Principles, Process, and Methods
User-centered design (UCD) is a design framework that prioritizes users' needs, behaviors, and context at every stage of the product process, from...
Silvanus Alt, PhD
Founder & CEO | UXCam
UI/UX Design
What Is UX Analytics? A Practitioner's Guide (+ 10 Best UX Analytics Tools in 2026)
UX analytics explained by a practitioner: methods, metrics, and the 10 best UX analytics tools in 2026 for product, design, and growth...
Silvanus Alt, PhD
Founder & CEO | UXCam


UI/UX Design
10 Best App Design Practices for App Development in 2026
If you're developing an app, you need to keep UX in mind if you want it to succeed. Check out these 10 best app design...


