Back to blog
11 MIN READ
App Versioning Best Practices - 7 Strategies for Version Tracking
PUBLISHED
4 August, 2024

Product Analytics Expert
Looking to learn the latest app versioning best practices? Or maybe you're struggling to compare the performance of different app versions? You're in the right place.
App versioning isn't just about tracking changes—it's a strategic tool that can drive your product's success. By leveraging user interaction data across different versions, you'll gain invaluable insights into how your changes impact business goals.
In this post, you'll learn how to transform app versioning from a technical task into a competitive advantage. You'll discover how to use version-based performance comparisons to make data-driven decisions that resonate with users.
Whether you're launching a new feature, optimizing user flows, or troubleshooting issues, you'll be equipped you with the tools to measure, analyze, and act on user data with precision. Let's dive in!
Top 7 app versioning best practices
Set up effective version tracking
Collect data across versions
Analyze user interaction data
Compare performance metrics
Data-driven decisions for version updates
Report version performance to stakeholders
Automate version performance monitoring
Fundamentals of app versioning
Before diving into advanced strategies, let's nail down the basics. First and foremost, effective versioning is about communication. It's a tool to convey meaning to your team, users, and app store algorithms. Understanding these fundamentals will set you up for success in your versioning journey.
Semantic versioning (SemVer) explained
SemVer is your blueprint for clear, meaningful version numbers. Here's how it works:
Use a three-part number: MAJOR.MINOR.PATCH
Increment MAJOR when you make incompatible API changes
Increment MINOR when you add functionality in a backward-compatible manner
Increment PATCH when you make backward-compatible bug fixes
For example, moving from 1.2.3 to 2.0.0 signals a major update with potential breaking changes. This system helps your team and users understand the scope of each release at a glance.
Platform-specific version naming conventions
Different platforms have their quirks. Here's what you need to know:
iOS:
Use whole numbers for public releases (e.g., 1.0, 2.0)
Use decimals for minor updates (e.g., 1.1, 1.2)
Increment the build number for each App Store submission
Android:
Follow SemVer for version name (user-facing)
Use an integer for version code (internal tracking)
Always increase the version code for each new release
Cross-platform:
Align version numbers across platforms when possible
Use a unified versioning scheme to simplify communication
Versioning's impact on App store Optimization (ASO)
Your version strategy directly affects your app's visibility and perception. Use your app's version history to highlight major milestones and feature releases to showcase your app's evolution. Here's how:
Frequent updates signal an active, well-maintained app.
Clear, concise update notes highlighting new features can boost downloads.
Consistent versioning helps users track improvements over time.
App versioning best practices
1. Set up effective version tracking
Laying a solid foundation for app version tracking is very important. It's not just about keeping tabs on your releases; it's about creating a framework for data-driven decision making. Here's how to do it right:
Implement version tracking in your codebase
Embed version information in your app's configuration.
Log the version number with every significant event or crash report.
Create a version history file to document changes, making it easier to trace issues.
Pro tip: Use git tags to mark each release in your repository. This creates a clear link between your code and released versions.
Integrate analytics SDKs
Analytics are your eyes and ears once your app is in users' hands. Here's how to leverage them effectively:
Choose a robust and lightweight SDK like UXCam for comprehensive user interaction data.
Implement event tracking for key user actions across all app versions.
Set up automatic screen flow tracking to understand navigation patterns.
Pro tip: Use UXCam's session replay feature to visualize how users interact with each version of your app. This qualitative data is gold for understanding the 'why' behind your metrics.
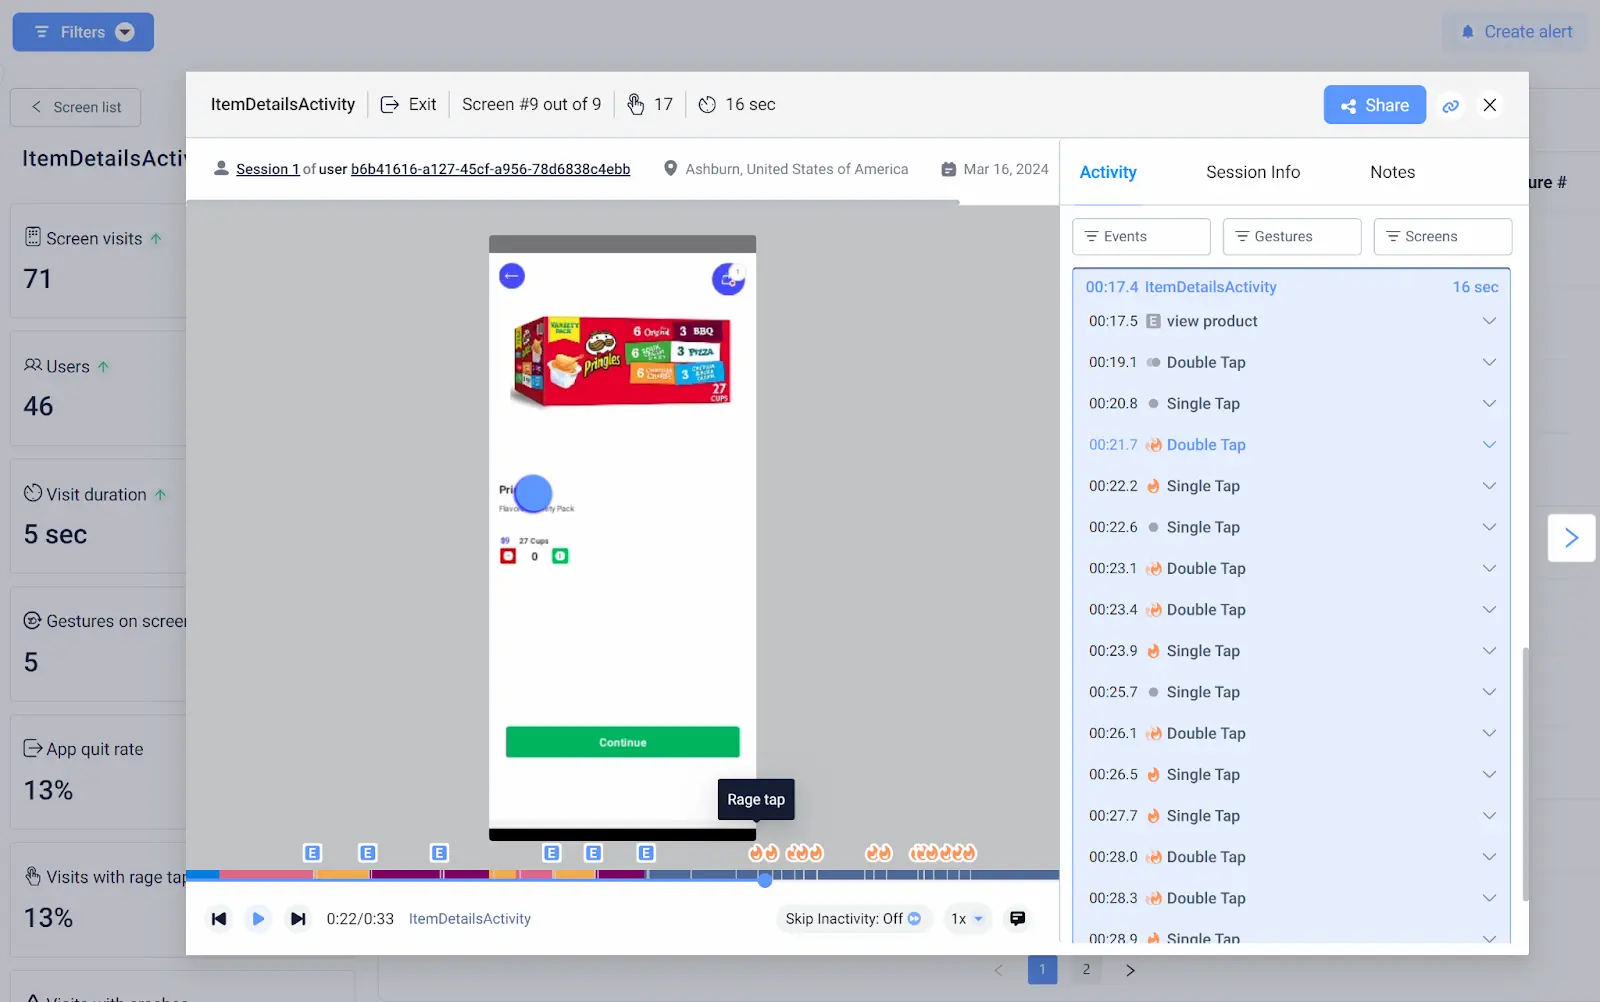
Define key performance indicators (KPIs) for version comparison
The KPIs you choose should align with your business goals. Don't track metrics just because you can – focus on what drives value for your users and your bottom line. You're not just collecting data – you're setting the stage for informed, impactful decisions throughout your app's lifecycle. Your KPIs are the yardstick for measuring success, so choose them wisely. Some important mobile app metrics to track include;
User Engagement: Track daily active users (DAU) and session length.
Feature Adoption: Measure usage rates of new or updated features.
Stability: Monitor crash rates and error occurrences.
Conversion: Track key conversion points in your user journey.
Performance: Measure app load times and response rates.
With this foundation in place, you're ready to dive deeper into version-based performance analysis and optimization.
2. Collect data across versions
Collecting meaningful data across app versions is an art. It's about maintaining consistency while adapting to change. Here's how to nail it:
Ensure consistent event tracking between versions
Consistency is key. Without it, you're comparing apples to oranges. Here's how to maintain data integrity:
Create a centralized events taxonomy and catalog. Document every tracked event, its parameters, their purpose and when it was introduced or modified.
Use versioned event names. Append version numbers to events that change significantly (e.g., "user_signup_v2").
Implement a data validation layer. This catches inconsistencies before they pollute your dataset.
Consistent tracking allows you to spot trends and make accurate comparisons. It's the difference between guessing and knowing what impacts user behavior.
Handle deprecated features and new introductions
Your app evolves, and so should your tracking:
Plan for deprecation. When sunsetting a feature, gradually reduce its tracking importance rather than abruptly stopping.
Introduce parallel tracking. For major feature updates, track both old and new versions simultaneously for a transition period.
Document feature lifecycles. Maintain a clear record of when features were introduced, modified, or removed.
This approach provides context for performance changes. It helps you understand if a metric dropped because a feature was removed or if users genuinely lost interest.
Implement A/B testing for gradual feature rollouts
A/B testing is your safety net for new features. It's a powerful tool for version control:
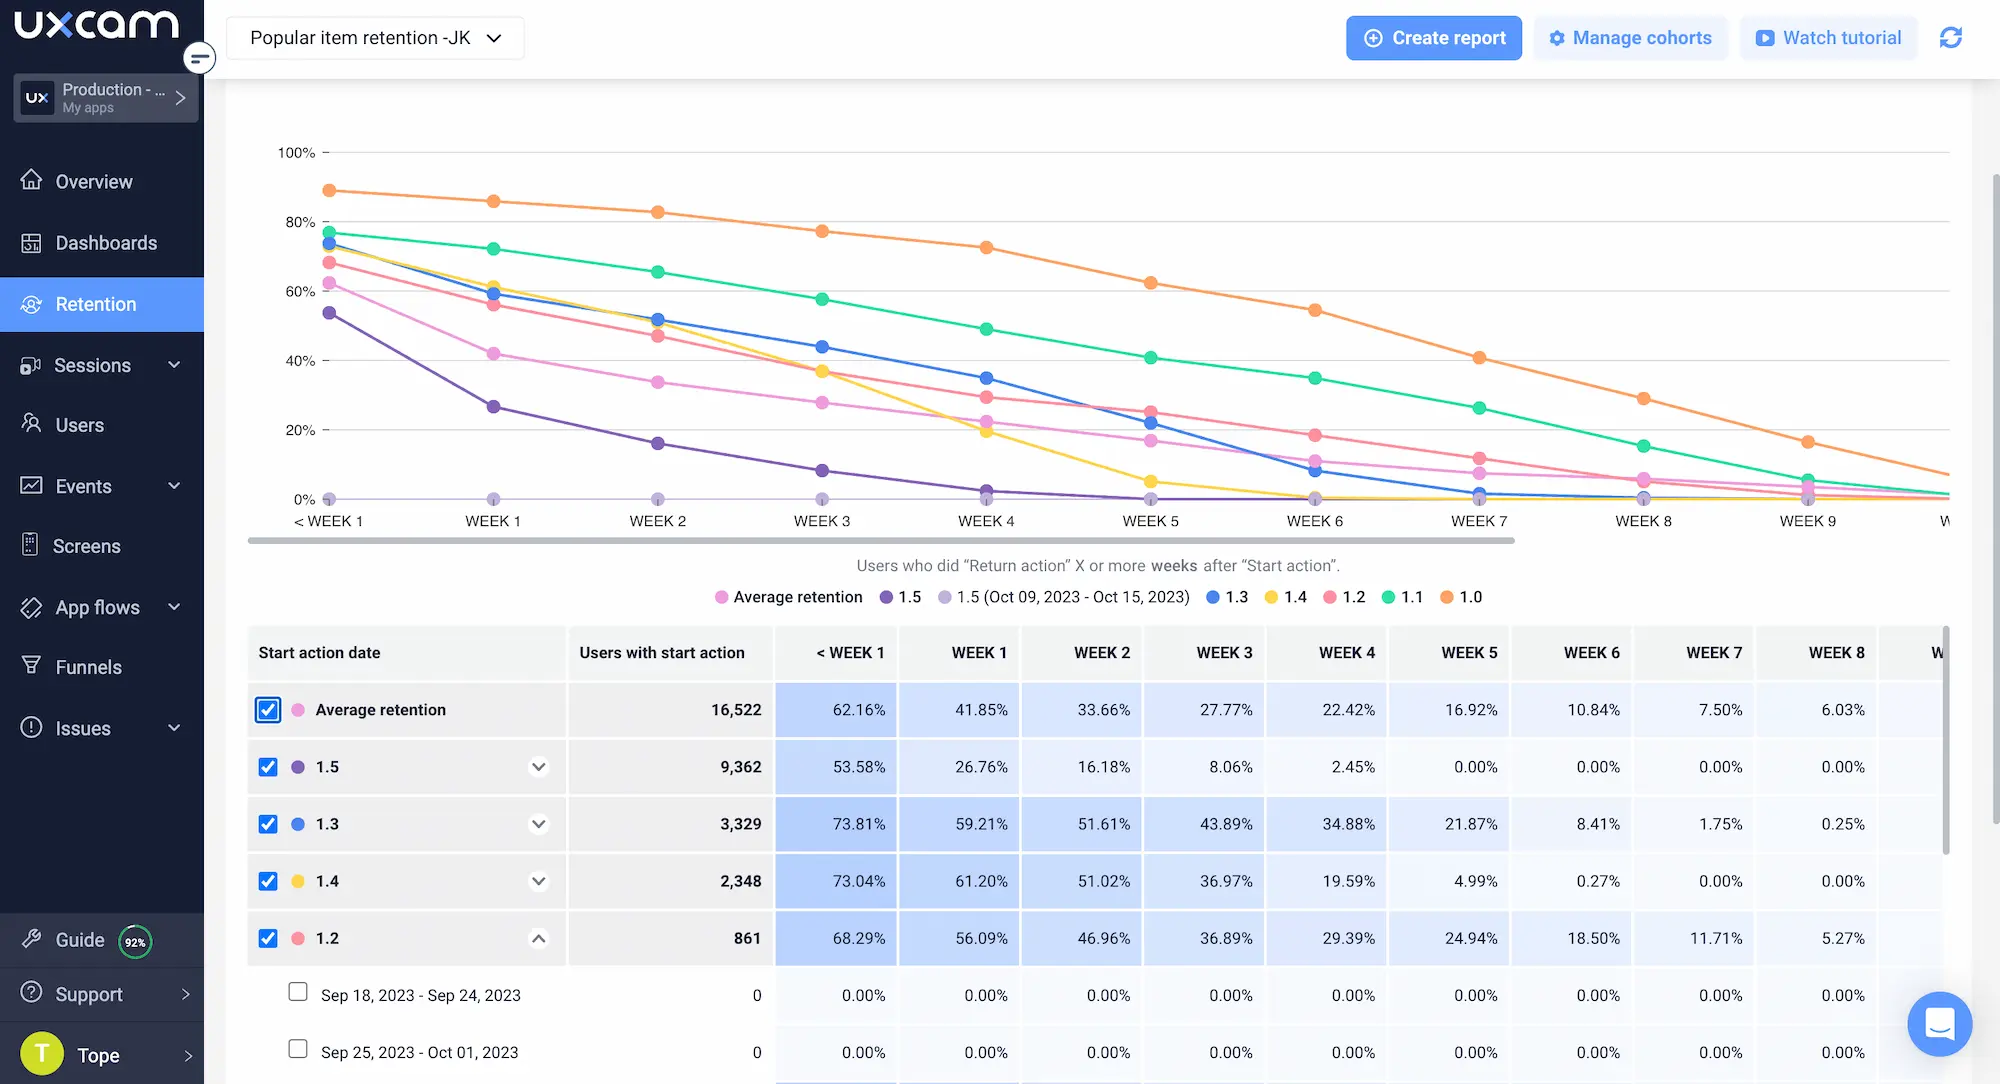
Use cohort analysis: Compare user groups exposed to different versions.
Implement feature flags: This allows you to quickly enable or disable features without a new app release. It also allows for smoother transitions and backwards compatibility in your analytics.
Monitor key metrics: Track how new features affect core KPIs. Start with a small percentage of users (e.g., 5-10%) for new feature rollouts. Gradually increase as you confirm positive impacts on your KPIs.
Gradual rollouts minimize risk. They allow you to gather data and user feedback before committing to a full release, saving you from potential large-scale failures.
Pro tip: Use UXCam's heatmaps and session replay to visualize user interactions with new features across different cohorts. This balance of quantitative and qualitative data often reveals usability issues that pure metrics might miss.

3. Analyze user interaction data
Now that you've set up robust tracking and data collection, it's time to dig into the goldmine of user interaction data. This is where you'll uncover the insights that drive real improvements in your app's performance and user experience. Here are some key app metrics to compare across versions;
User Engagement - Longer sessions and higher retention rates often indicate improved user satisfaction and app stickiness. Evaluate these metrics;
Session duration: Are users spending more time in your app?
Retention rates: Are users coming back more frequently?
Feature Adoption Rates - Low adoption rates might signal poor discoverability, usability issues, or misalignment with user needs. Look at the following metrics.
Usage frequency of new features
Time to first use after feature release
Error Rates and Crash Analytics - Increased crash rates can lead to user frustration and churn. Identifying and fixing these issues quickly is crucial for maintaining user trust. You should keep an eye on;
Crash frequency per user/session
Types of errors encountered
User Flow Changes and Bottlenecks - Changes in user flow can reveal how updates impact user behavior, helping you optimize your app's structure and navigation. You should pay attention to;
Screen flow patterns
Drop-off points in key funnels
While quantitative data tells you what's happening, qualitative data shows you why. This is where UXCam app analytics helps you get the most out of your analysis:
Create version comparison dashboards in UXCam to easily track changes in key metrics over time.
Set up alerts for significant changes in critical metrics to catch issues early.
Compare heatmaps of the same screen across versions to see how design changes impact user behavior. Look for shifts in tap patterns or areas of rage taps (repeated, frustrated tapping).
Regularly review session replays of both high and low-performing user segments to understand the factors influencing your metrics.
Use insights from both quantitative and qualitative data to form hypotheses, then validate them with A/B tests in your next release.
4. Compare performance metrics
Comparing performance across app versions helps you make data-driven decisions that consistently improve your app's performance and user satisfaction. Let's dive into how to do it correctly;
Cohort analysis based on app versions
Cohort analysis allows you to compare and assess whether newer versions truly improve user experience over time. For instance, you might find that users who started with version 2.0 have 20% higher 30-day retention than those who started with 1.0. Here's how to make it work for you:
Create version-based cohorts.
Track key metrics like retention and engagement for each cohort
Compare cohorts at similar points in their lifecycle
Pro tip: Use UXCam's cohort comparison feature to visualize these differences easily. Look for inflection points where metrics significantly change to identify impactful updates.

Funnel analysis for conversion improvements
Funnel analysis quickly highlights whether version changes have positively or negatively impacted your core conversion paths. For example, you might discover that your new checkout process in version 3.1 has increased completion rates by 15%. You can use UXCam funnel analytics to overlay funnels comparing different versions in 3 simple steps:
Define key funnels (e.g., onboarding, purchase flow).
Compare funnel performance across versions.
Identify steps where conversion rates have changed.
This visual representation makes it easy to spot significant changes in user behavior at each step.

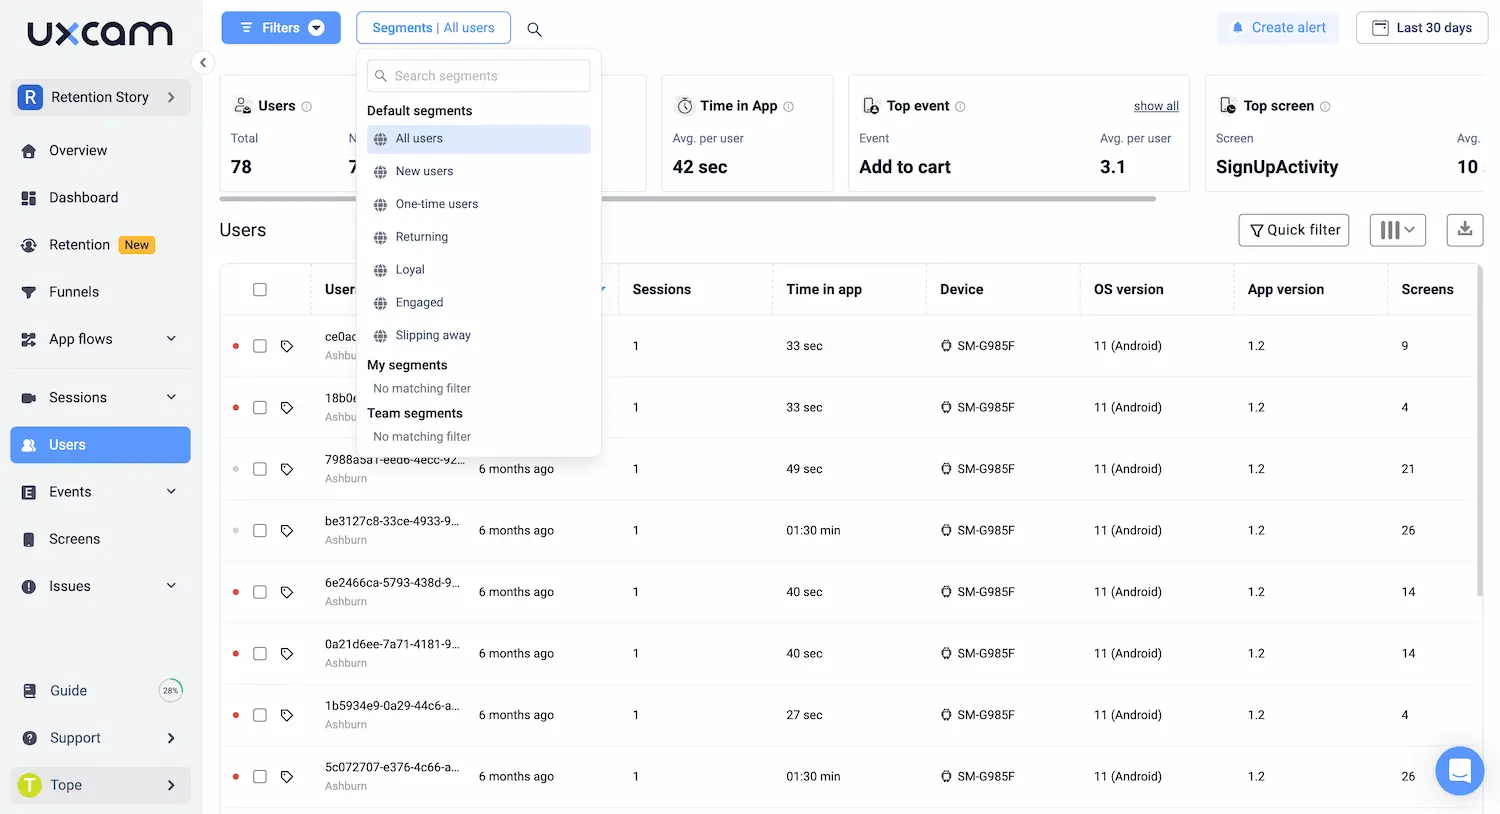
Segmentation for version comparisons
Not all users are created equal. Segmentation allows you to understand how different user groups respond to version changes:
Define key user segments (e.g., power users, new users, paid vs. free)
Compare version performance within and across segments
Identify version changes that disproportionately impact certain segments
For example, you might find that a new feature in version delights power users but confuses new users, indicating a need for better onboarding. This granular approach helps you tailor your versioning strategy to different user needs.
Pro-tip - With UXCam, you can use custom properties to define user segments, apply segment filters to session replays for in-depth analysis and create segment-specific dashboards for easy monitoring.
5. Data-driven decisions for version updates
Your versioning strategy needs to be grounded in hard data. Here's how to leverage that data effectively:
Interpret performance data to guide feature development
If you are a mobile first company, start by creating a feature performance reporting dashboard in UXCam. Track usage, engagement, and error rates for each major feature across versions. This gives you a bird's-eye view of what's working and what's not.
Identify your top-performing features by evaluating your feature adoption metrics. These are your golden geese – nurture them and consider expanding their functionality in future versions.
Next, analyze user flows to spot areas of friction or dropout. UXCam's funnel analysis tool is perfect for this. It helps you identify where users are getting stuck or leaving your app, guiding your efforts for the next version.
Don't forget to use crash reports and error logs to prioritize bug fixes. A stable app is the foundation of a good user experience, so make this a priority in your version planning.
Balance user feedback with quantitative data
User feedback is invaluable, but it needs to be validated with data. Start by correlating user reviews with performance metrics for each version. This helps you understand if vocal users represent the majority or are outliers.
Use UXCam's session replays to dive deeper into user complaints or praises. This qualitative data adds context to your quantitative metrics, helping you understand the 'why' behind the numbers.

Compare sentiment analysis from reviews with quantitative engagement data. If users say they love a feature, but usage data shows low engagement, it's a sign you need to investigate further.
Strategies for rapid iteration based on performance insights
To stay agile, implement feature flags for quick rollbacks if metrics decline. This allows you to respond rapidly to unexpected issues without waiting for a full version update.
Set up automated performance dashboards in UXCam for daily monitoring. This keeps your finger on the pulse of your app's performance, allowing you to spot trends early and act quickly.
Establish a "performance benchmark" for each release. If a new version exceeds thresholds for crashes or performance degradation, automatically trigger a rollback. This safeguards your user experience while you investigate and fix issues.
6. Report version performance to stakeholders
As a product leader, your ability to communicate version performance effectively can make or break your product strategy. Here's how to create compelling reports that resonate with stakeholders and drive action.
Create dashboards for version comparison
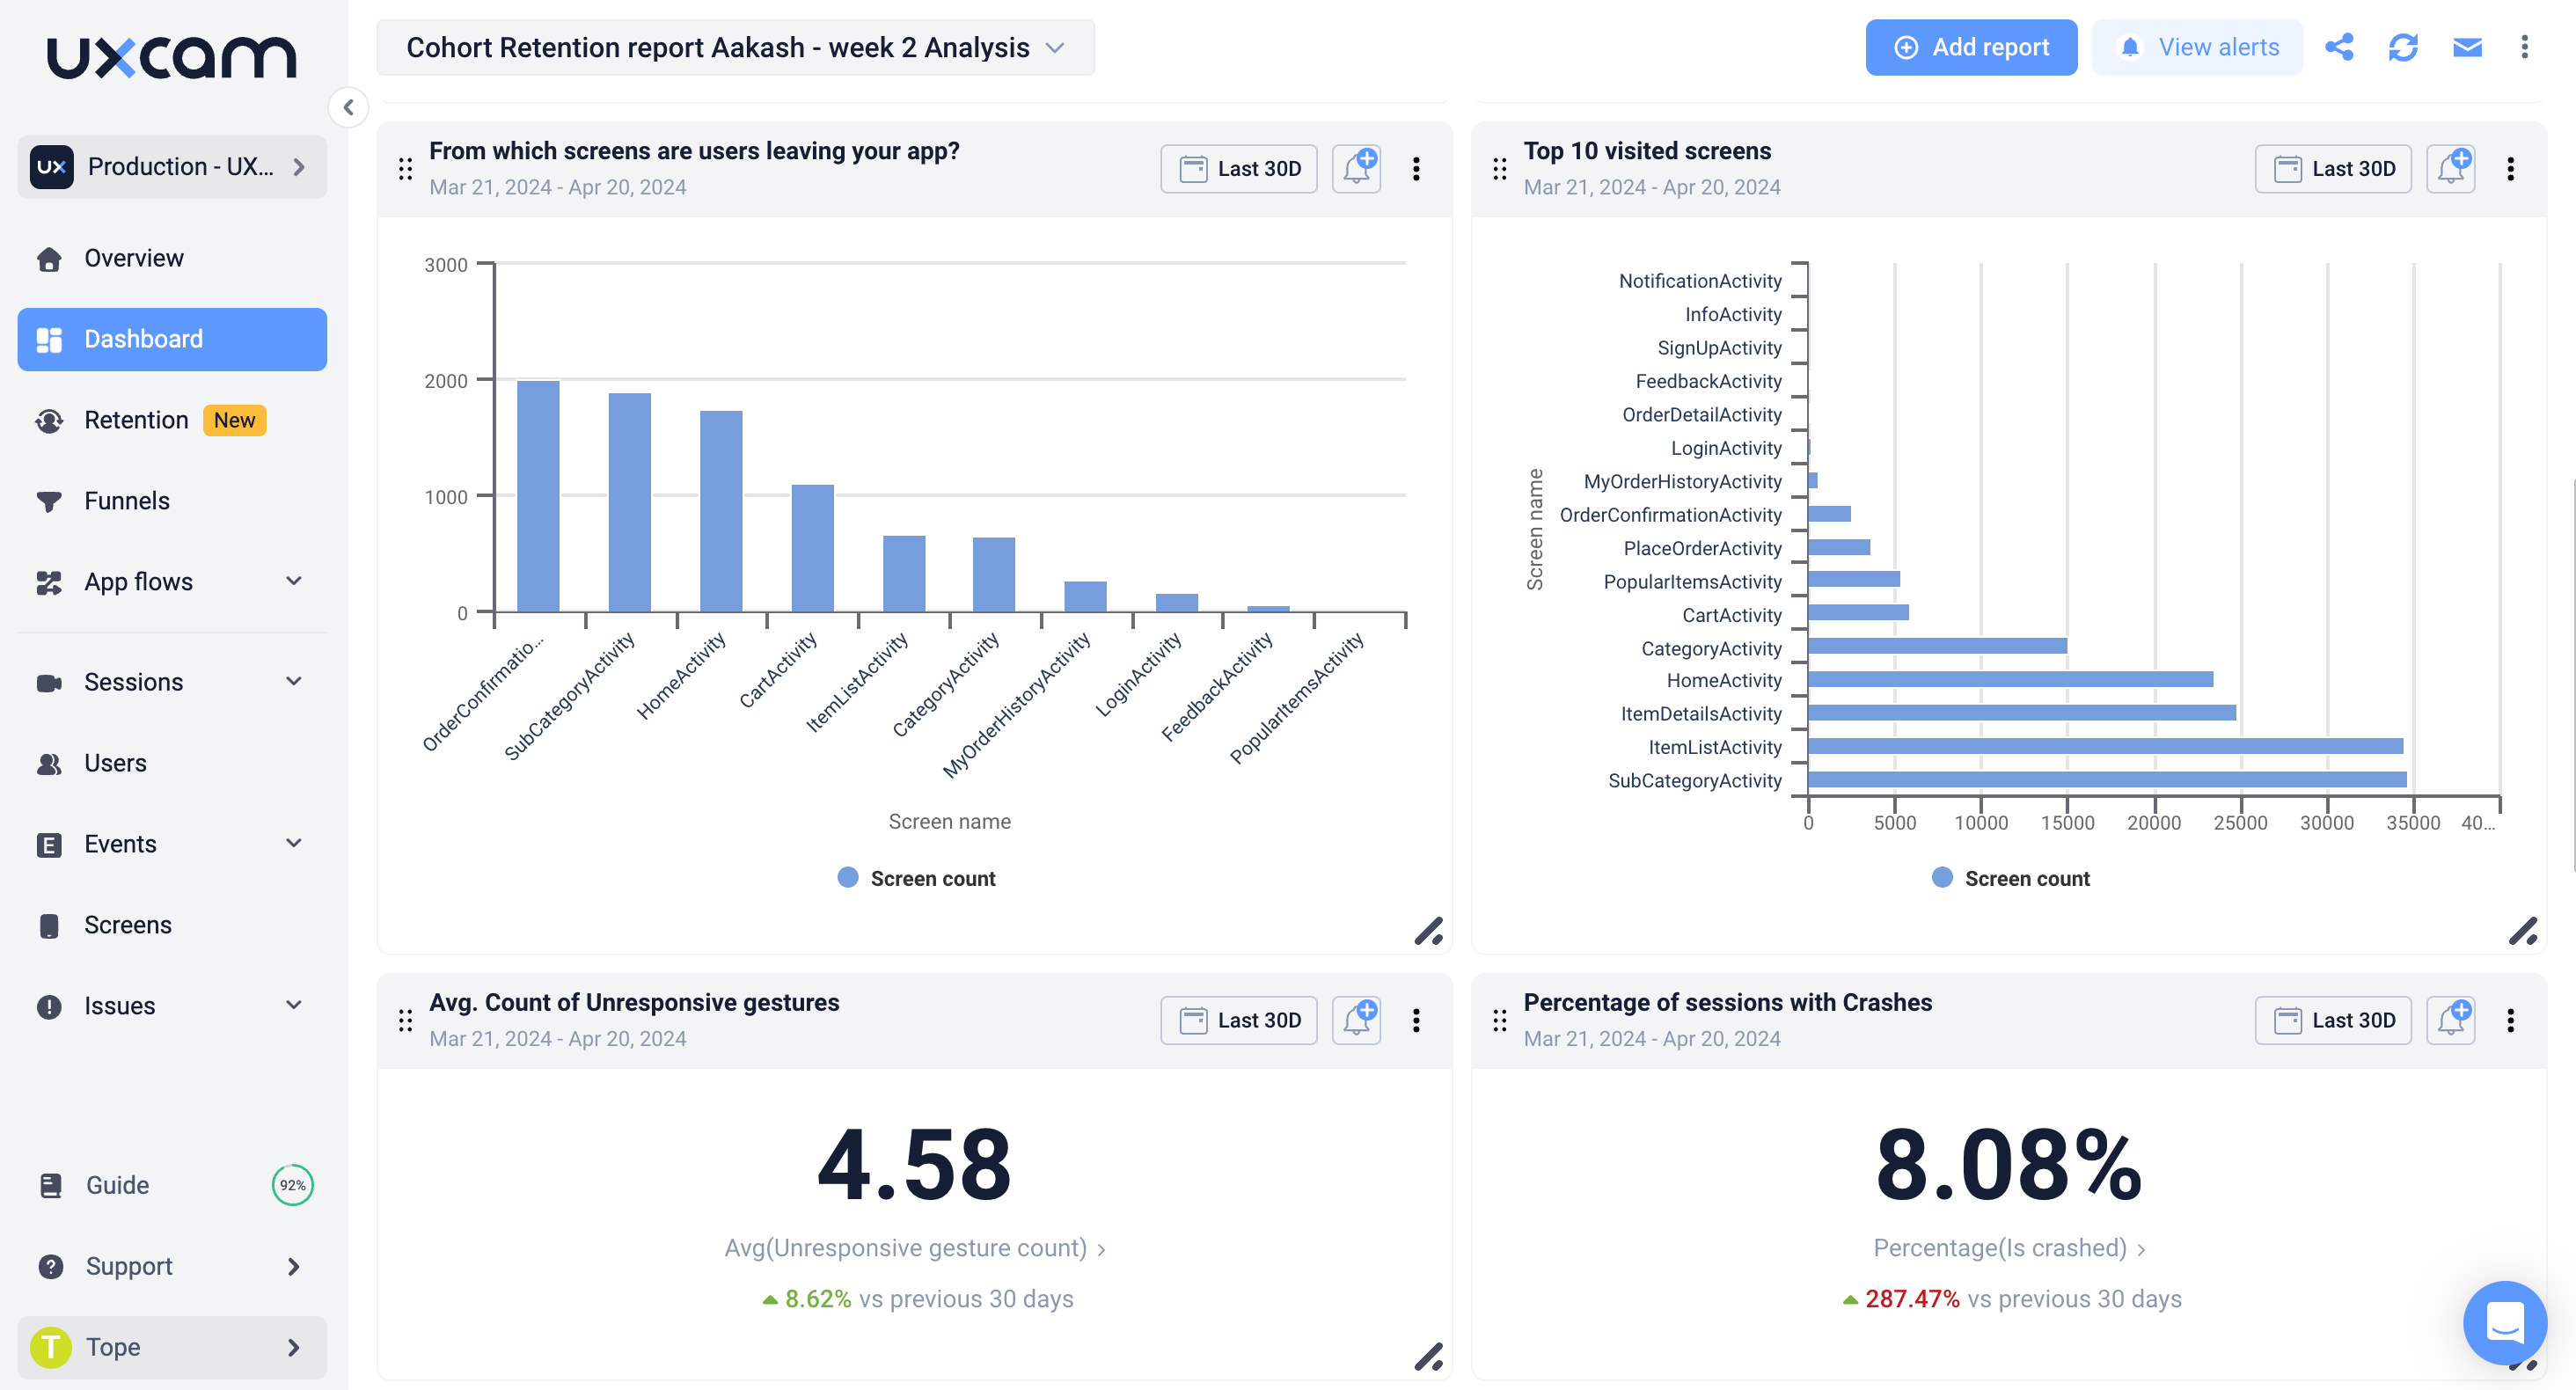
Start by building a customized dashboards that showcases key metrics across versions. Include your KPIs such as user engagement, retention rates, crash frequency, and feature adoption. This visual representation allows stakeholders to quickly grasp performance trends.
Use UXCam's custom dashboard feature to create tailored views for different stakeholder groups. Your CEO might want a high-level overview, while your engineering lead needs detailed performance metrics. Customize each dashboard to speak directly to its audience.
Incorporate before-and-after comparisons for major updates. This clearly demonstrates the impact of your changes and justifies development efforts. UXCam's version comparison tool makes this process seamless.

Aligning version performance with business KPIs
Connect your app metrics directly to business outcomes. If your company aims to increase revenue, highlight how version updates have impacted in-app purchases or subscription rates.
Use funnel analysis to show how version changes affect key conversion paths. This directly links your app's performance to business goals like user acquisition or retention. UXCam's funnel comparison feature makes it easy to visualize these impacts across versions.
Don't shy away from showcasing user feedback alongside quantitative data. UXCam's session replay feature provides powerful anecdotal evidence to support your metrics. A short video of a user struggling with an old feature versus smoothly using the updated version can be incredibly persuasive.
The goal is to tell a story with your data. Use these dashboards and alignments to paint a clear picture of how each version update drives the business forward.
7. Automate version performance monitoring
Automation is key to staying on top of your app's performance across versions. Here's how to set it up effectively:
Set up alerts for performance anomalies
Start by identifying your critical metrics. These might include crash rates, user engagement times, or conversion rates at key funnels. Use UXCam's custom alert feature to set thresholds for these metrics.
Configure alerts for sudden spikes or drops in these key performance indicators. For example, set an alert if your crash rate increases by 20% after a new version release. This allows you to catch and address issues quickly before they impact a large number of users.
Don't forget to set up alerts for positive changes too. If a new feature is seeing unexpectedly high adoption rates, you'll want to know so you can capitalize on its success.
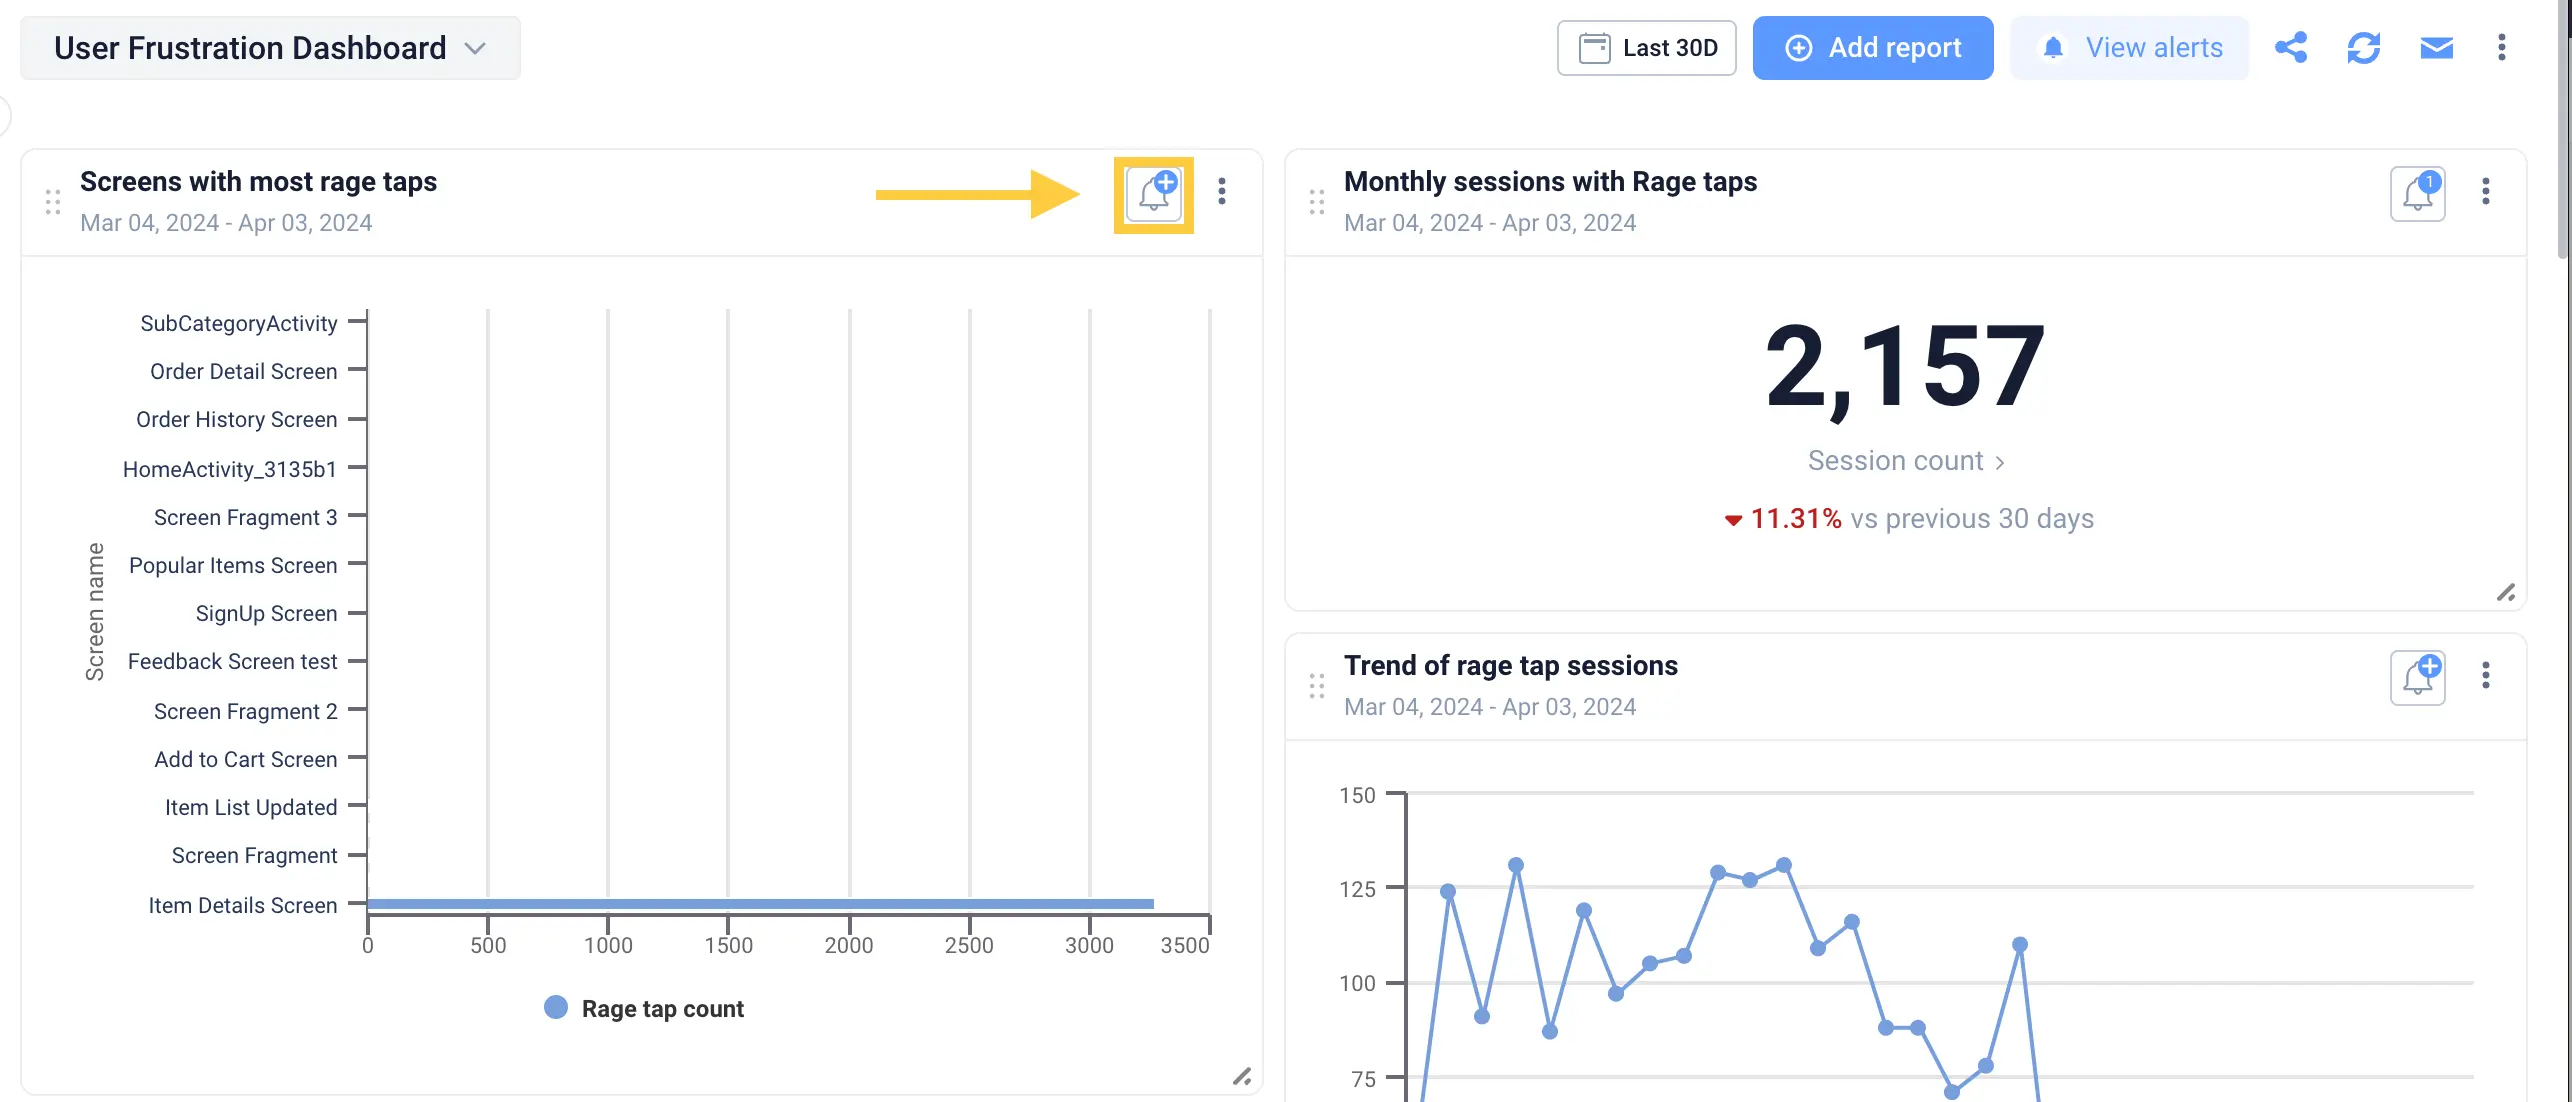
Automated reporting for version comparison
Implement automated weekly or bi-weekly reports that compare performance across your active app versions. UXCam's dashboards make this easy to set up and customize.
Include key metrics like user retention, session length, and feature adoption rates in these reports. This gives you a regular pulse check on how your latest version is performing compared to previous ones.
In a similar way, you can set funnel comparison and cohort analysis dashboard to automatically track how user flows are changing between versions and segments. This helps you quickly identify if a new update has inadvertently created friction in critical user journeys.
By automating your version performance monitoring, you free up time to focus on analyzing insights and planning improvements. You'll catch issues faster, capitalize on successes quicker, and maintain a more stable, high-performing app across all versions.
Conclusion
By adopting a data-driven approach to app versioning, you can ensure that each update you release is a step forward, informed by real user interaction data and performance metrics. This method not only helps you create a better user experience but also gives you the edge in a competitive market by making informed decisions that drive success.
Ready to take your app versioning to the next level? Sign up for a free trial of UXCam today and start leveraging powerful analytics to make smarter, data-driven decisions for your app's future.
You might also be interested in these;
How to measure mobile app performance
Flutter Performance monitoring - Best tools and techniques
How to improve mobile app performance
8 KPIs CPOs should measure to improve app performance
React Native performance monitoring - Best tools & technique
AUTHOR

Tope Longe
Product Analytics Expert
Ardent technophile exploring the world of mobile app product management at UXCam.
What’s UXCam?
Related articles
Tool Comparisons
Smartlook vs UXCam: Which is the better mobile app analytics solution for modern teams?
Detailed comparison of Smartlook and UXCam for React Native, Flutter, iOS, and Android apps. See SDK differences, session replay quality, and why UXCam is the stronger choice for mobile...

Begüm Aykut
Growth Marketing Manager
App Analytics
Mobile App Tracking: Practical Guide & Best Tools [2026]
The best tracking tools for mobile...

Jonas Kurzweg
Product Analytics Expert
Curated List
Top 19 Mobile App Analytics Tools in 2026
Discover the top mobile analytics tools in 2026. Compare features, pricing, and reviews to choose the right platform for app tracking, behavioral insights, and data-driven...

Jonas Kurzweg
Product Analytics Expert

