Mixpanel vs Amplitude vs Smartlook vs UXCam: 2025 Comparison

TABLE OF CONTENTS
The key to building a successful mobile app is using user engagement data to guide your design & development decisions.
But what is the best mobile app analytics platform for 2023? What should businesses look for in the perfect analytics tool? How do the leading analytics platforms compare with each other?
In this article, we will compare Mixpanel, Amplitude, Smartlook and UXCam and review the industry’s top analytics tools. We’ll compare the features, pricing, and overall value proposition of each tool to determine which you should use to analyze the UX of your mobile app.
UXCam vs Mixpanel vs Amplitude vs Smartlook: Feature Comparison
Here's an overview of how the most popular mobile app analytics platform compare:
| Features | UXCam | Mixpanel | Amplitude | Smartlook |
|---|---|---|---|---|
| Session Replays | ✓ | X | X | ✓ |
| User Analysis | ✓ | ✓ | ✓ | ✓ |
| Heatmap Analytics | ✓ | X | X | ✓ |
| Funnel Analytics | ✓ | ✓ | ✓ | ✓ |
| Autocapture | ✓ | X | X | ✓ |
| Journey Analytics | ✓ | ✓ | ✓ | X |
| Customizable Dashboards | ✓ | ✓ | ✓ | X |
| Cohort Analysis | X | ✓ | ✓ | X |
UXCam, Mixpanel, Amplitude & Smartlook: Key Differences
Ease of Use: UXCam is the most accessible and easy-to-set-up mobile app analytics tool. Smartlook is similarly geared towards non-technical users. We find that both Mixpanel and Amplitude are more difficult to use, have more complex interfaces and generally take more time to set up.
Analytics Tools: UXCam is the market leader for product app analytics and provides the widest set of analytics features: including session recording, data reports, heatmaps and funnel analytics. Smartlook is the only other tool on this list that provides session recordings - whereas Amplitude and Mixpanel are focused entirely on quantitative analytics (i.e., stats and metrics) and don’t gather qualitative data.
In the following, we are going to look at the key features and pricing of each platform in detail.
What is Mixpanel?
Mixpanel is a powerful product analytics and user behavior platform that’s designed to help you convert, engage, and retain more customers.
This tool focuses on tracking how users engage with your product and who completes certain actions.
Mixpanel's Key Features
Feature 1: Interactive Reports


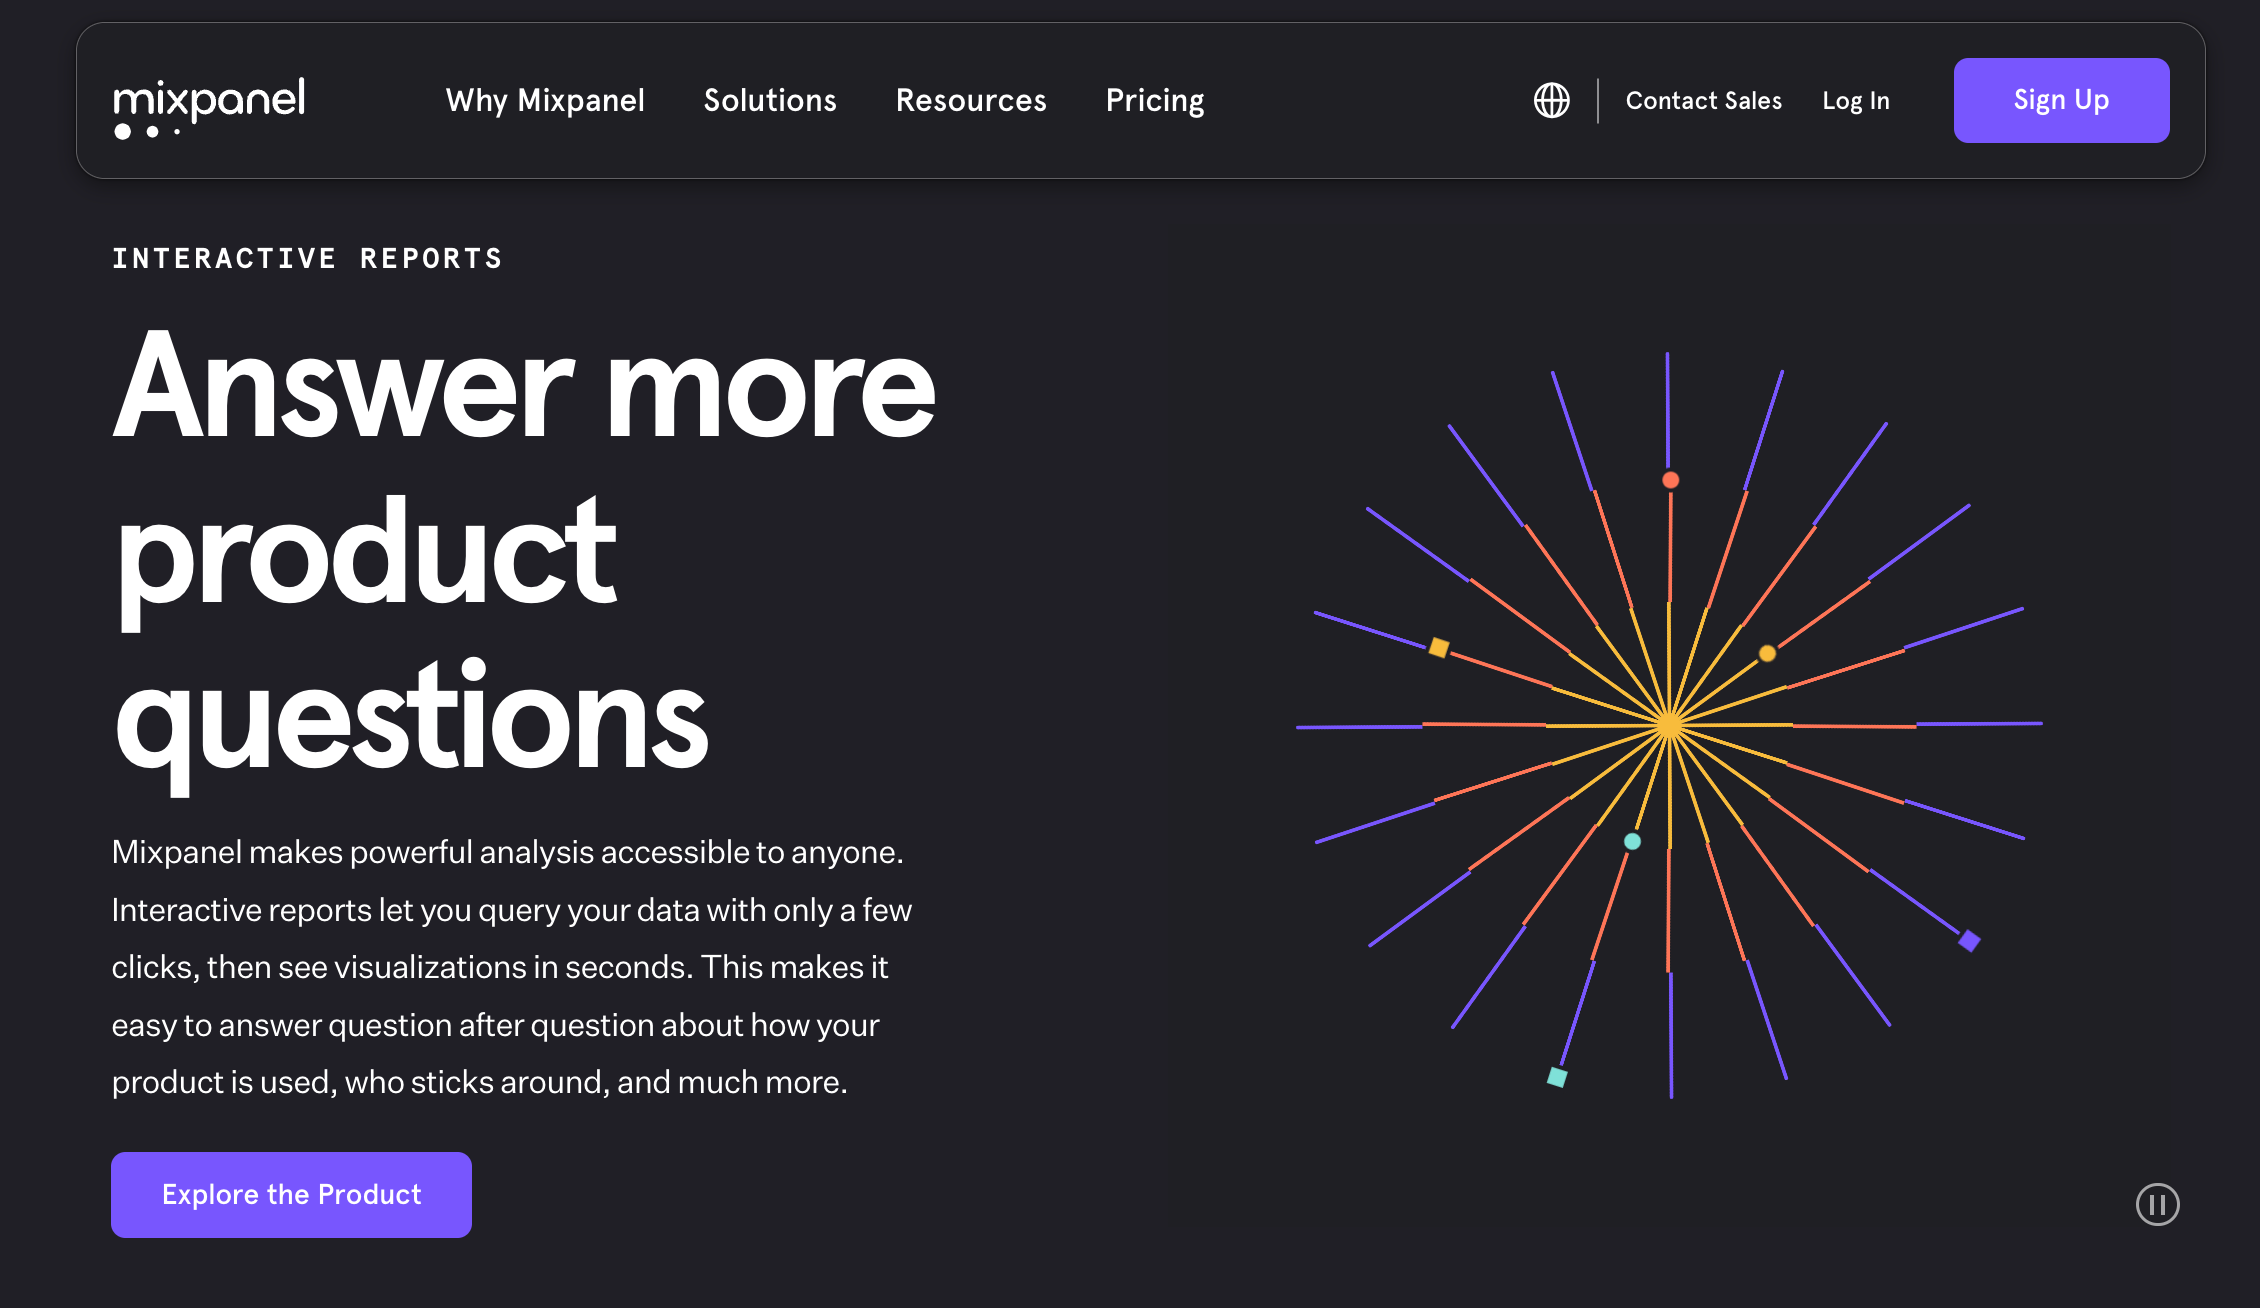
Mixpanel allows you to generate interactive reports based on your user engagement data. Within a few clicks, you can see beautiful visualizations of your data.


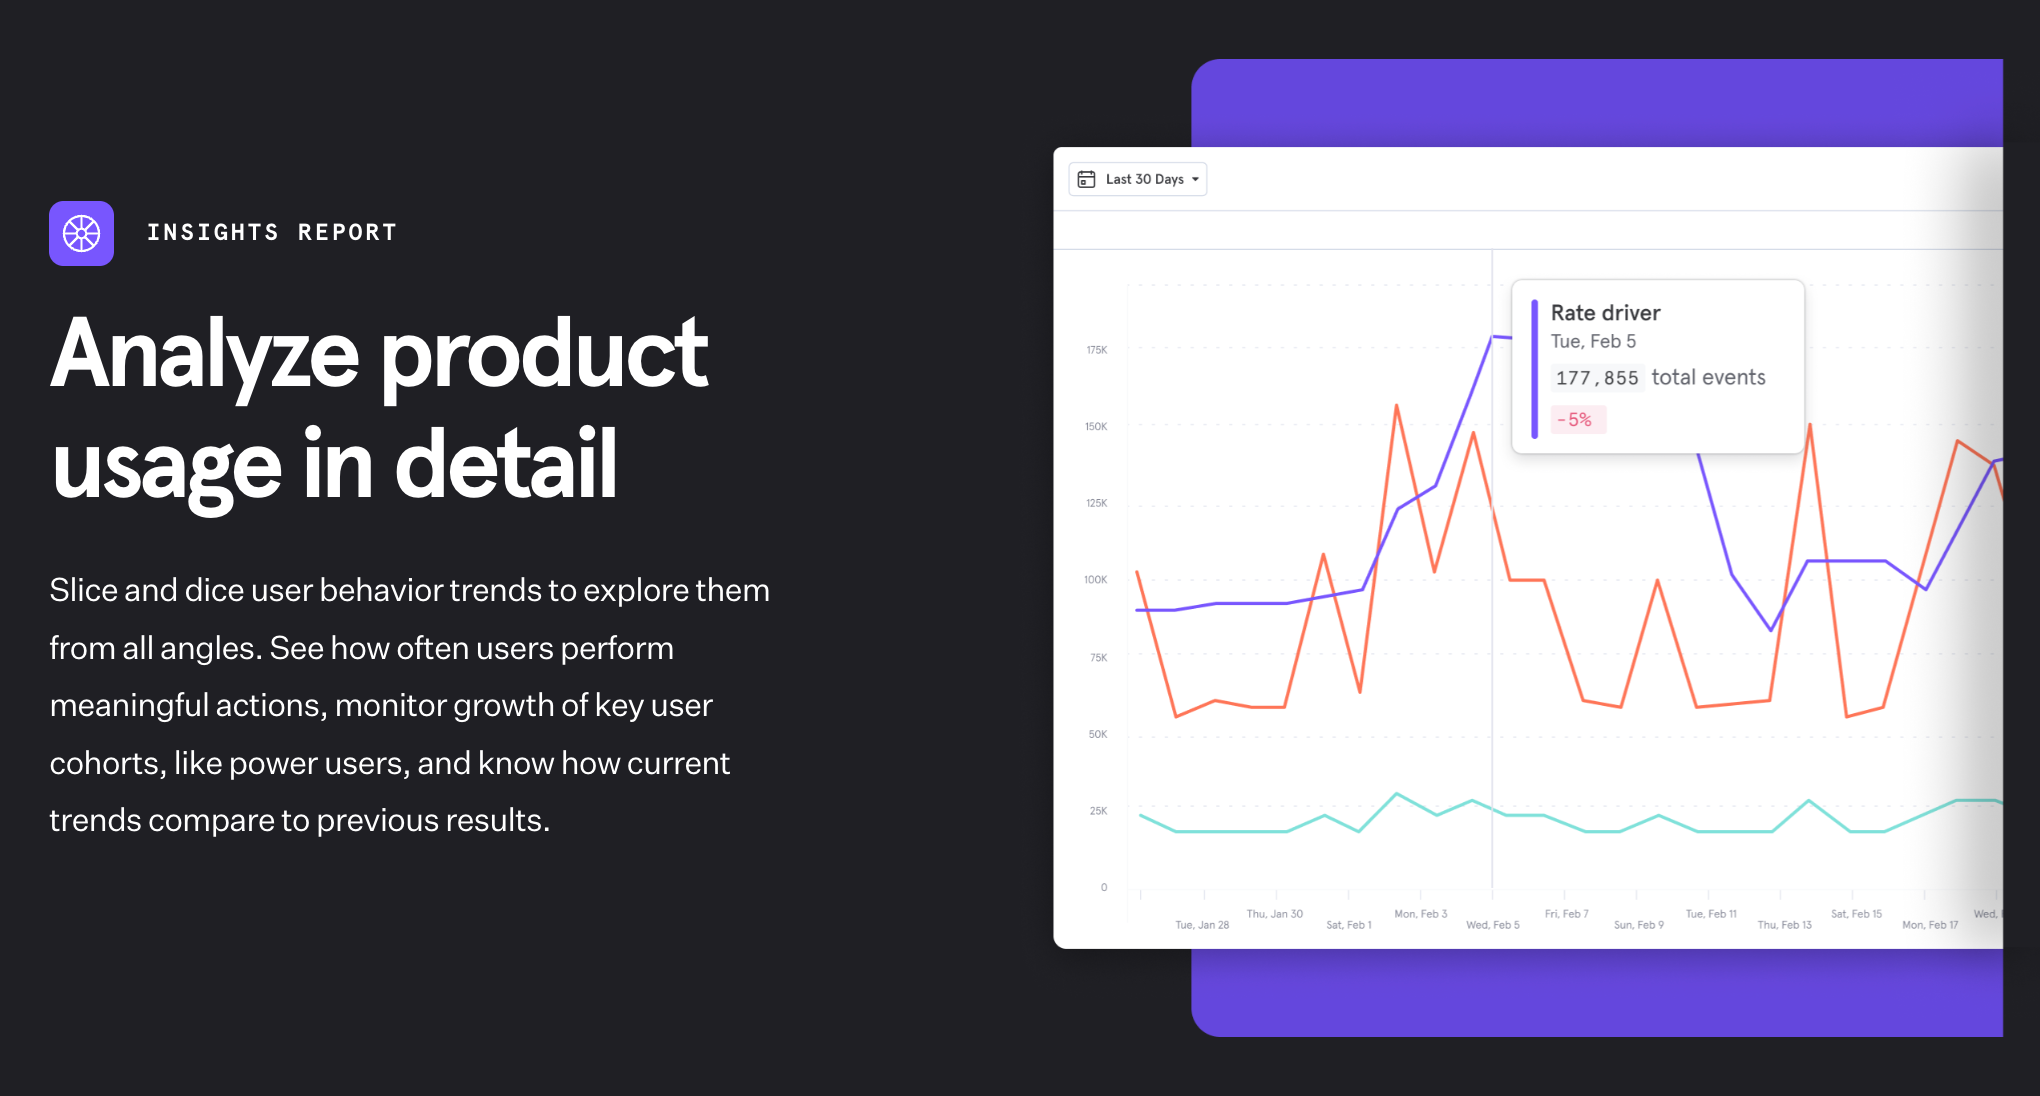
This makes it easy to make design and development decisions based on how your product is used, who sticks around, and much more.
Feature 2: Team Boards & Alerts


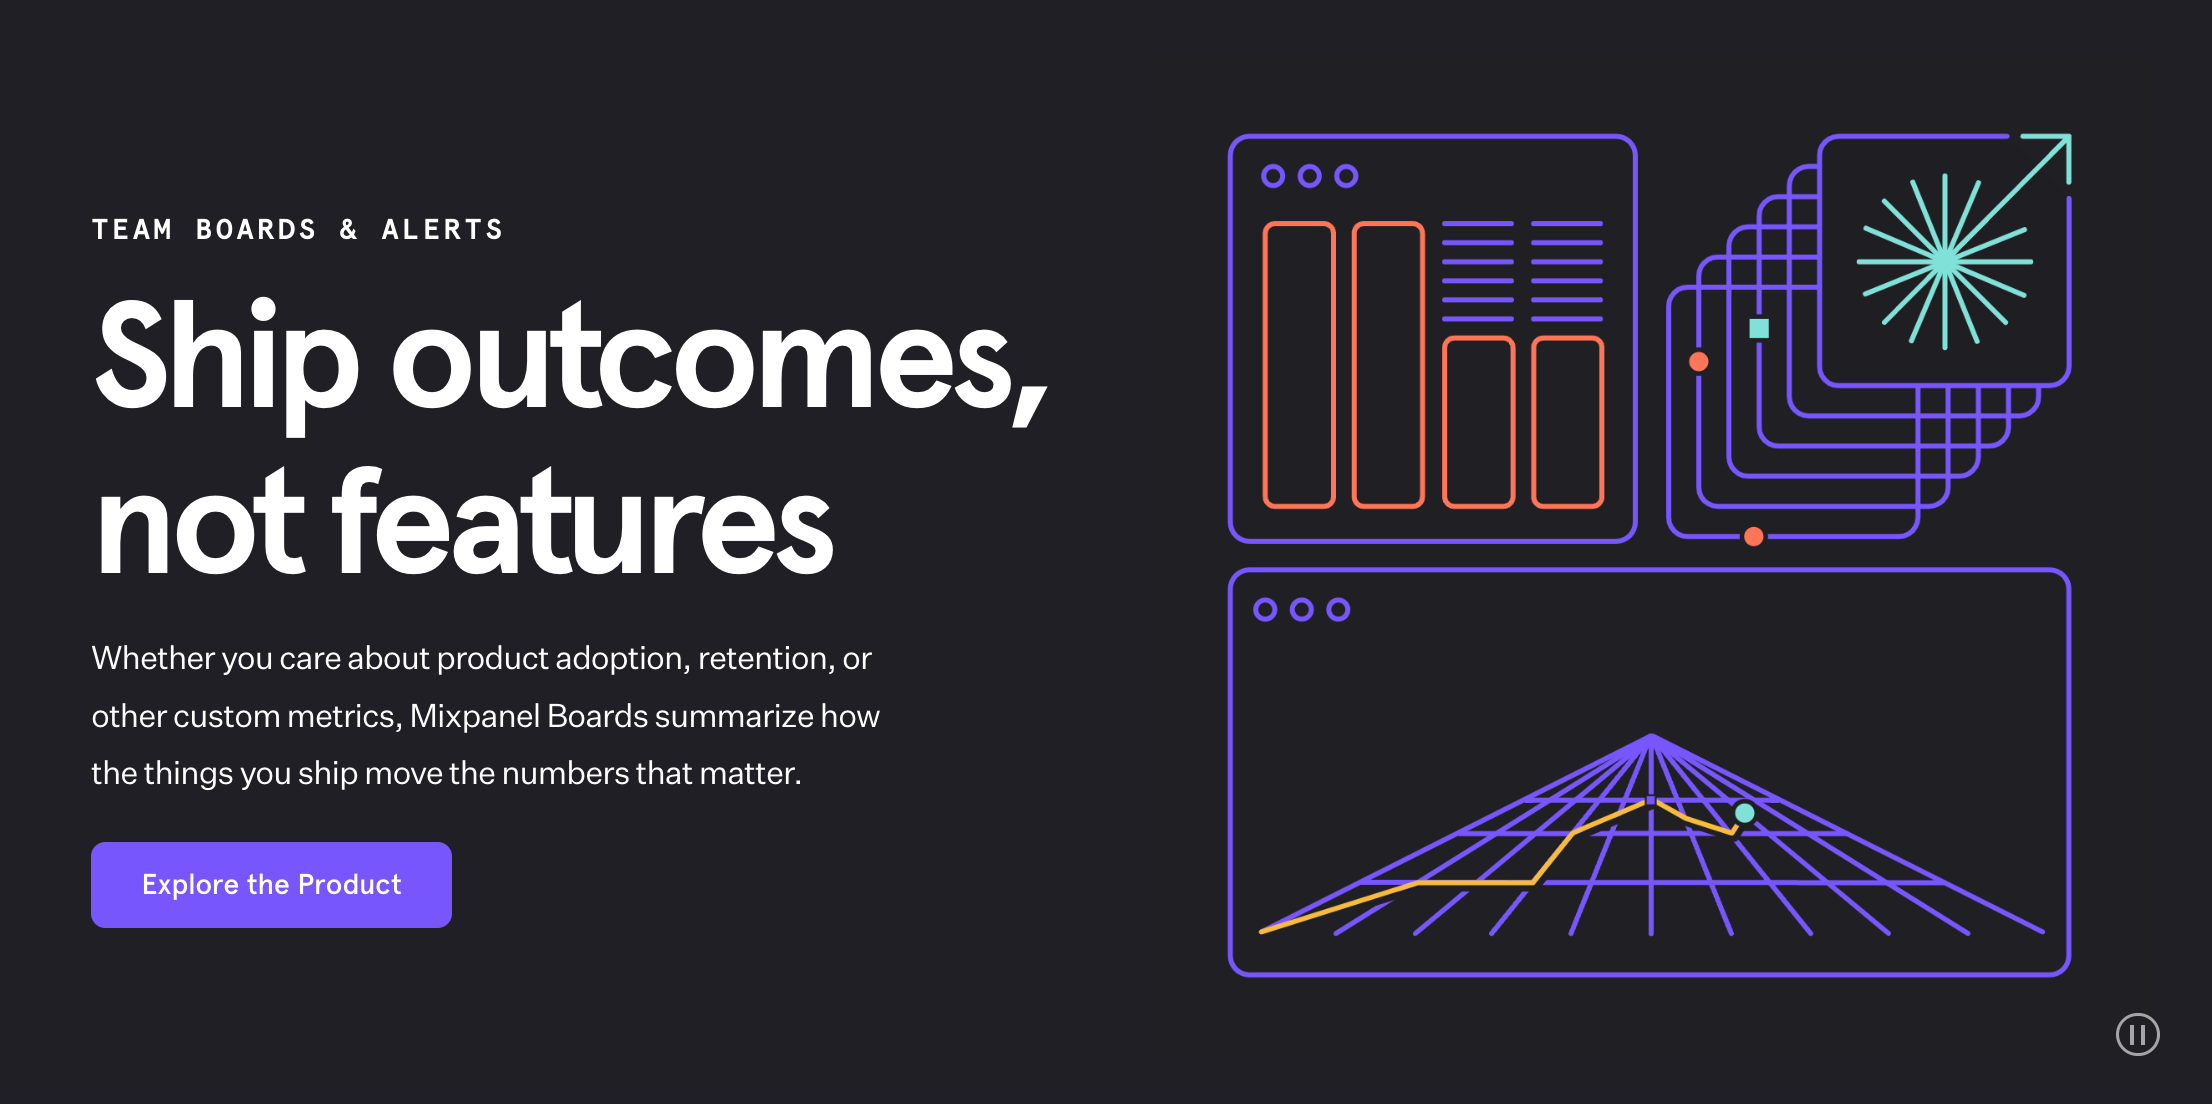
Mixpanel’s Team Boards & Alerts features help your product design and development teams instill analytics and user data into every decision.
Your teams can access a dashboard of analytics summaries, giving them insights into product adoption, retention, or essentially any other custom metric that you find important.
When metrics change, and targets slip, your team can receive automatic alerts - so they can stay ahead of the game and fix UX concerns quickly.
Feature 3: Limitless Segmentation


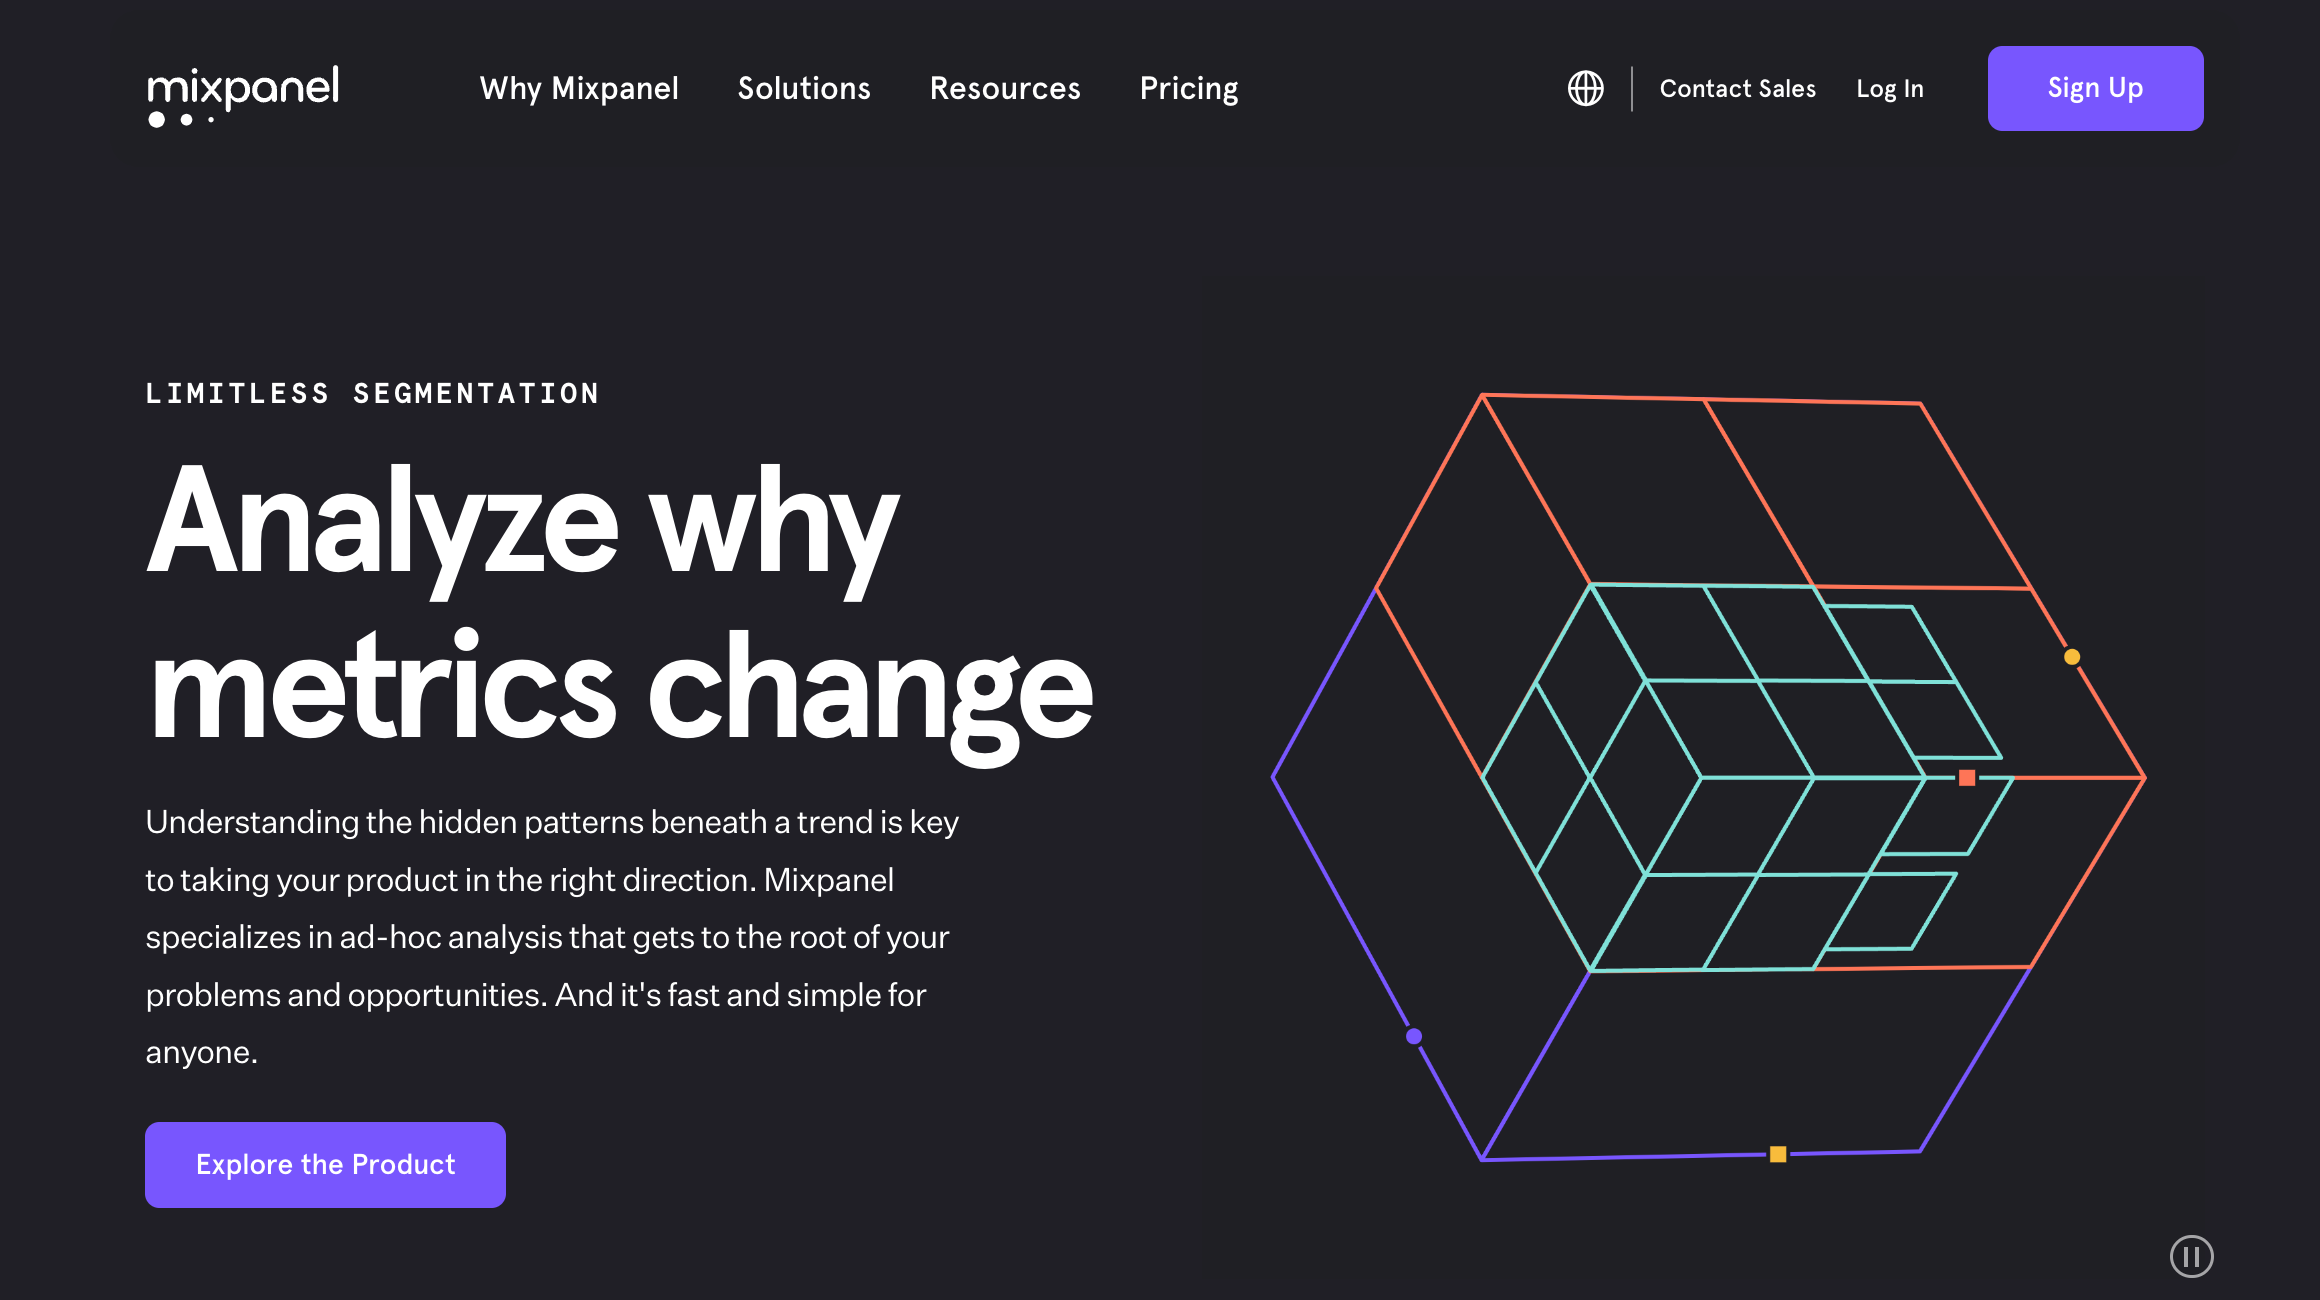
Understanding the hidden patterns beneath a trend is essential to take your product forward. Mixpanel can break down your data and reports using various filters - including events, device types, operating systems, locations, and more.


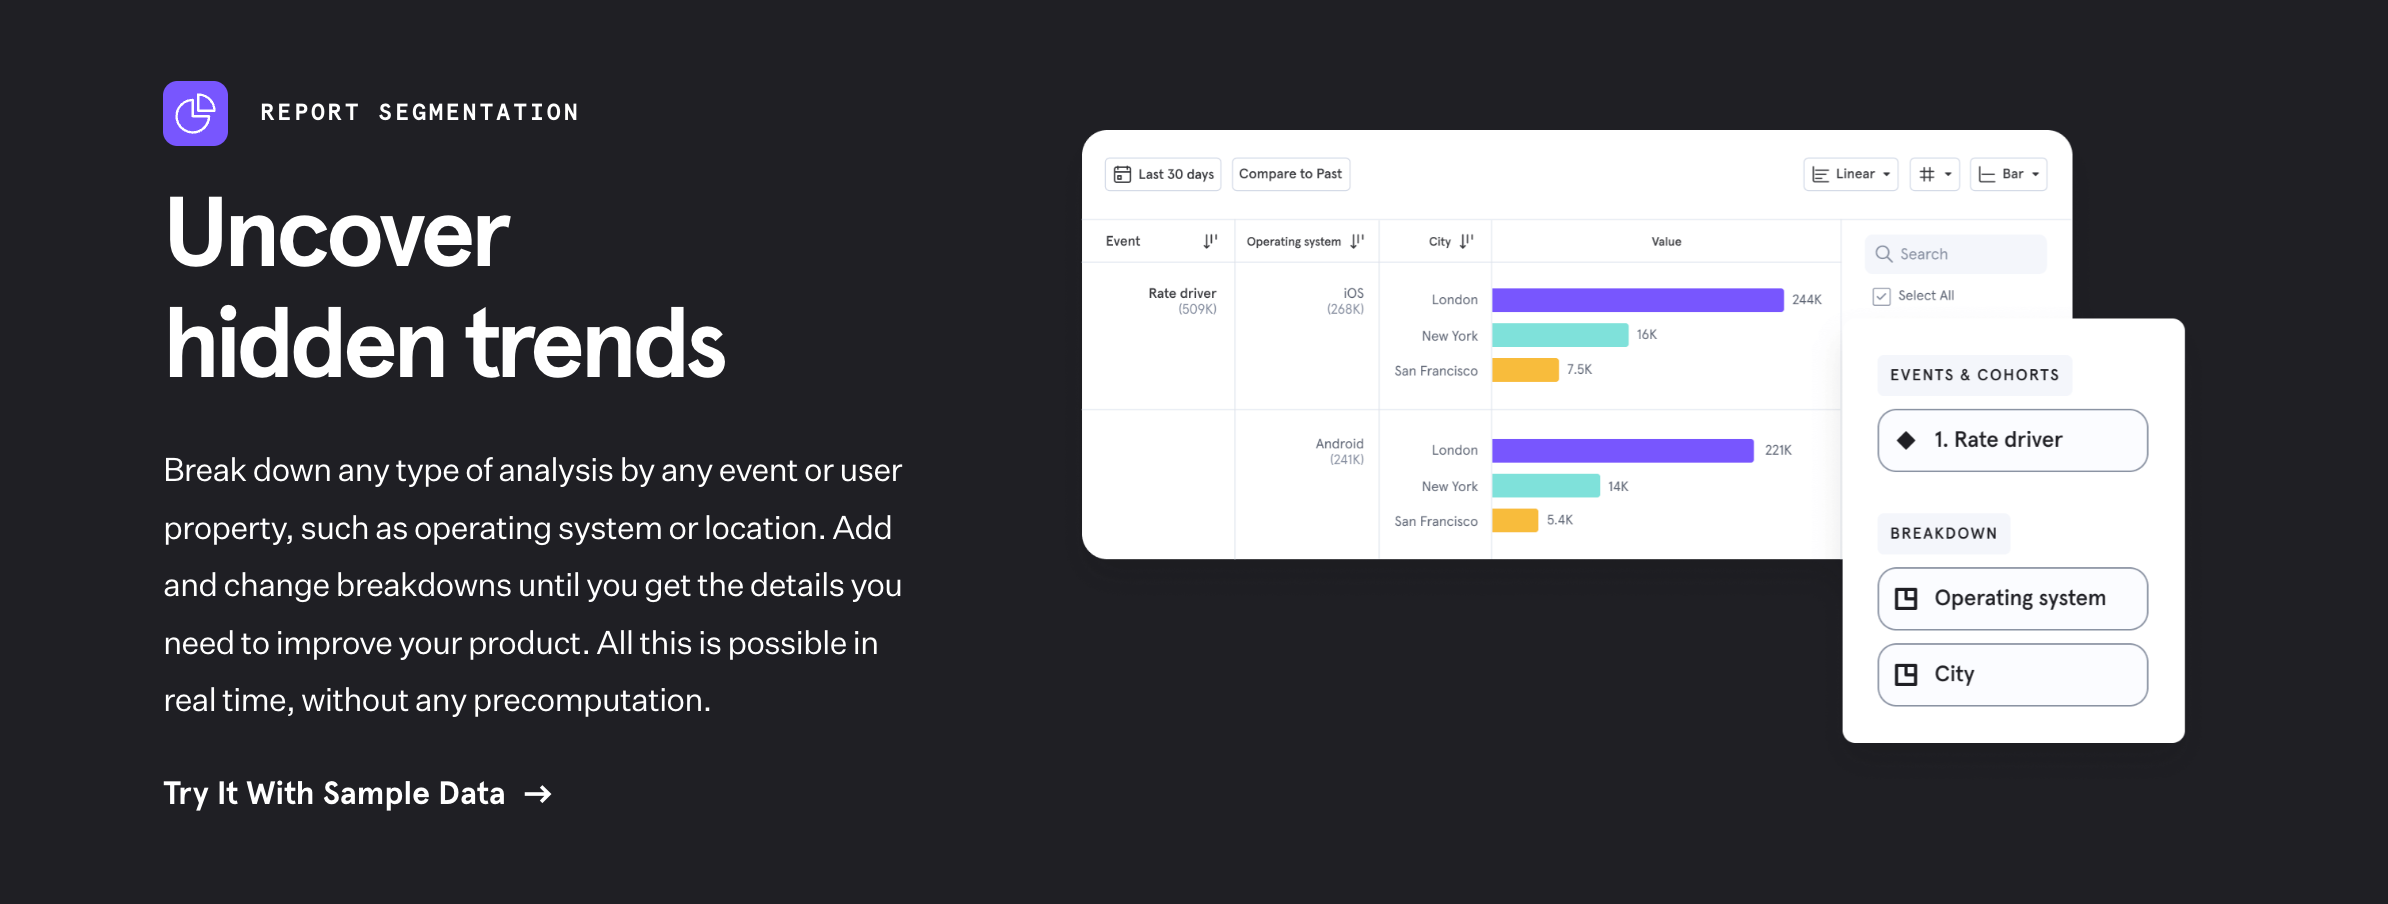
This helps you discover hidden patterns in your user experience and helps you get to the root of your problems, and find new opportunities for growth.
Mixpanel Pricing


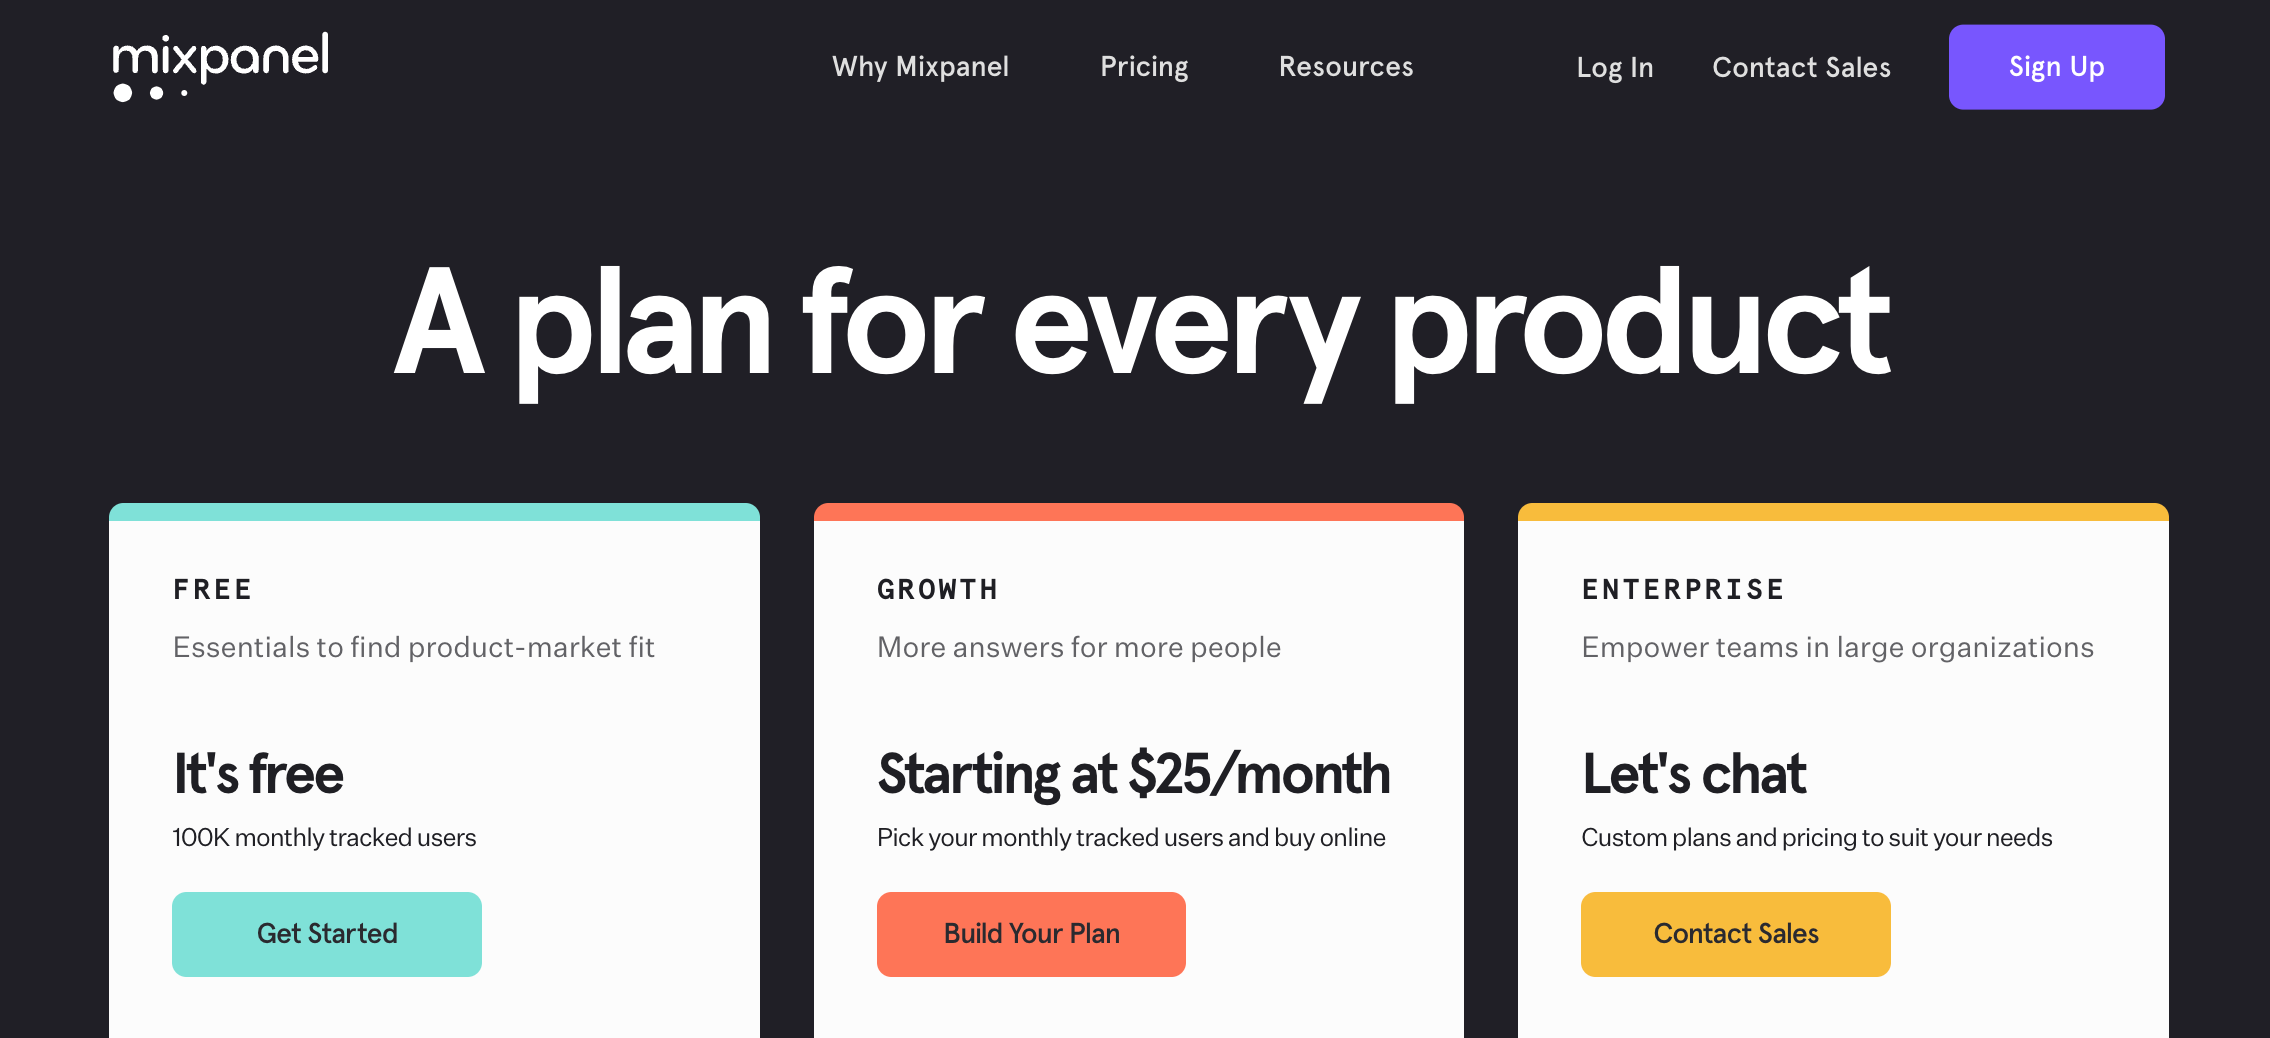
To get started with Mixpanel, you can try out the product with a Free tier. With this plan, you can track up to 100K monthly users and generate the core set of reports offered with this product.
If you need more user volume or want to begin data modeling, you can upgrade to the Growth plan. This also gives you Group Analytics, Data Pipelines add-ons, and email support.
The pricing is based on your monthly active tracked users. You can scale your plan up or down depending on this volume. If you have many users, the subscription prices can get quite expensive.
Pros and Cons
Pros
Generous free tier with plenty of data points and reports
Great data segmentation
Good data modeling tools in paid plans
Cons
No session replay feature
Complicated user interface
Expensive monthly subscription
What is Amplitude?


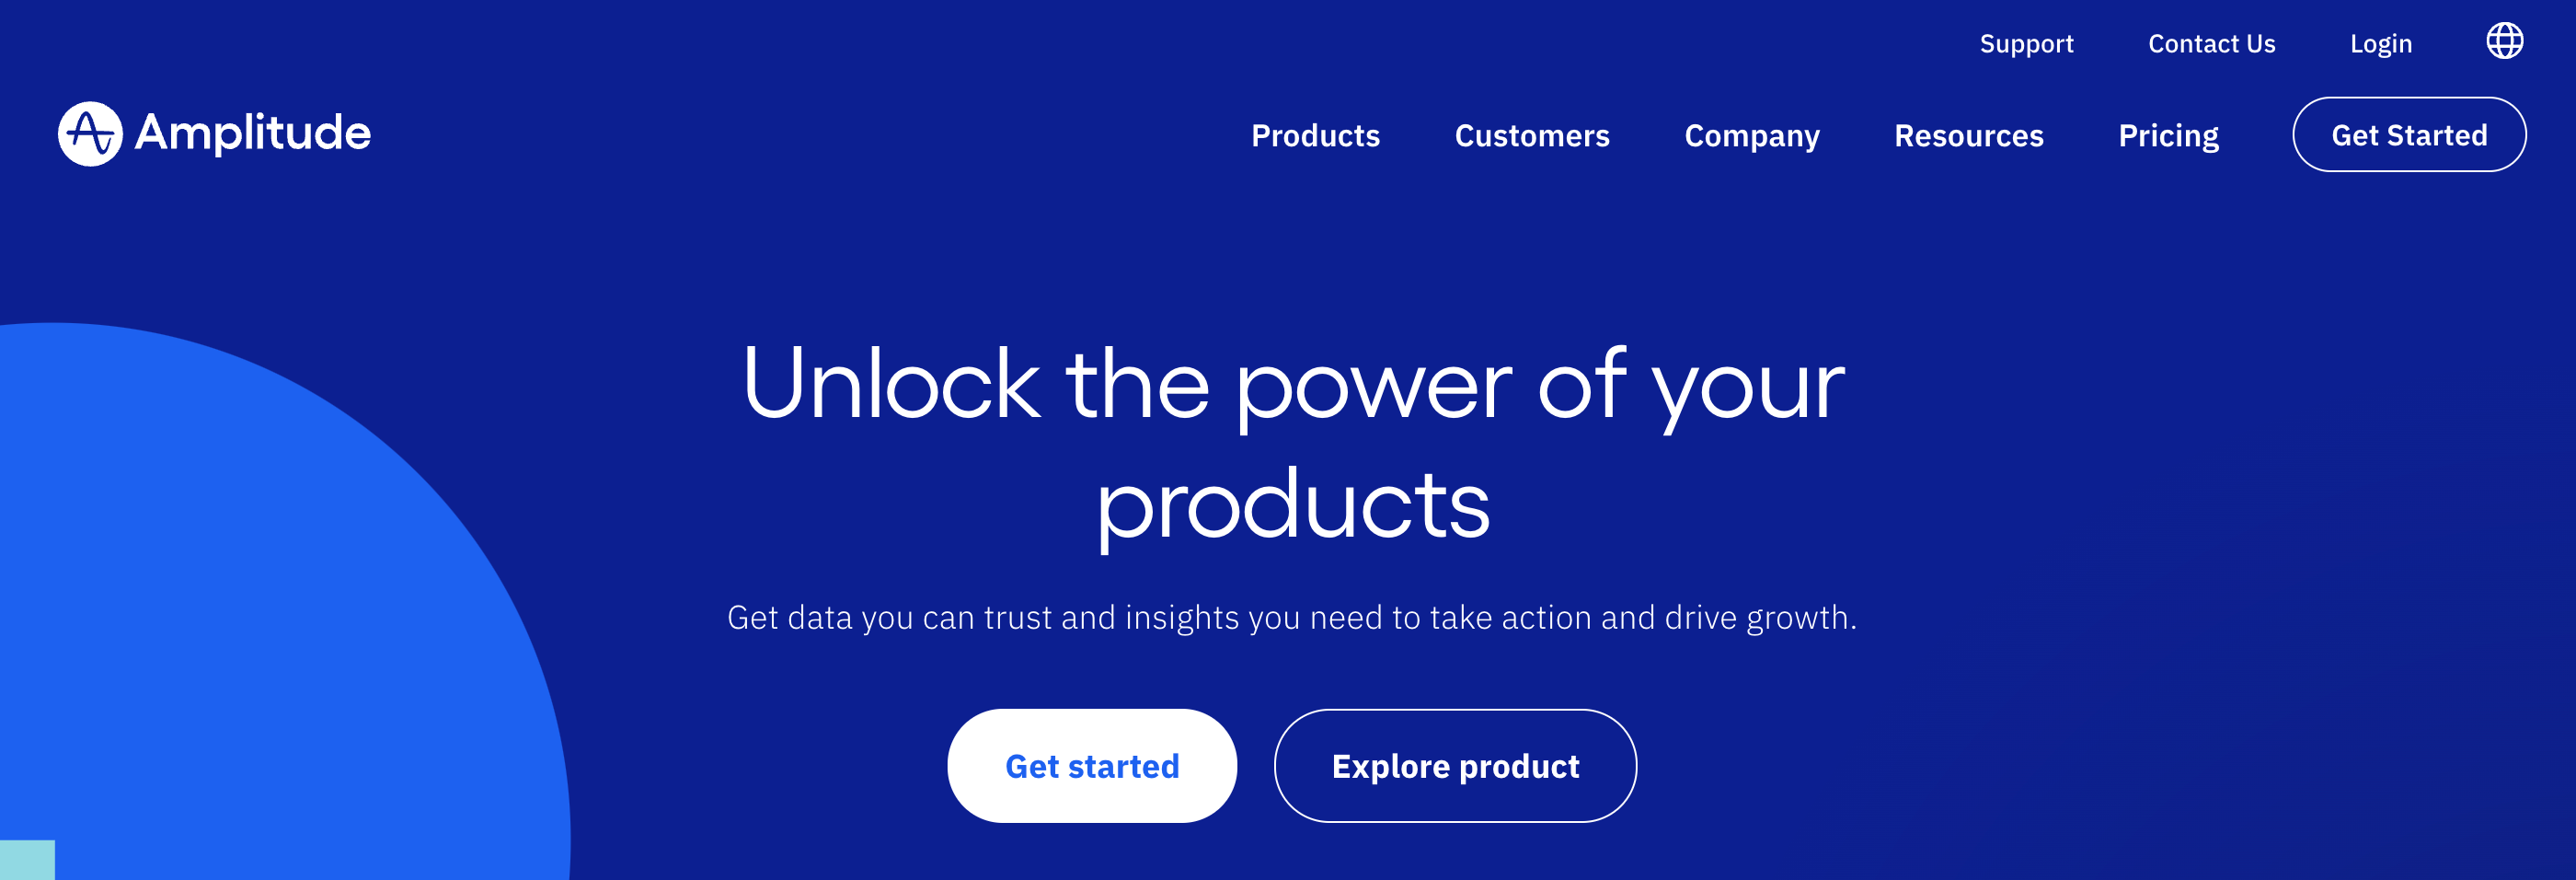
Amplitude is a product analytics platform that uses collaborative analytics to track visitors to mobile apps and websites.
It uses behavioral reports to understand users' interactions with products and provides insights into your users behavior. This will give you an idea on how to leverage their behavior in order to boost conversions, and increase engagement.
Ampltitude's Key Features
Feature 1: Amplitude Analytics


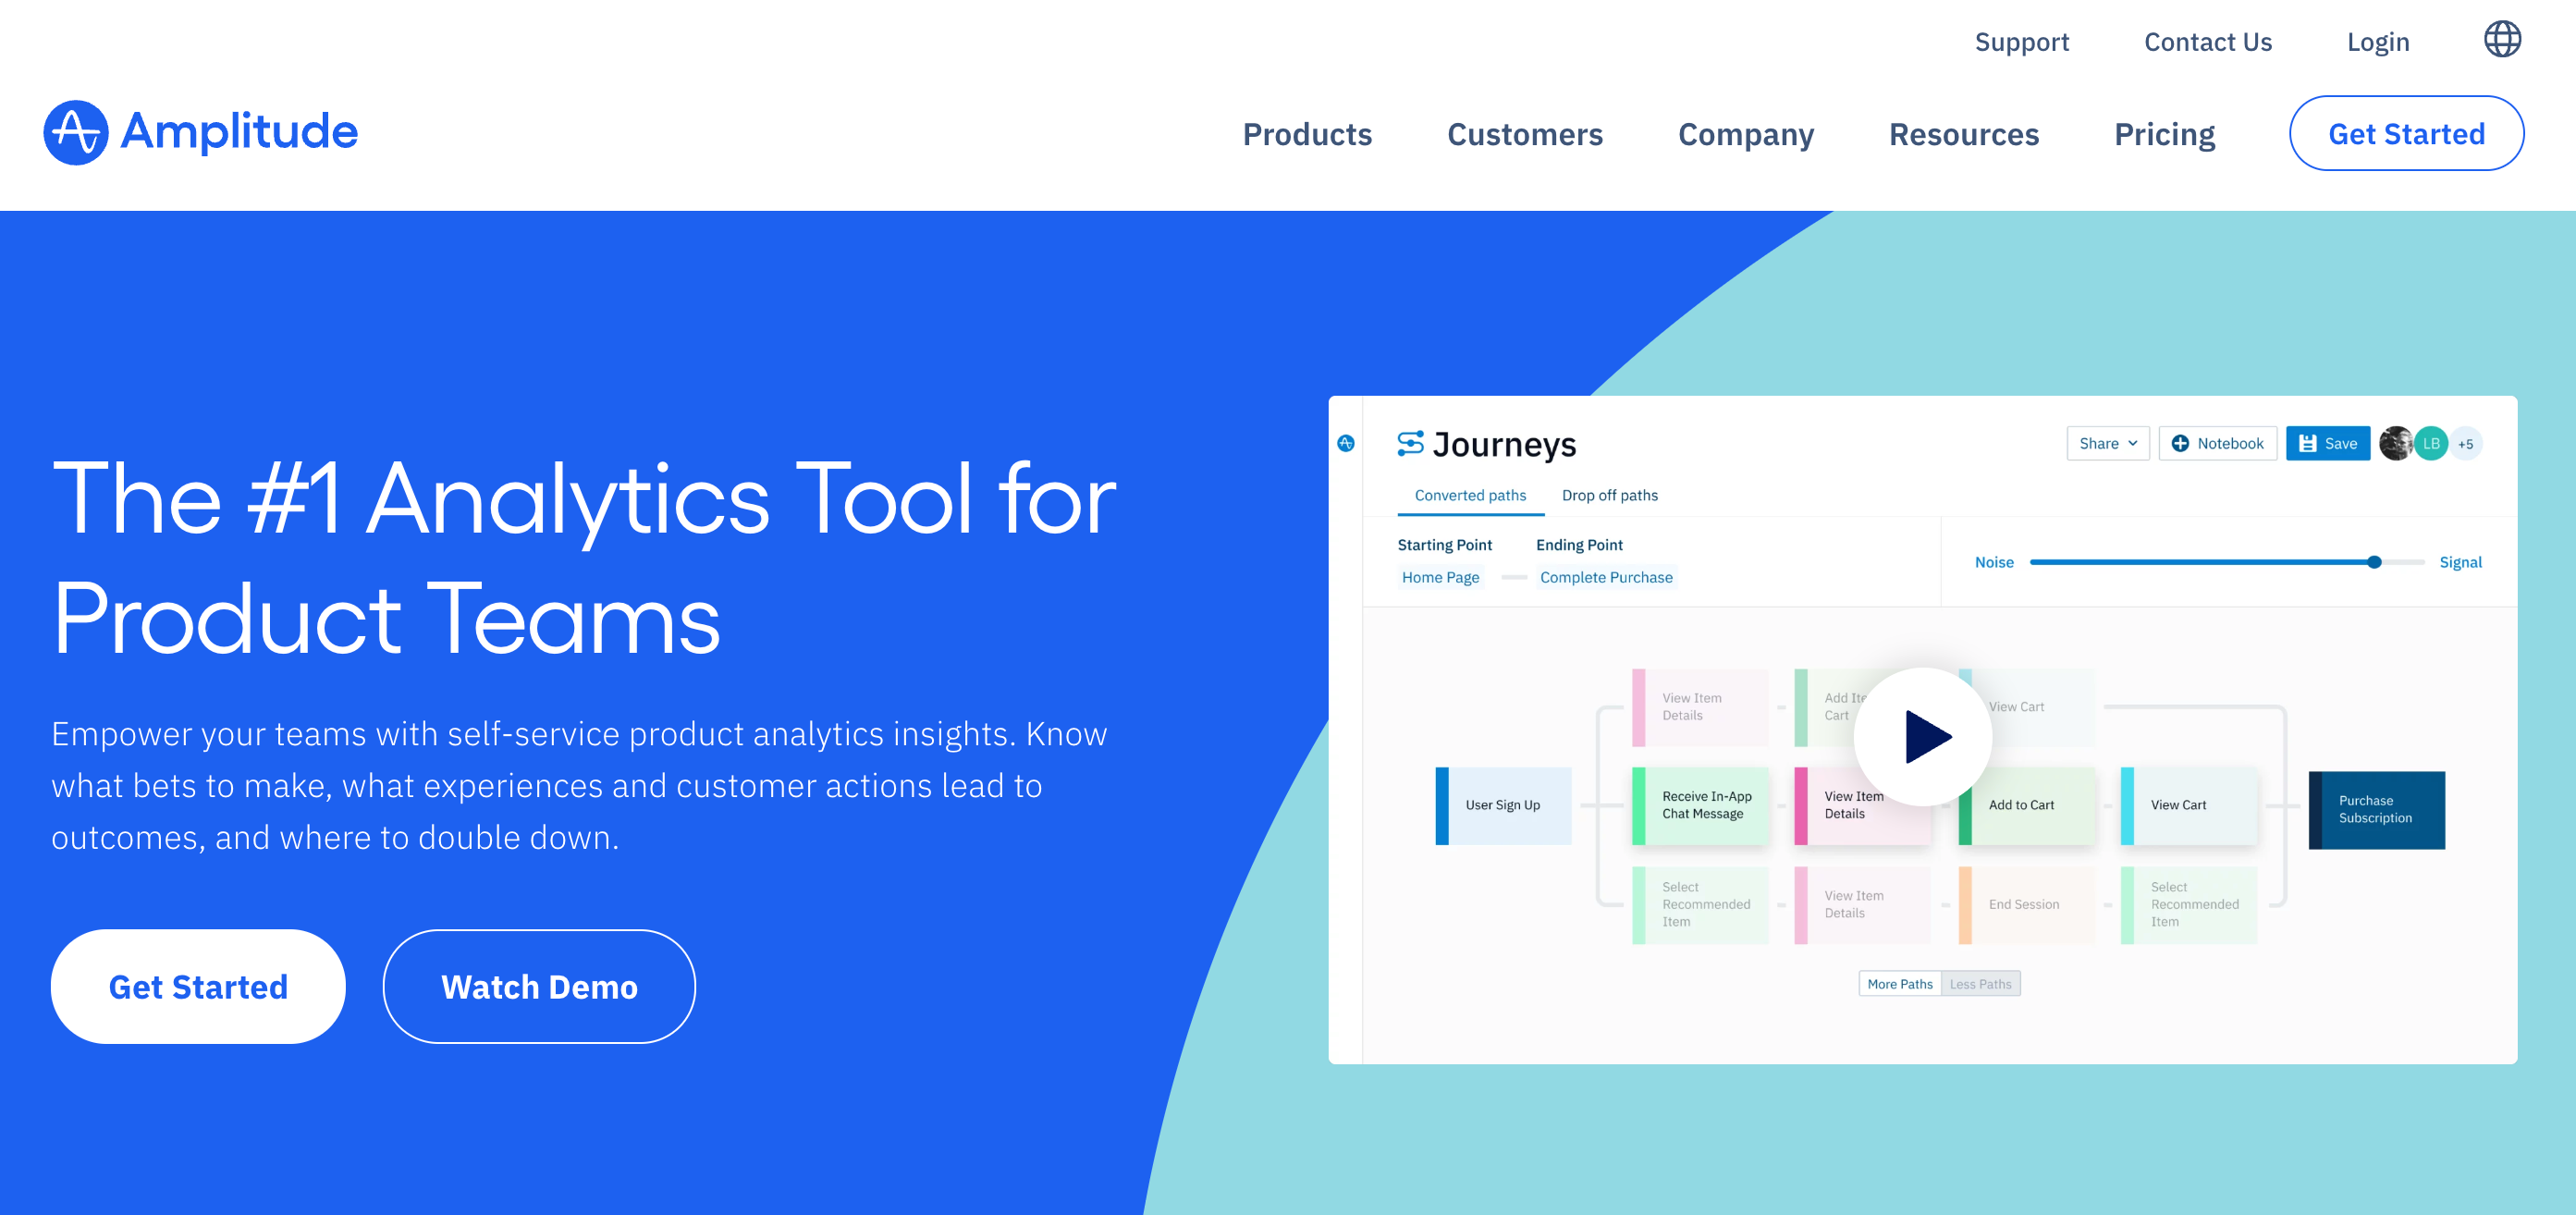
Amplitude provides businesses with a self-service analytics dashboard. It allows you to map and analyze how your users move around your app to unlock actionable insights about your UX.
This allows you to build digital products for better engagement, increased conversion, and improved customer loyalty.
Feature 2: Amplitude Experiment


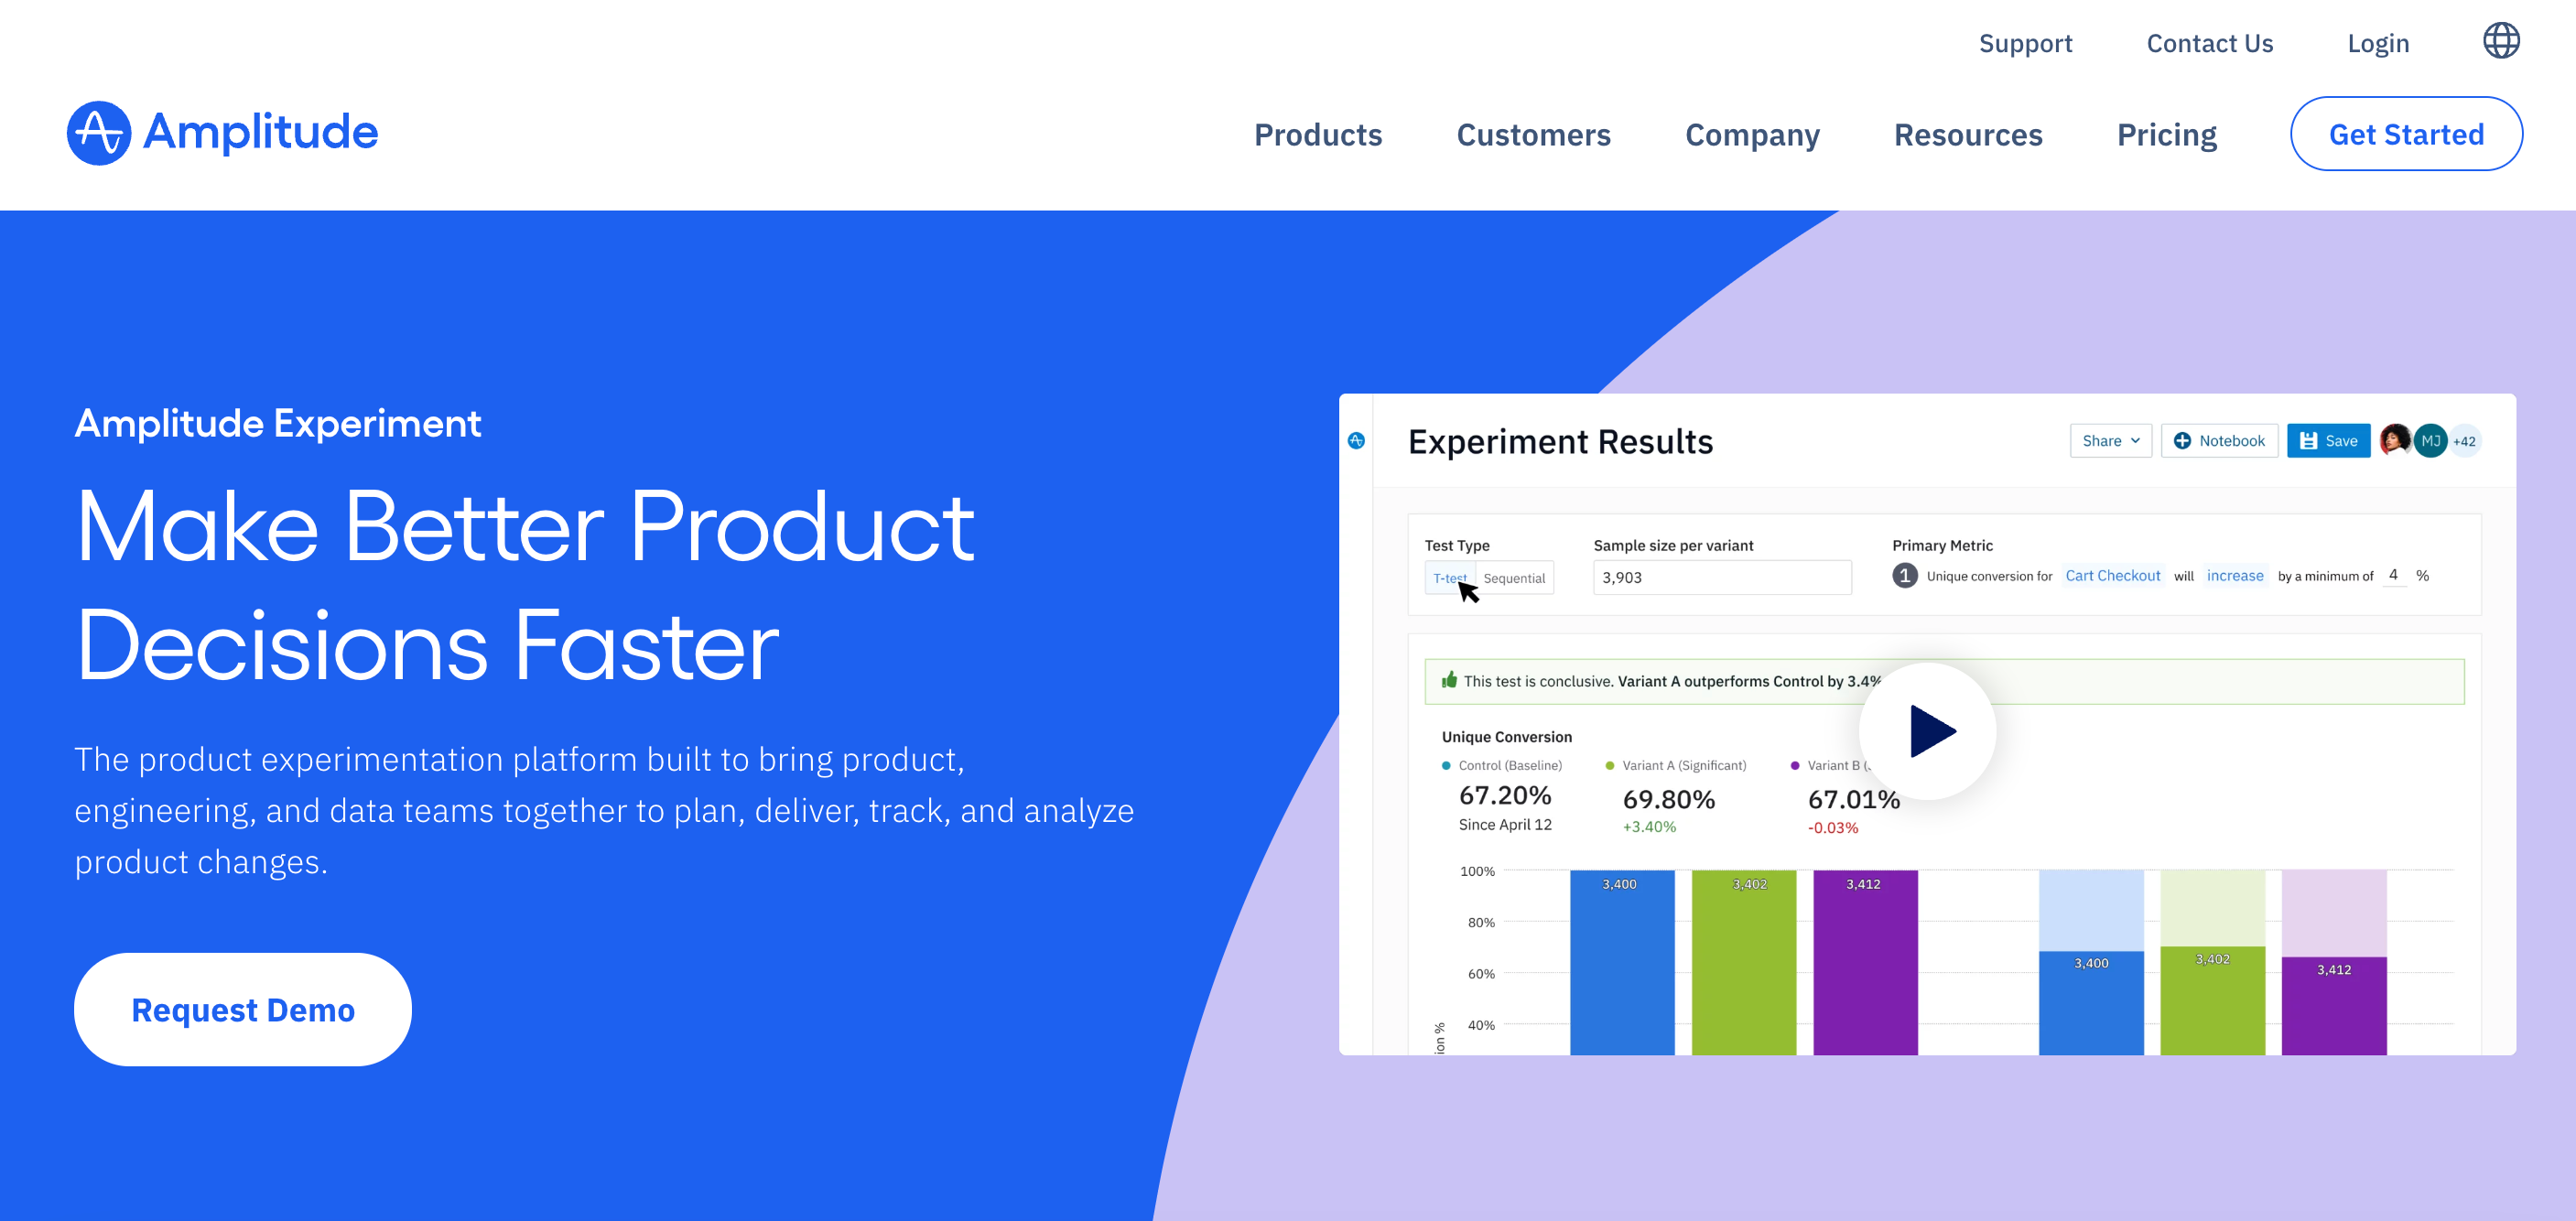
Amplitude’s product experimentation platform brings together a suite of tools that are designed to help you plan, track and analyze product changes and new features.
Within this platform, you can access:
A/B tests: Test changes with a subset of your users to find out what matters most to your customers
Feature flags: Manage release risk, configure user experiences, and deploy new features faster.
Behavioral data: Analyze the behavior of existing or potential customers to determine whom to target
Payloads: Make changes to your product to test new experiences without deploying extra code.
Amplitude Pricing


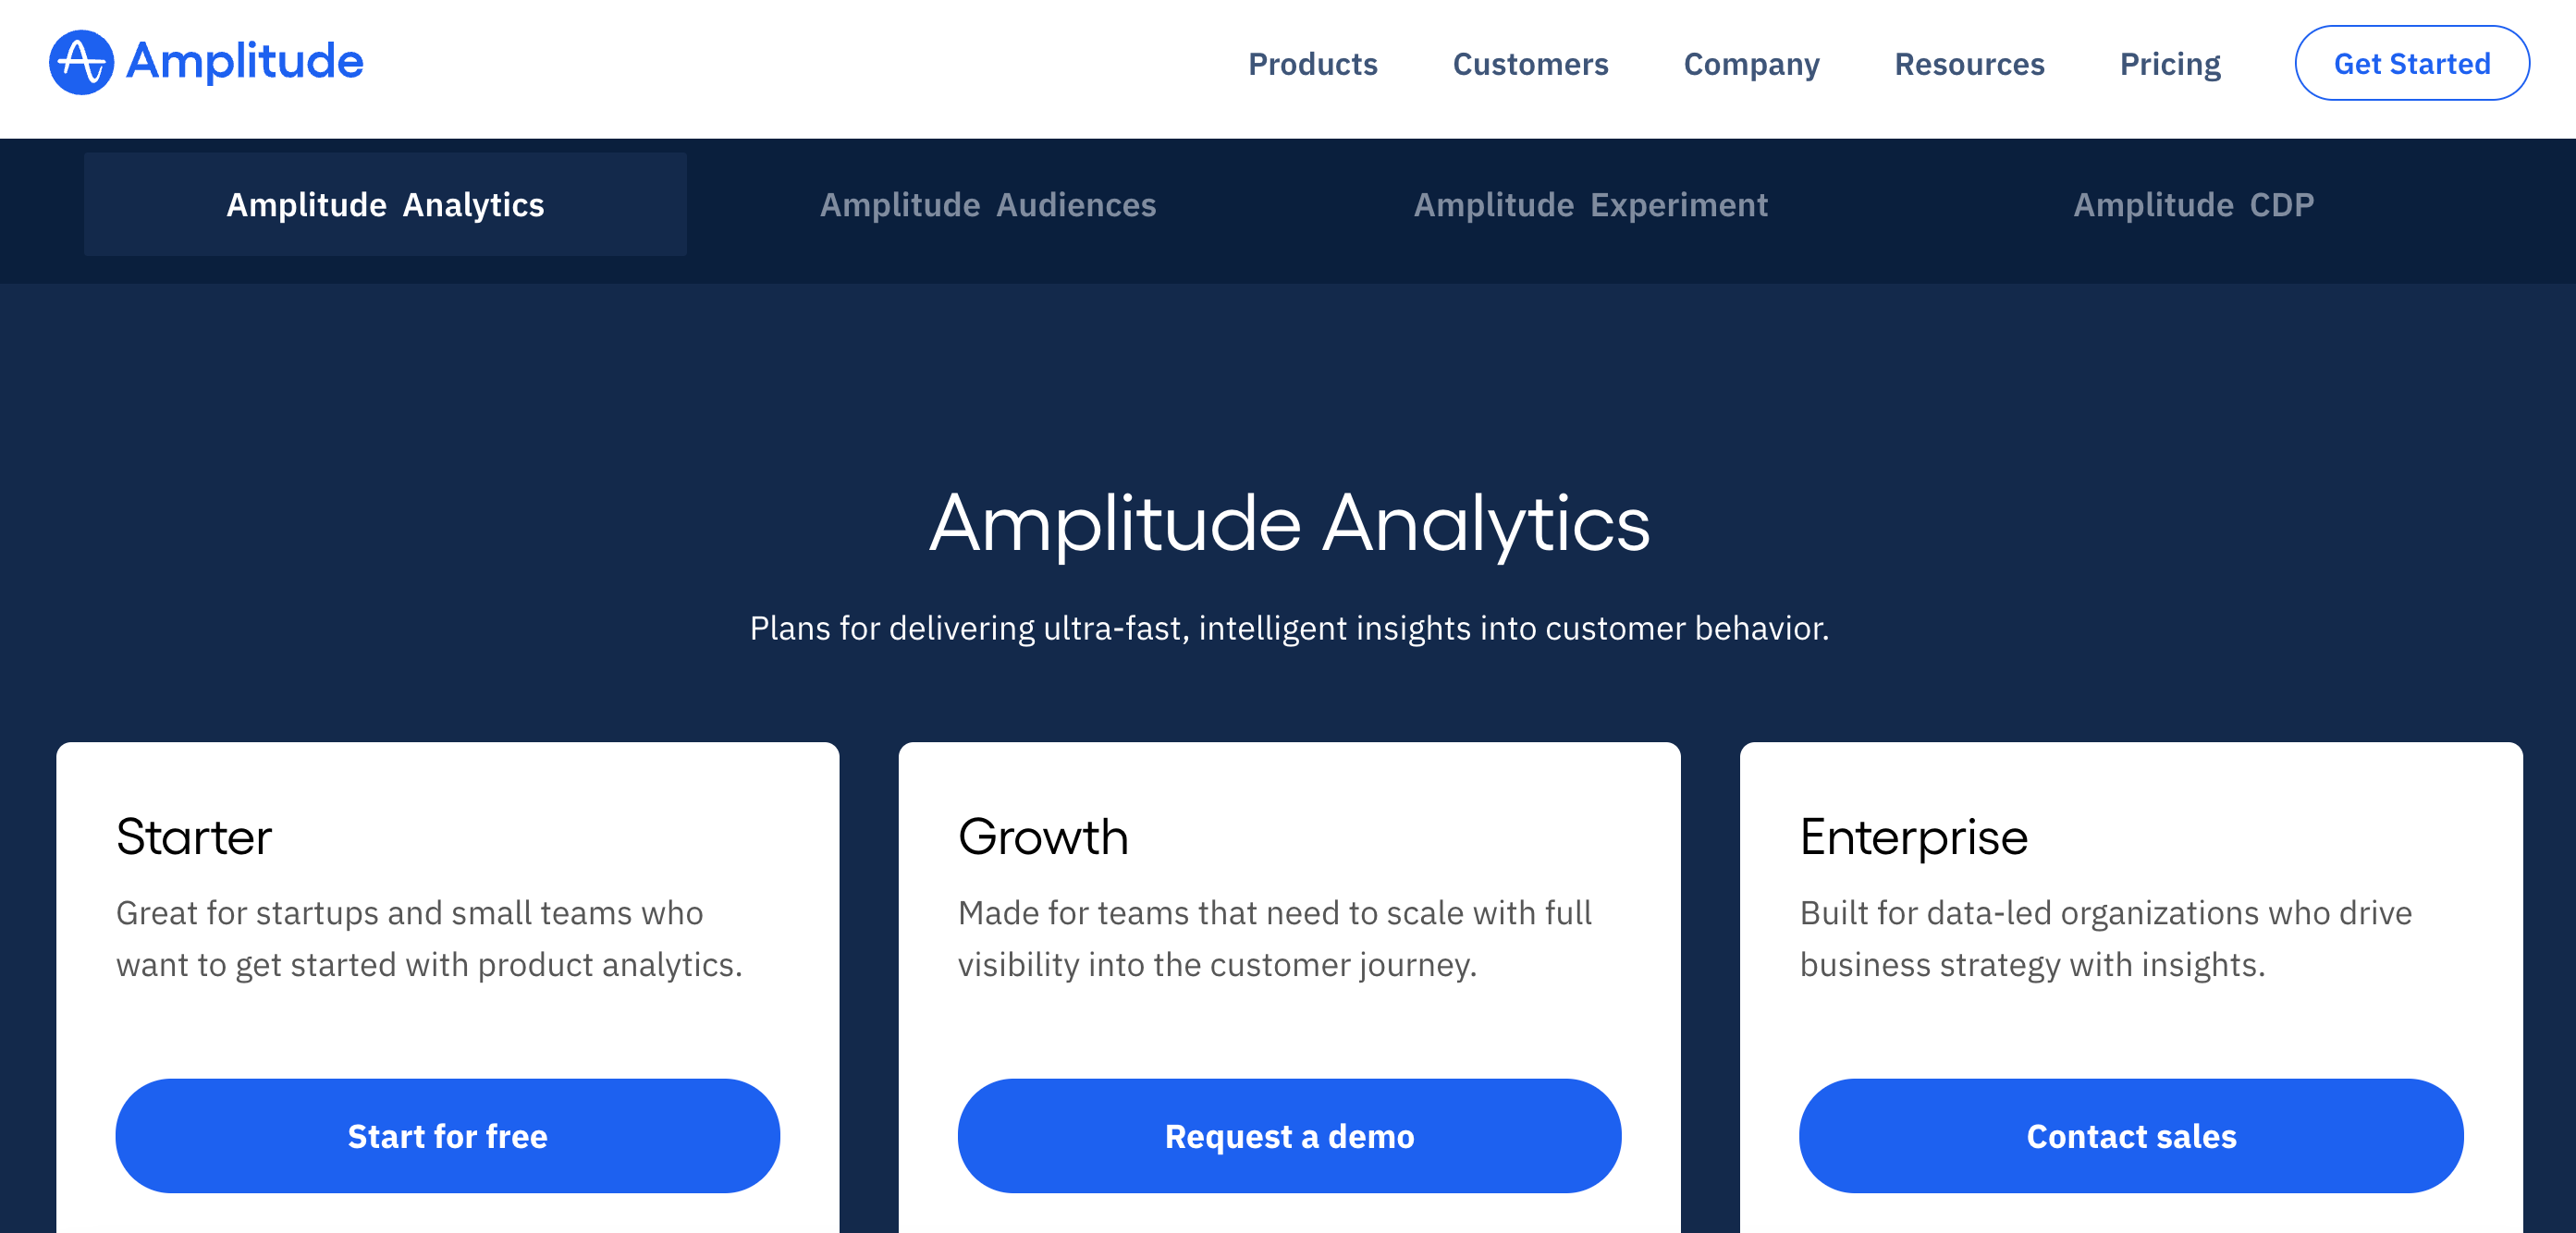
Amplitude encourages businesses to contact their sales team and request a demo before discussing pricing - and they don’t advertise their subscription plans on their website.
However, according to GetApp, there are three pricing levels available:
Starter - Free, 0-10 million monthly events
Business - $995/month, 0-100 million monthly events
Enterprise - pricing available on request, 0-10 billion+ monthly events
Each tool in Amplitude’s arsenal is priced individually, however. If you want to use all four options available (Analytics, Audiences, Experiment and CDP), you’ll need to pay for them individually.
Pros and Cons
Pros
Wide suite of features
Generous free plan
Good experimentation and A/B testing tools
Cons
No session replays
Tools are priced individually, and pricing is not transparent
Paid plans are very expensive
What is Smartlook?
Smartlook is a qualitative analytics solution for both mobile apps and websites that allows businesses to analyze user behavior and get real insights into how users interact with their products.
It’s essentially a visitor recorder, allowing you to watch how customers use your app or website. It allows you to see what your customers see, where they click, and which products catch their attention.
These session recordings are augmented with a suite of analytics features to give you a complete view of how to improve your UX.
Smartlook's Key Features
Feature 1: Session Recordings


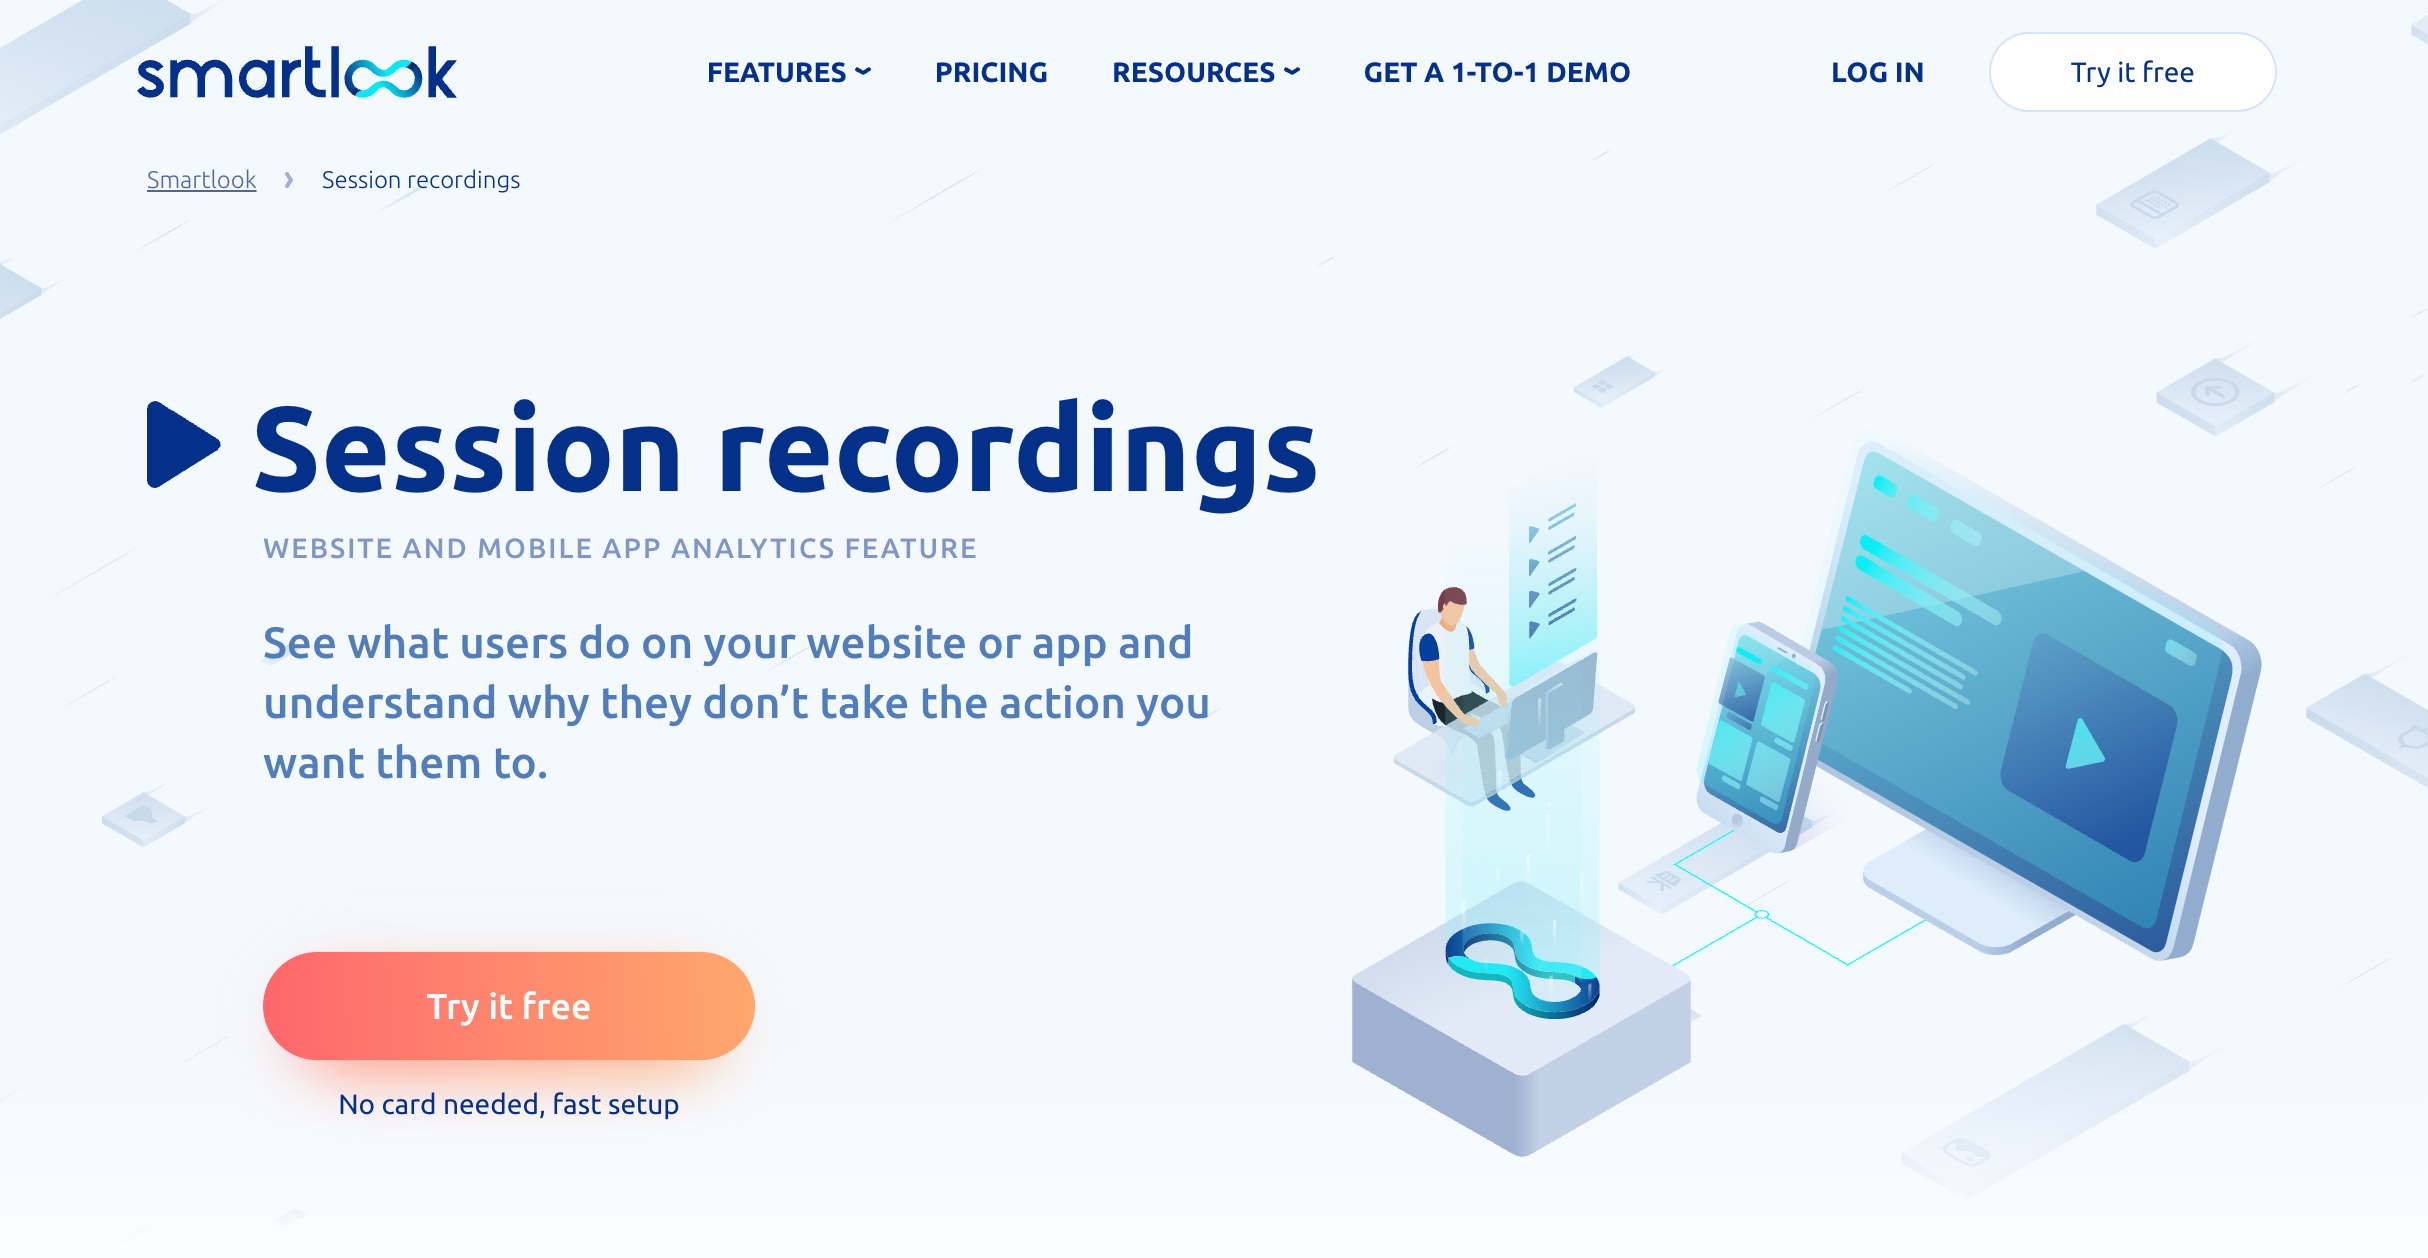
Smartlook’s primary feature is always-on session recordings. This tool will record each user’s session to help you identify how users interact with your product and where they’re getting stuck during their visit.
To make it easier to filter through replays, Smartlook tags each recording with useful metadata, including:
Location
Device
Visit Length
Events Completed
By applying these filters to your search, you can quickly find the session recordings that are most useful to you.
Feature 2: Heatmaps


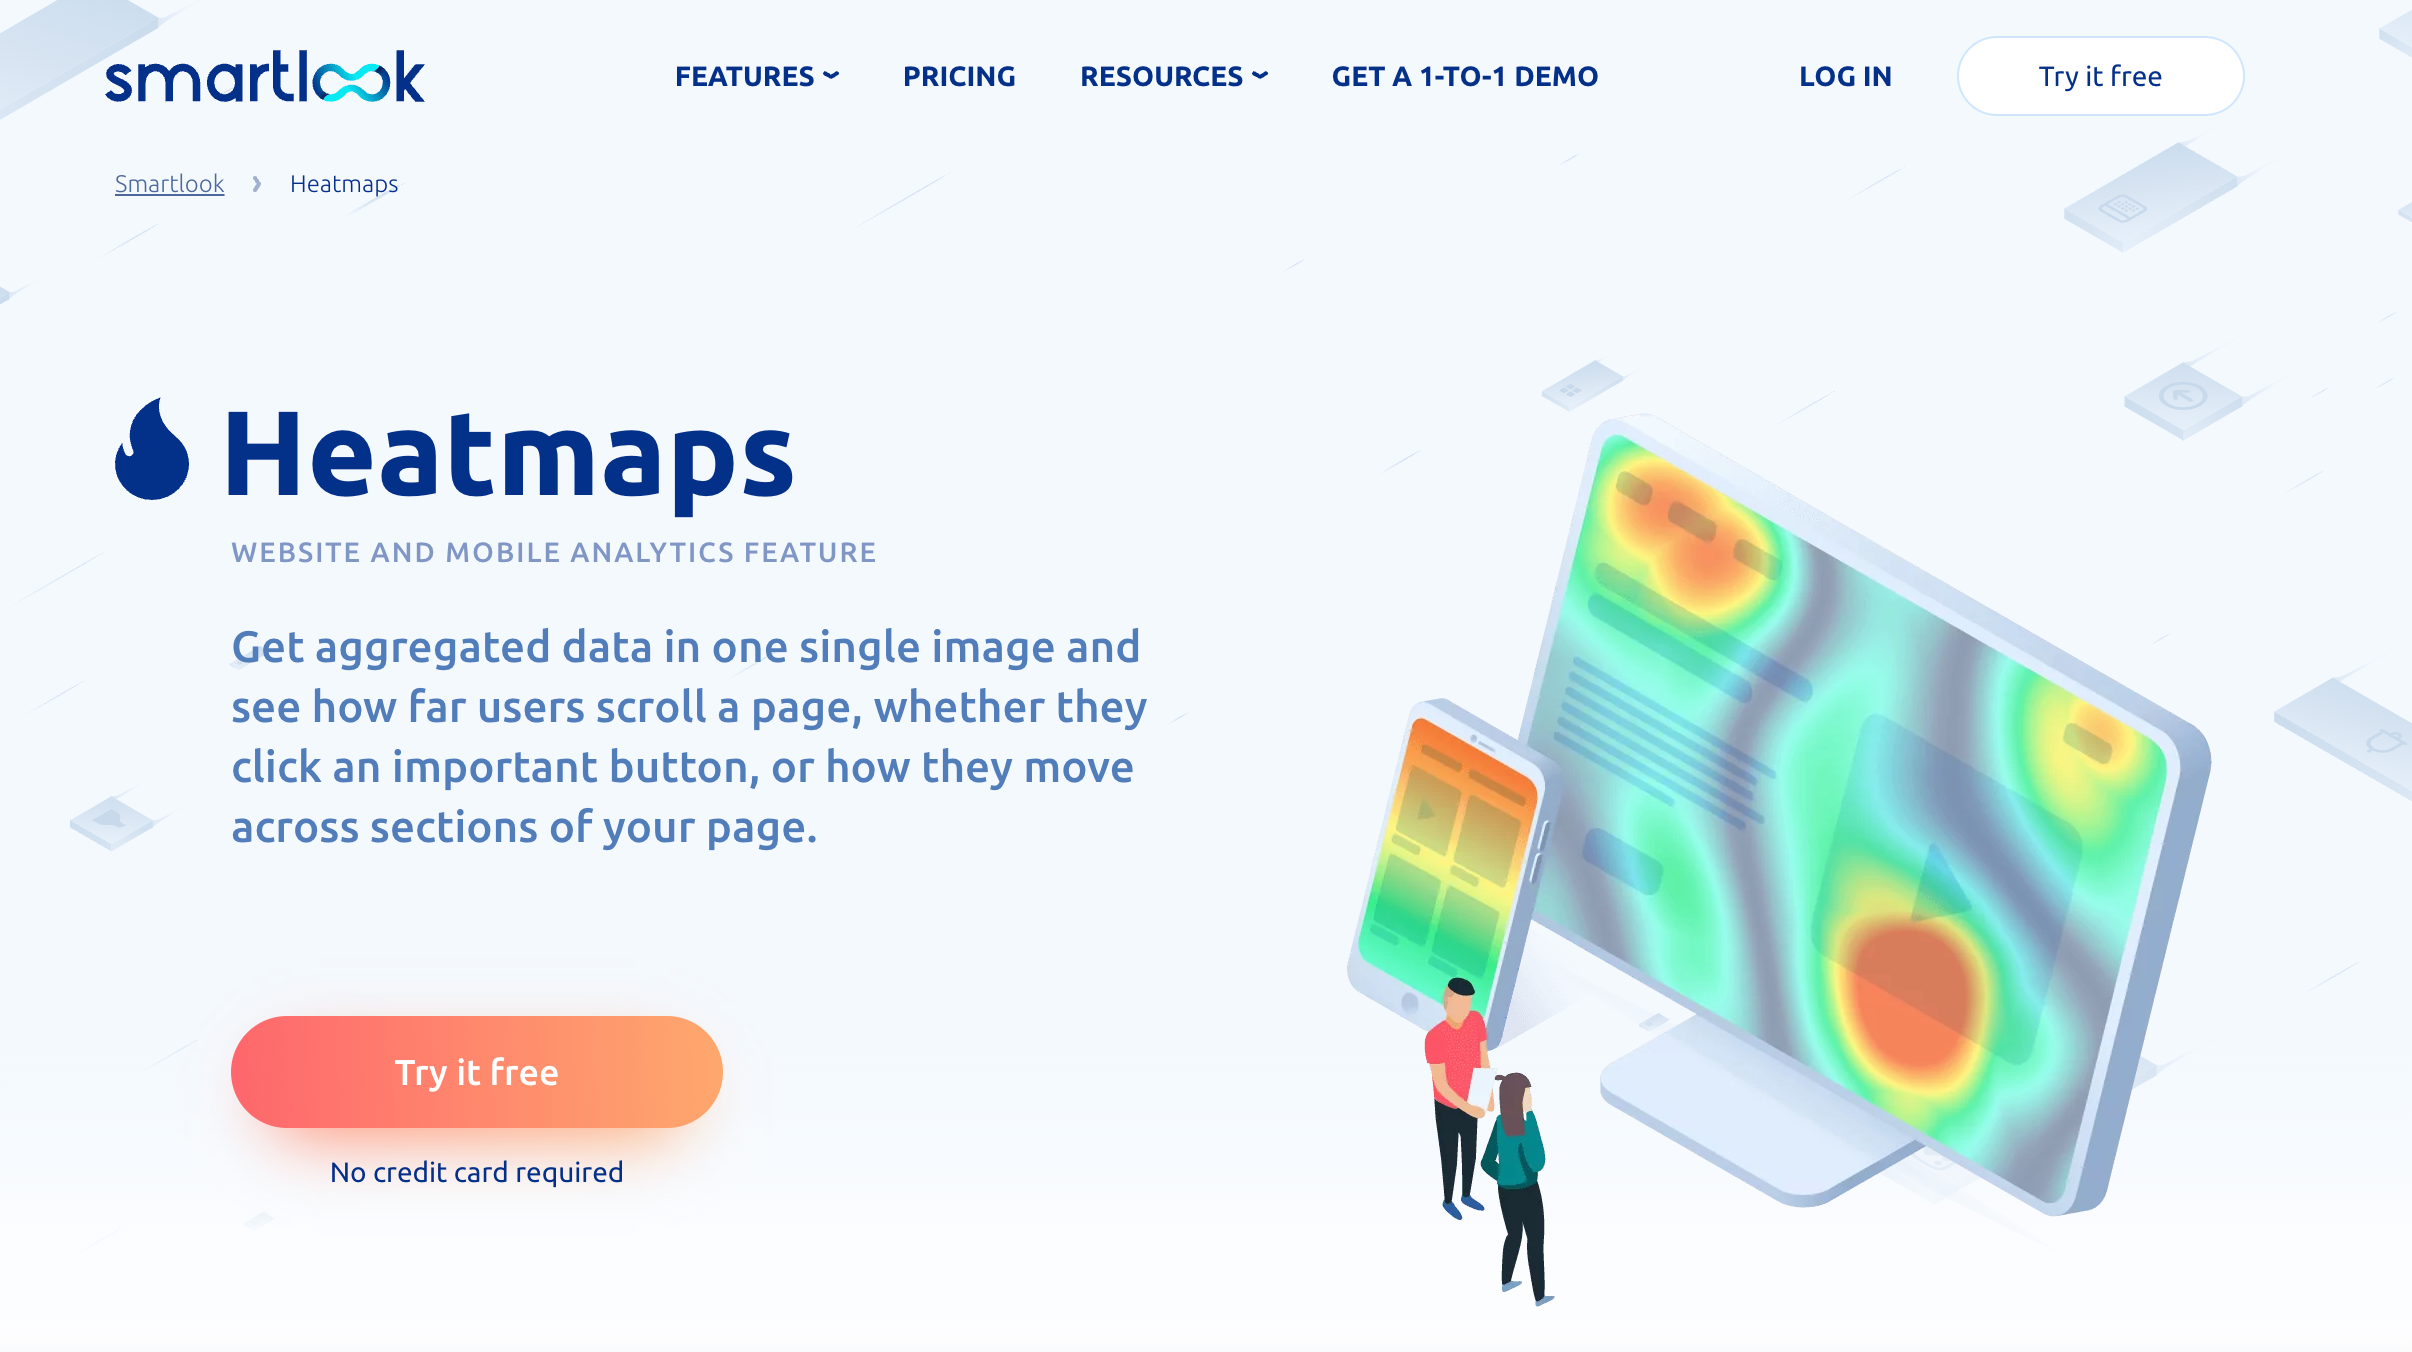
You can use heatmaps to see where users are focusing and interacting with your pages. Smartlook aggregates a myriad of user engagement data and generates a single image, showing what areas of your app users are engaging with.
You can generate heatmaps for:
Click maps: Where are users clicking or tapping the most? Which buttons are being clicked, and which aren’t?
Movement maps: Where are users moving their cursor to?
Scroll maps: How far down are users scrolling on your page?
Feature 3: Events


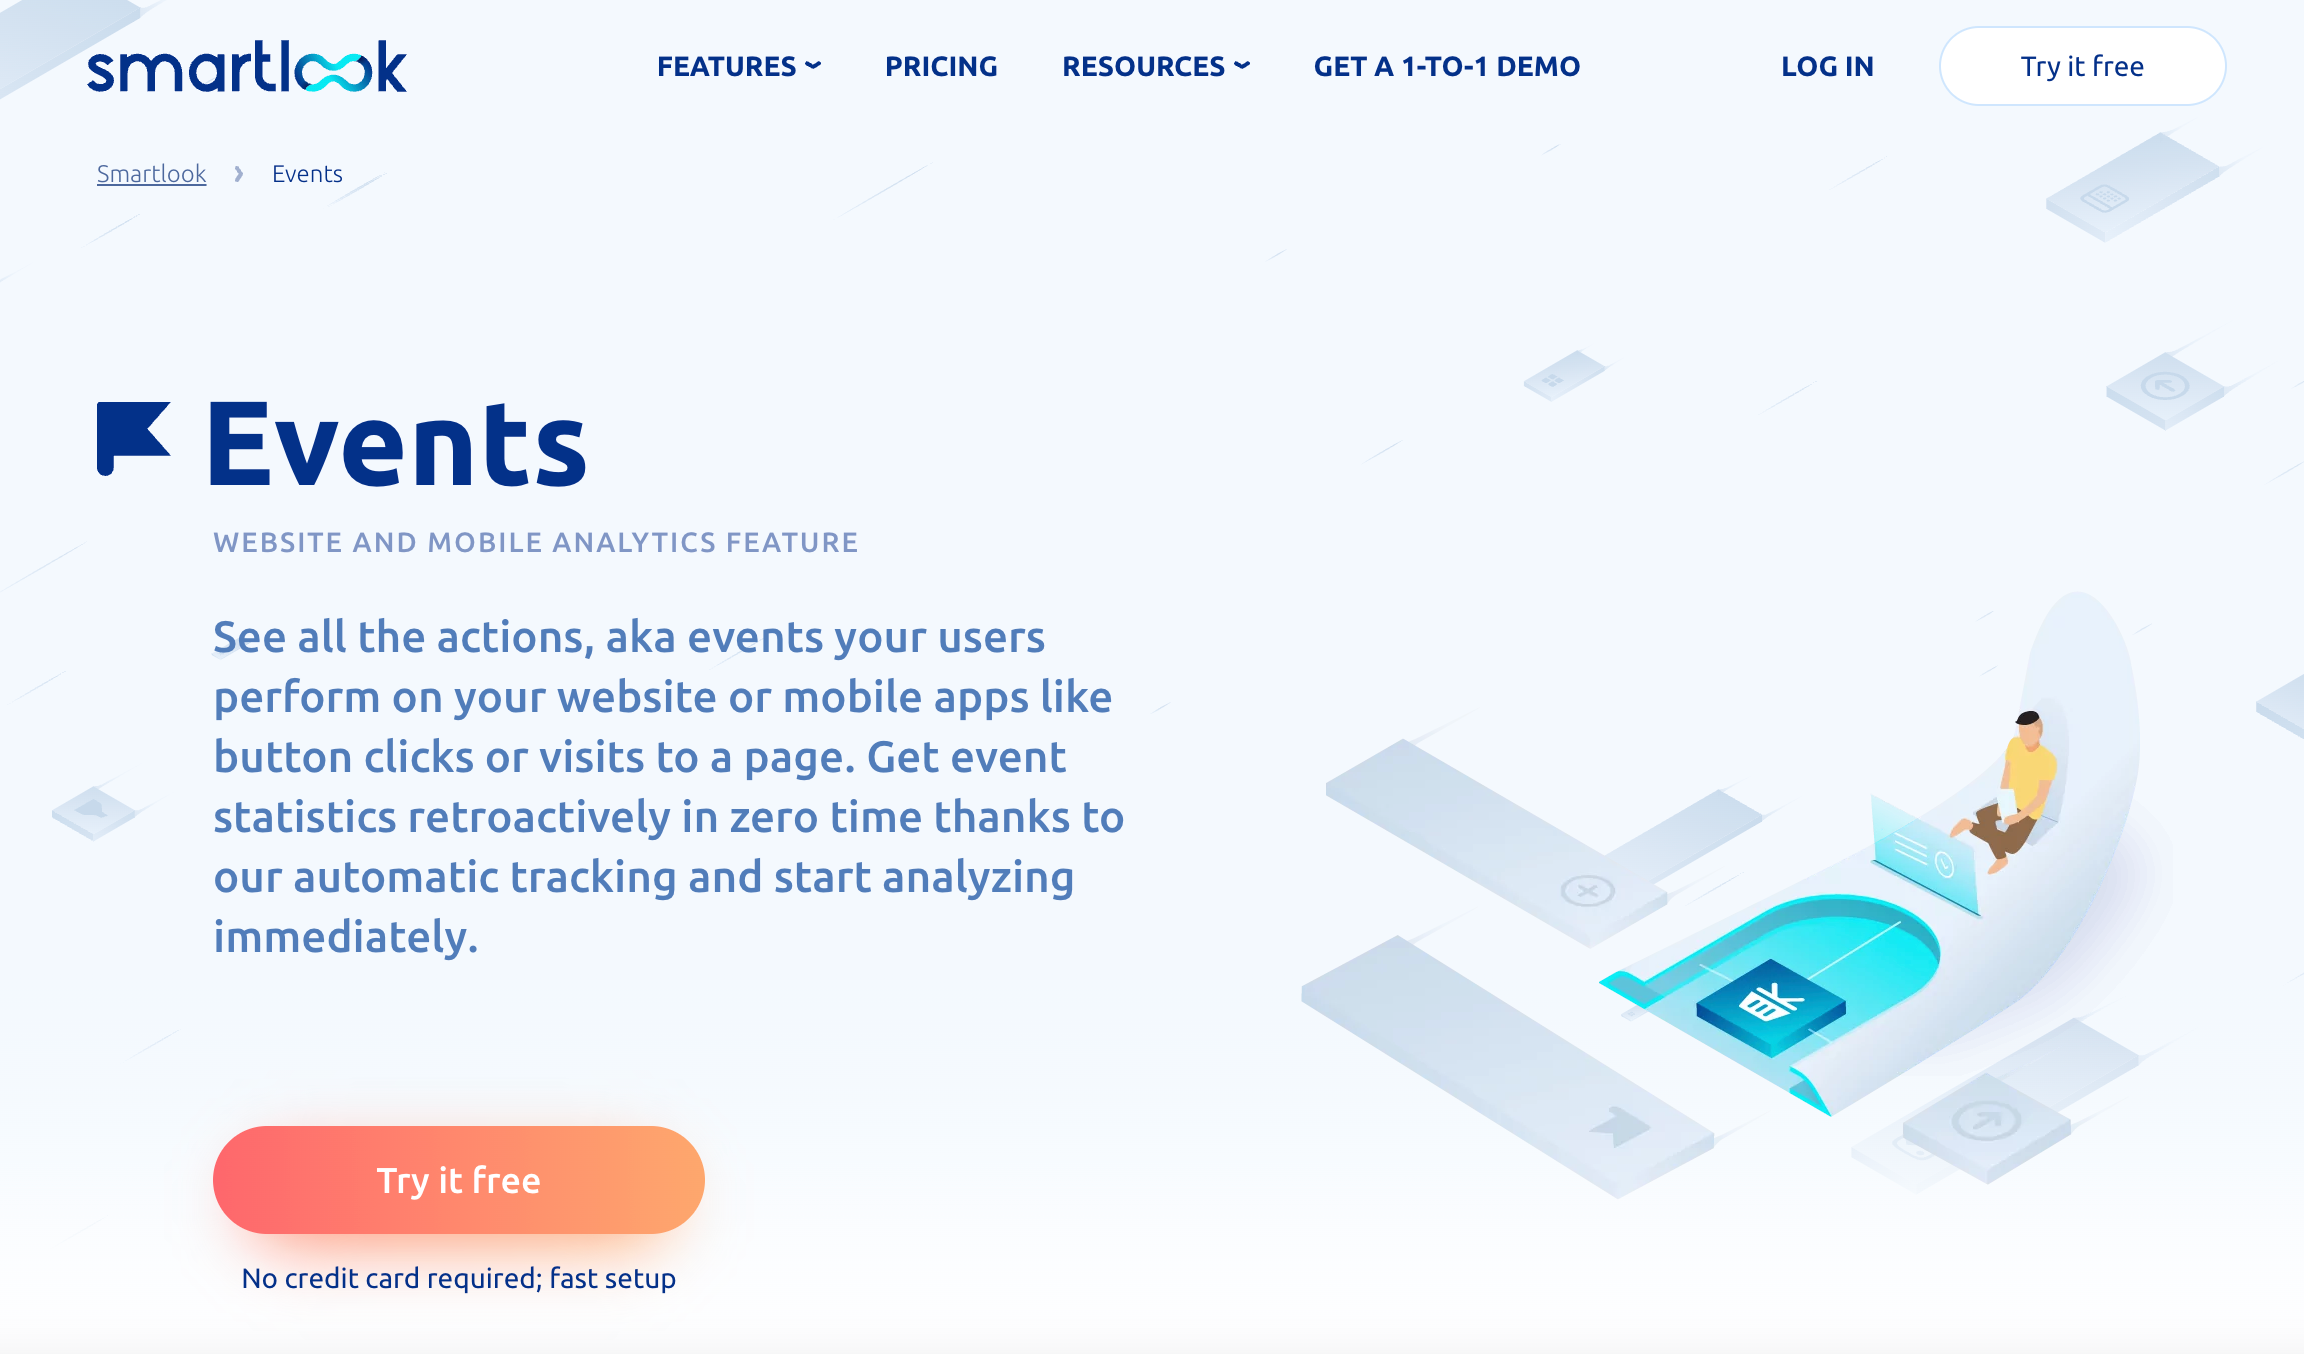
With Smartlook, you can access some great analytics about the events - or actions - performed on your or mobile app.
Events can be anything from a URL visit to a button click or typing in a specific phrase. Getting an overview of the actions performed on your website or app can help you optimize your user journey and deliver better UX.
Smartlook Pricing


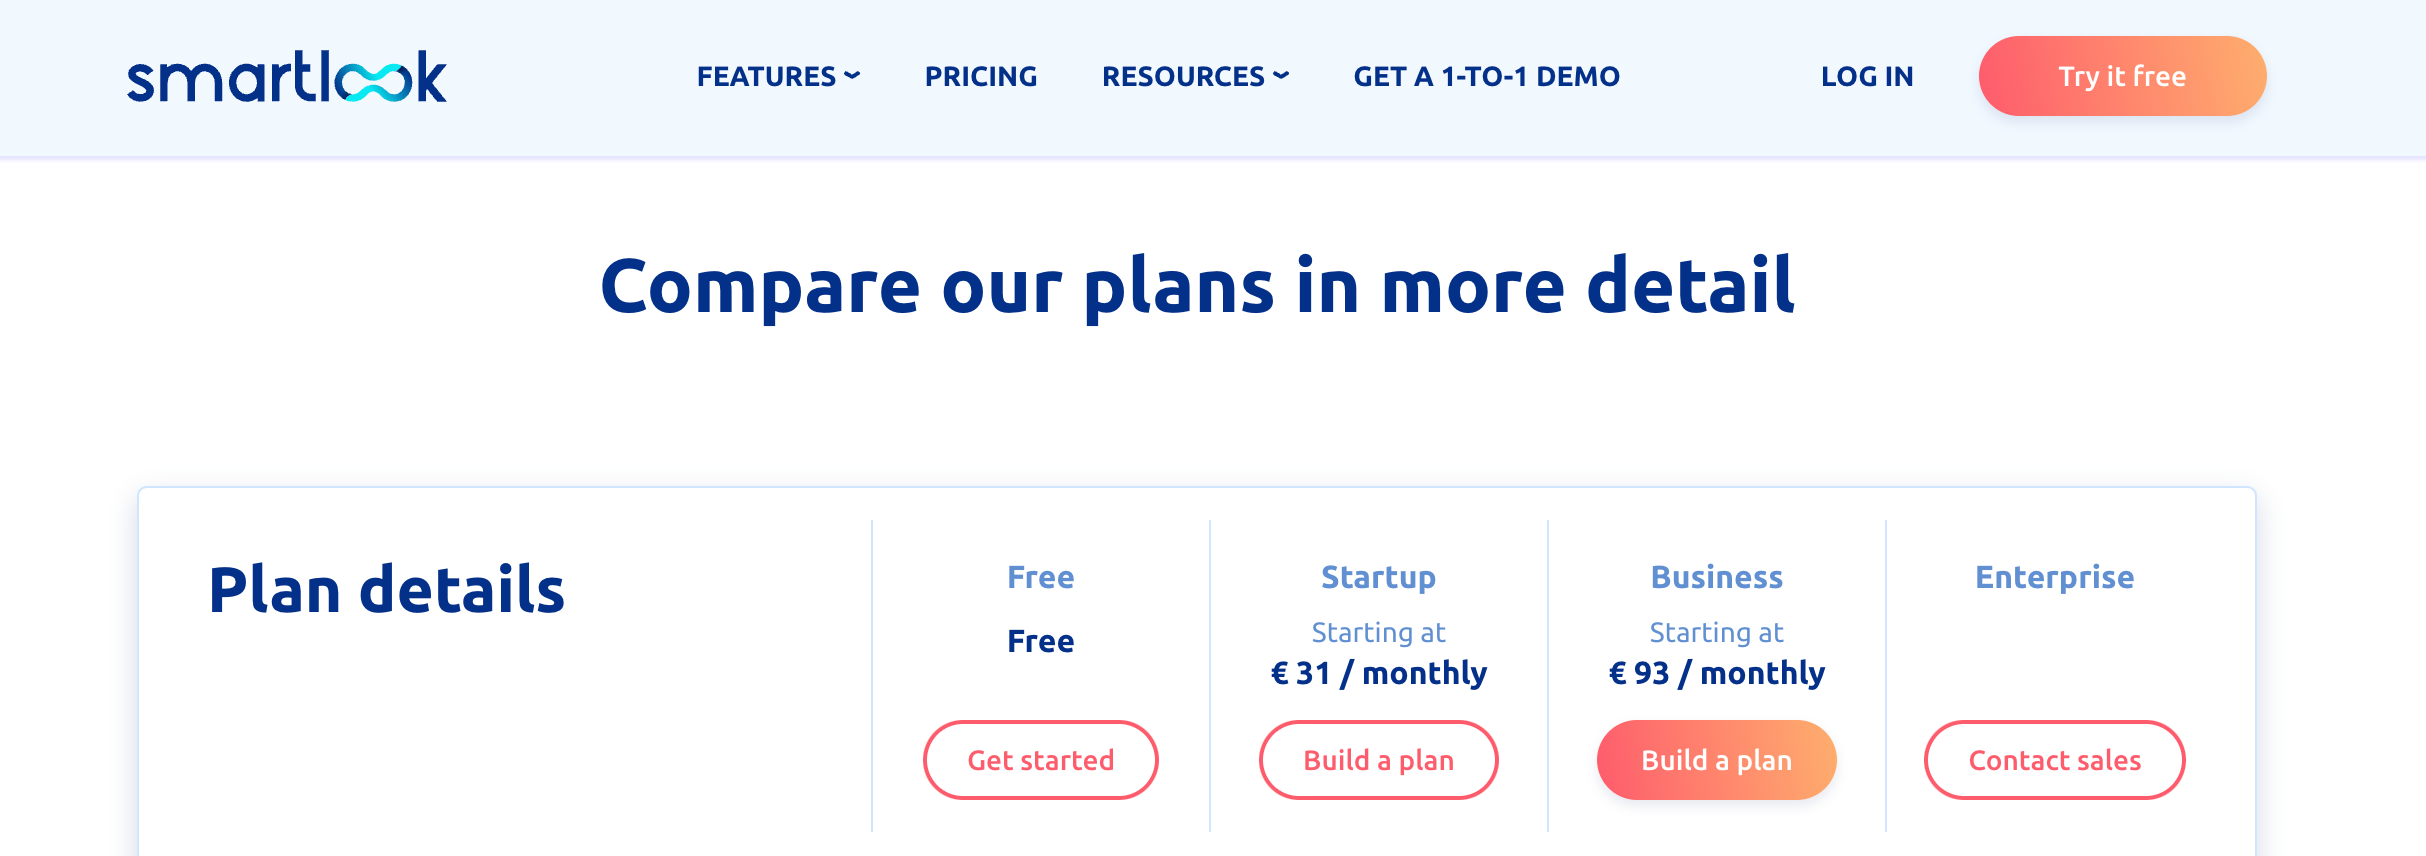
Smartlook offers a free plan - which allows you to record 1,500 sessions per month. Your session replays, and any other analytics data, will be held for a month before being deleted. With this tier, you can generate 3 heatmaps and track 2 events.
The Startup plan bumps up your session limit to 5,000 and unlocks 7 more heatmaps. The Business tier unlocks 15,000 session recordings and raises the heatmap limit up to 30. The data retention period also rises to 3 months with this plan.
Pros and Cons
Pros
Intuitive, easy-to-use session recorder
Generous Free plans for session recording
Replays are meta tagged and easily searchable
Cons
Limited number of heatmaps and event trackers in Free and Startup plans
Short data retention periods, even with paid plans
Higher tiers can get pricey
Smartlook vs Mixpanel vs Amplitude Alternative: UXCam


Need a product analytics tool that’s designed to help product & development teams build user-centric mobile apps? UXCam is the market leader in mobile app experience analytics. We empower product teams with contextual & fast insights.
We developed UXCam to help people deliver the perfect app - by understanding their users' needs. Our tool helps you identify issues that are plaguing your users - and through detailed data analytics, you can make more informed product decisions on how to solve them.
UXCam's Key Features
Feature 1: Session Replays


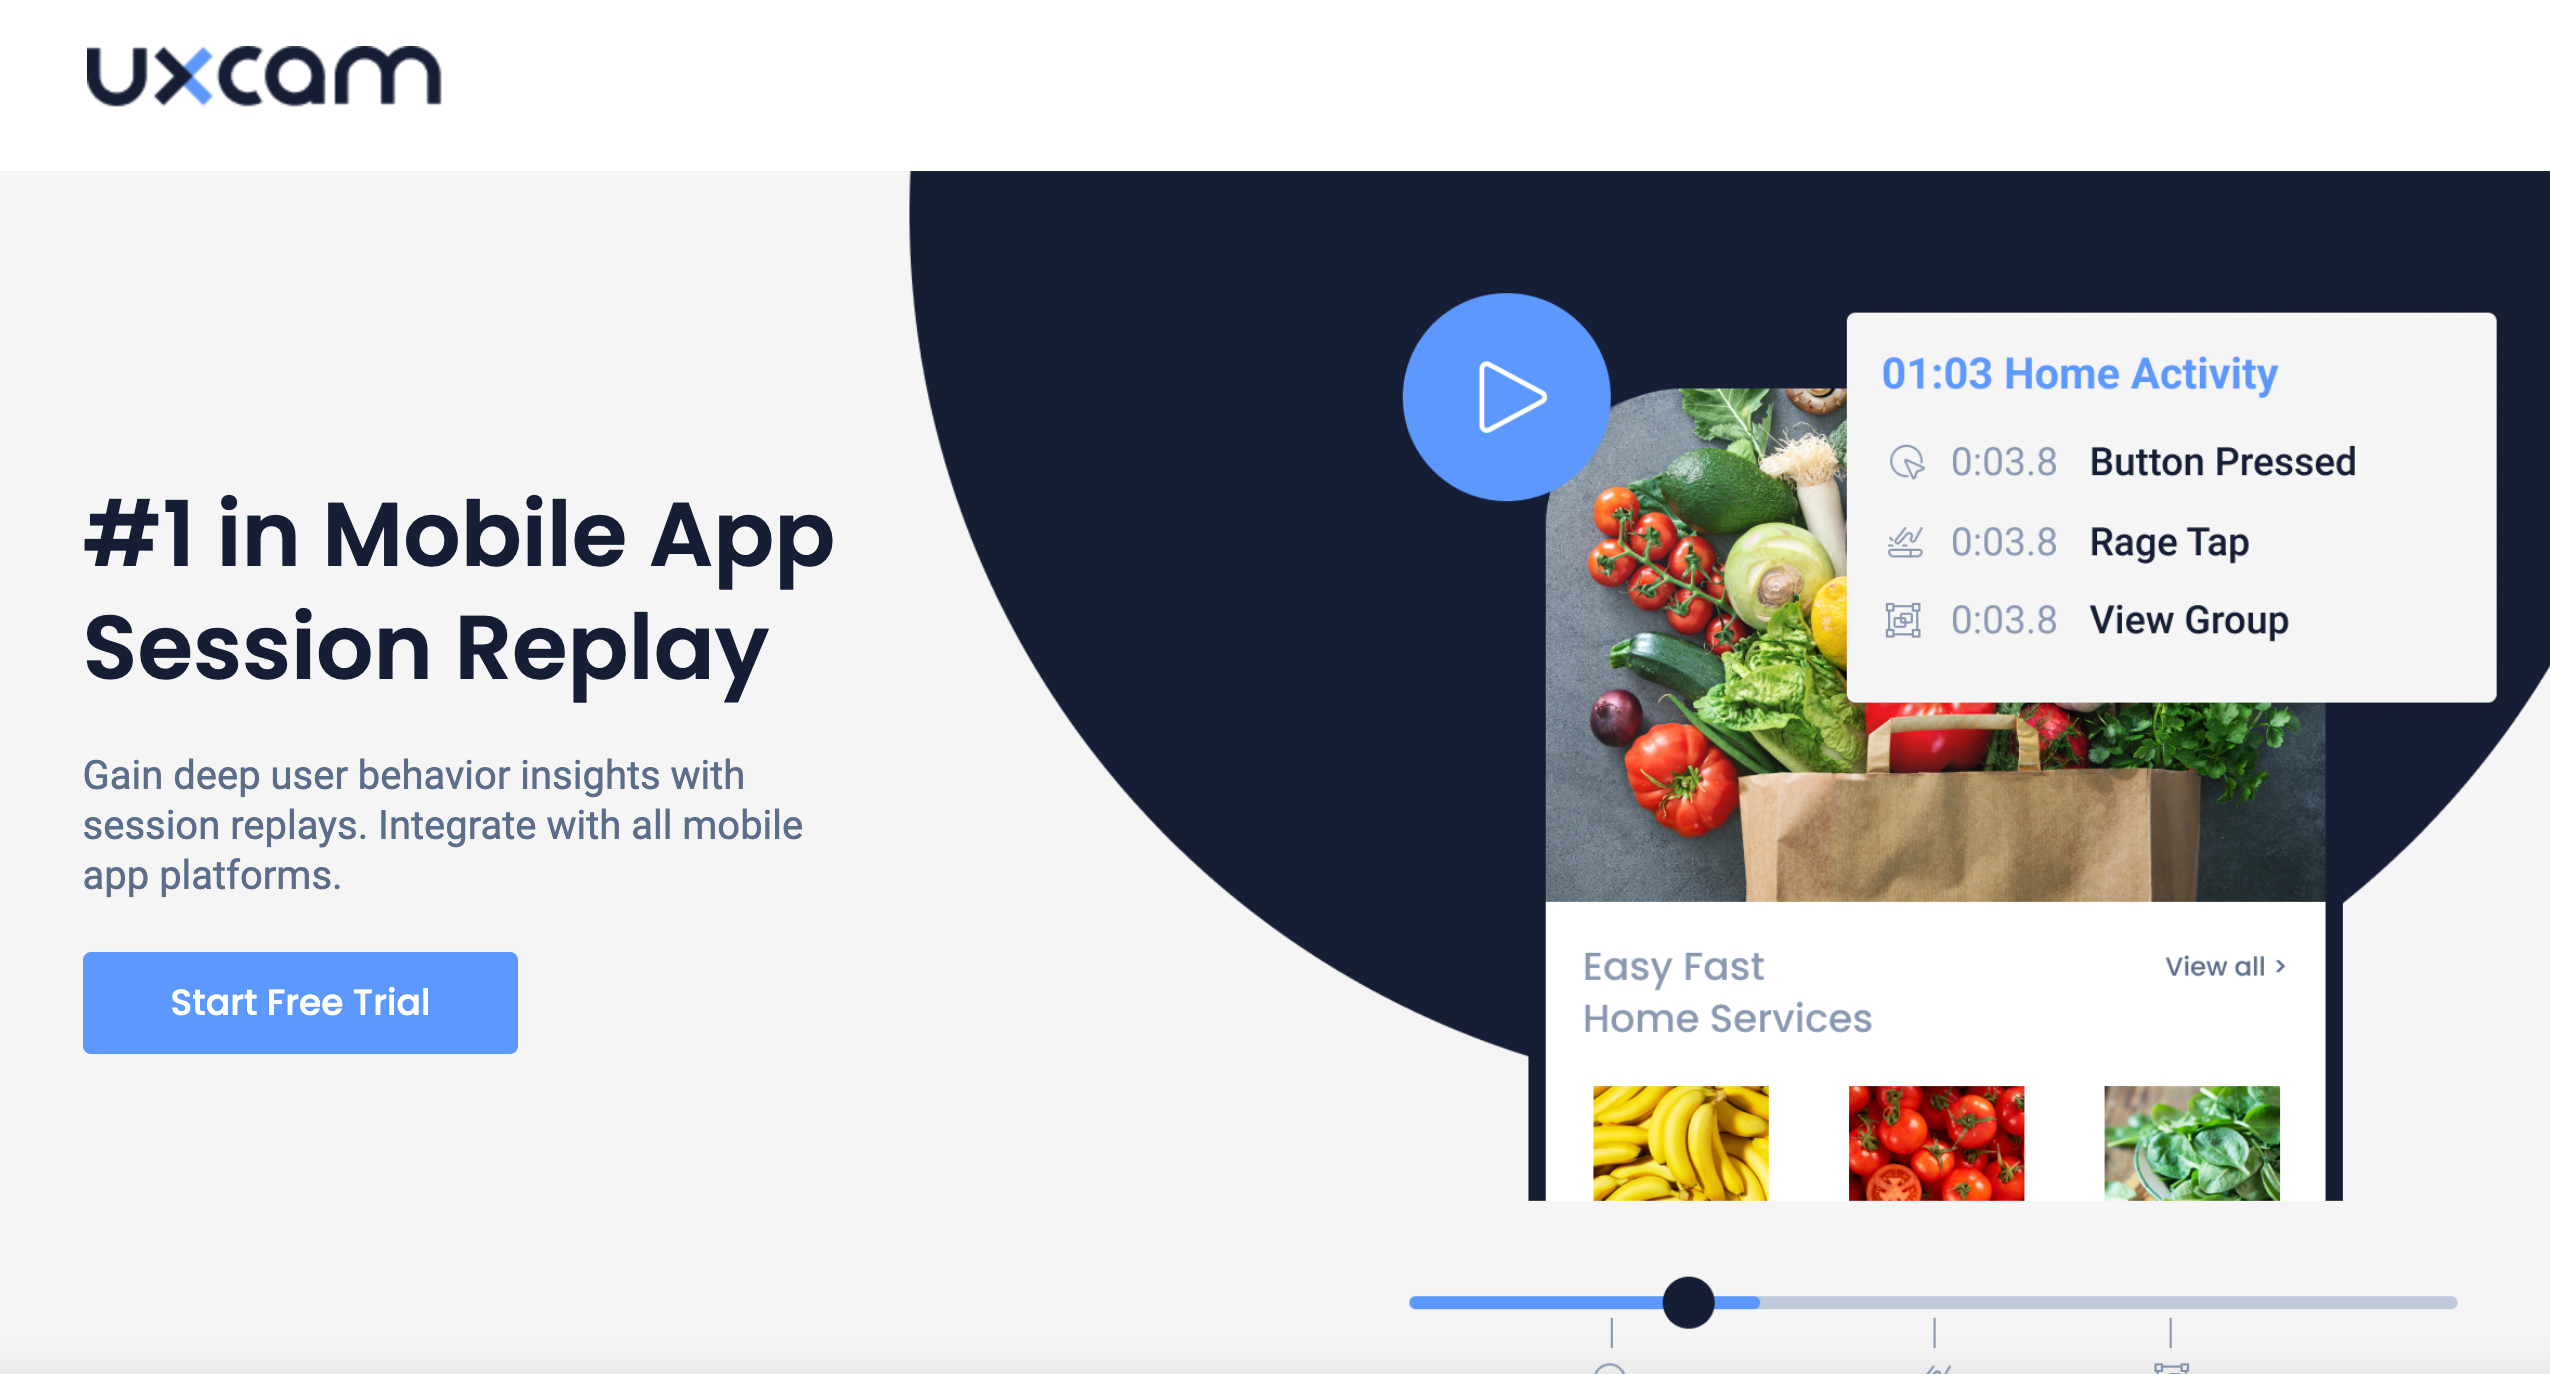
Our session replay tool will record your mobile app sessions and help you understand how your users move around your product and use your mobile UX.
You can use filters to identify sessions with user frustration signals. This helps you focus on the sessions that cause negative reviews and churn.
We understand the mobile app development collaborative process. Use our session commenting feature and easily tag other team members. Your team members can flag up identified usability problems and mark important moments to revisit later on.
Feature 2: User Analytics


App developers need to be data-driven to stay ahead of the competition and build engaging products. UXCam’s product analytics dashboard gives you a visual overlook of how your users engage with your app.
With UXCam, you can keep track of important user engagement KPIs. This is useful for not only identifying where users get stuck but also whether improvements and adjustments are solving usability issues.
Feature 3: Heatmap Analytics


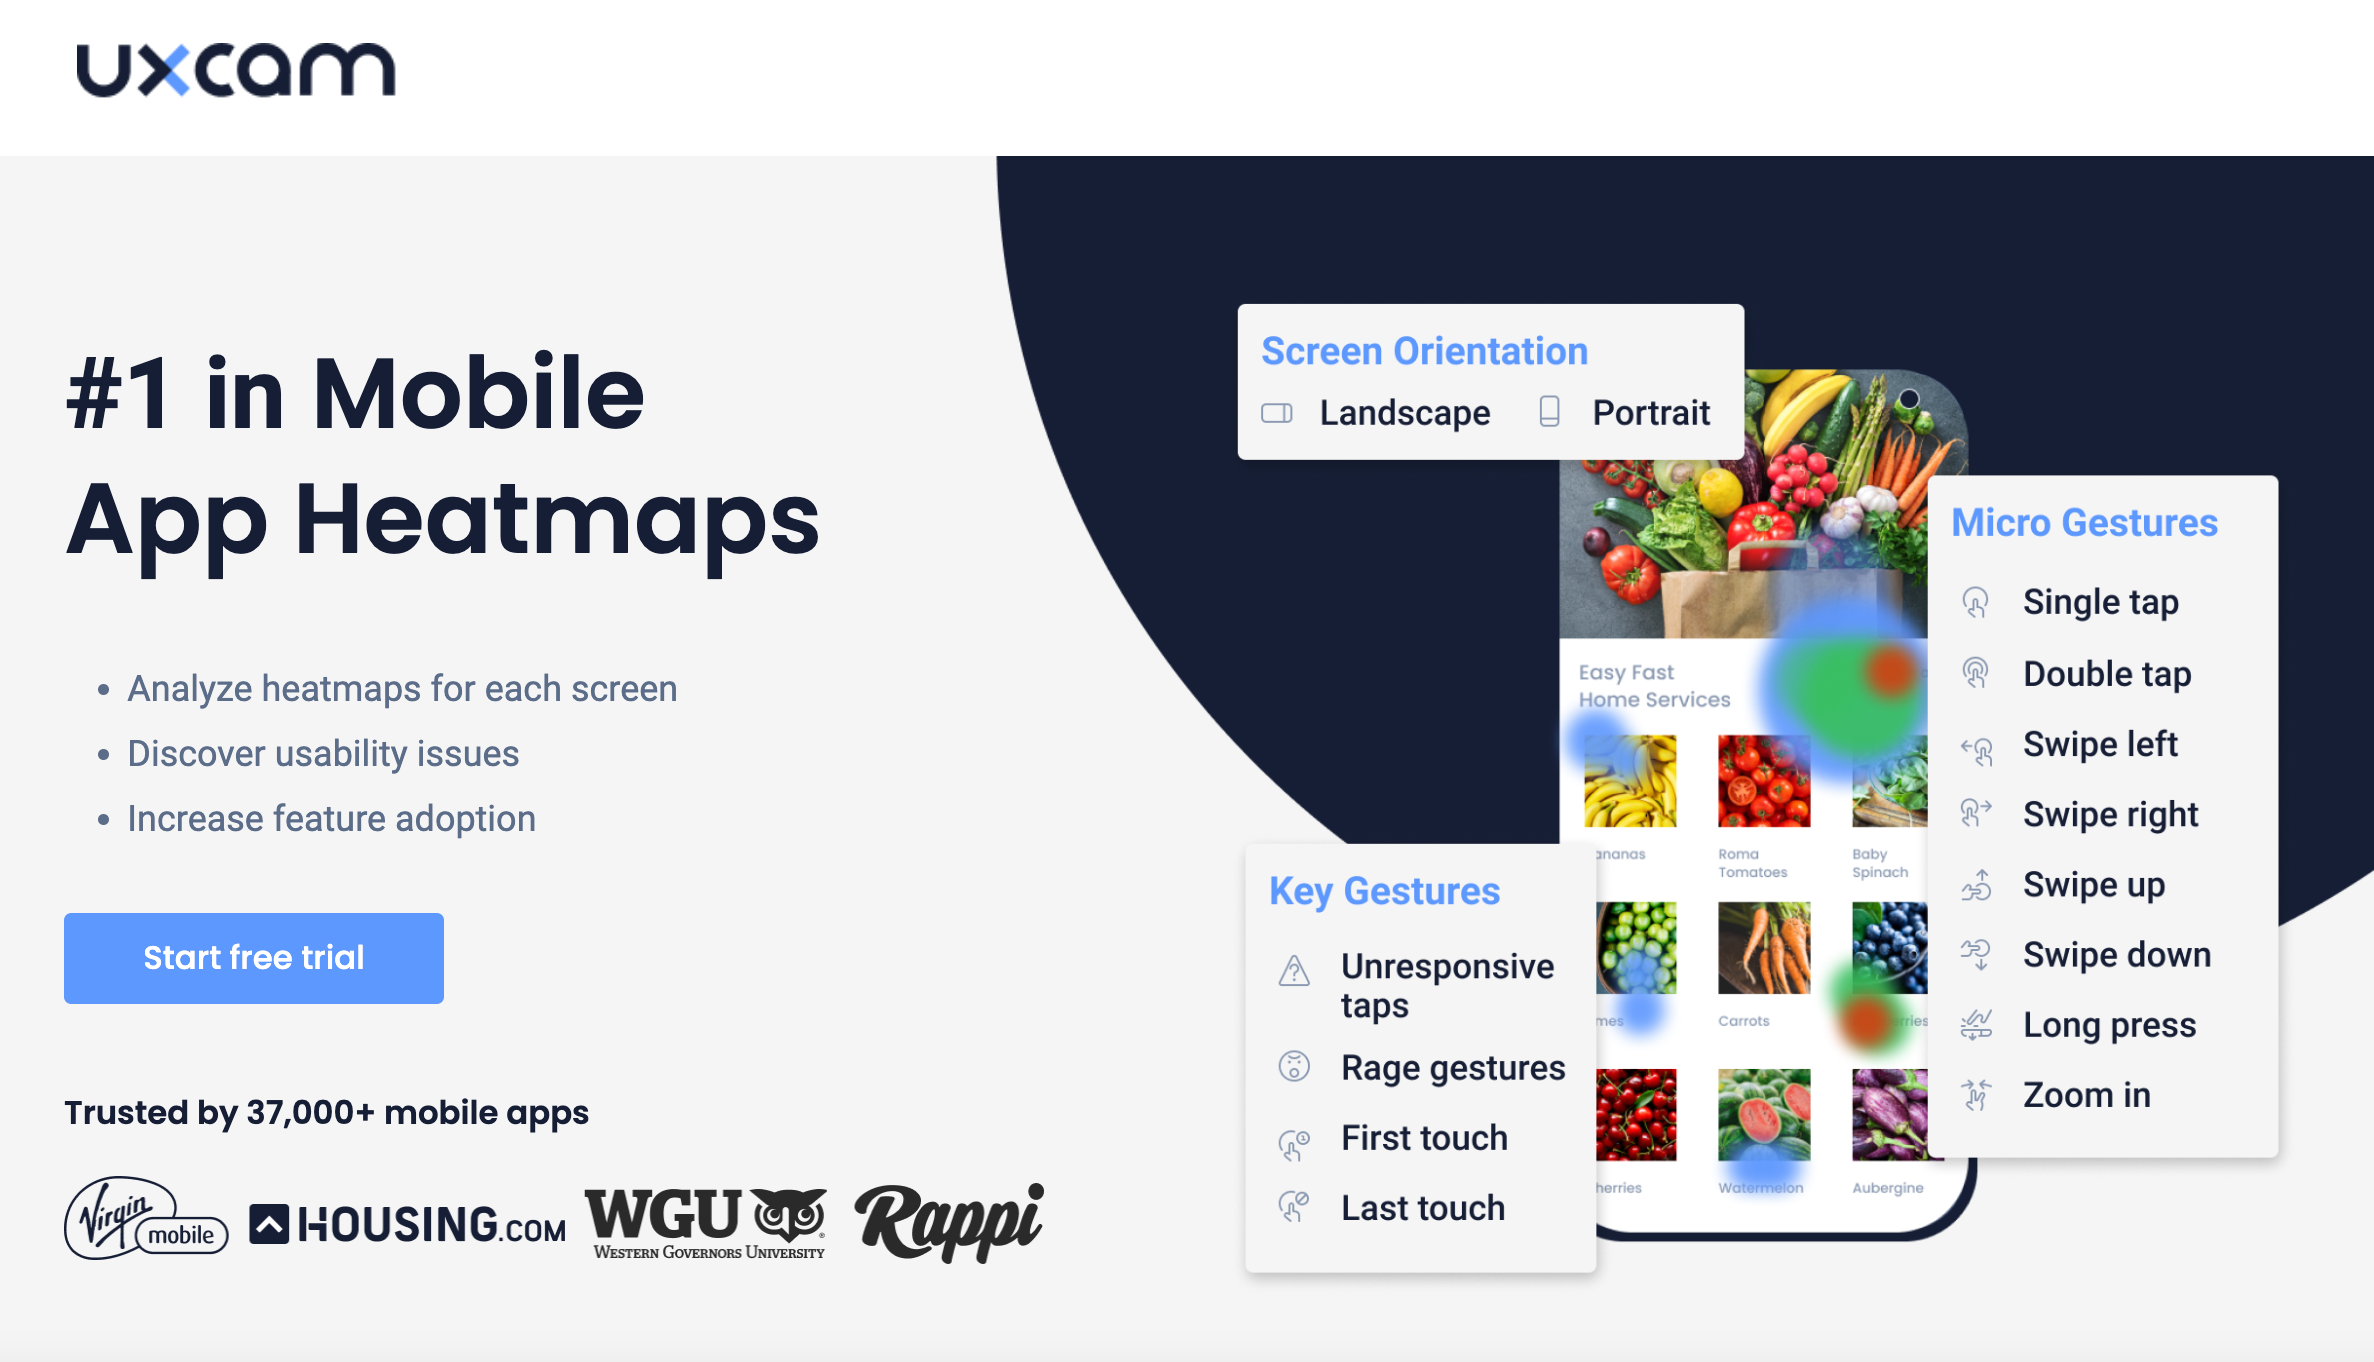
Discover and resolve the biggest bottlenecks that affect the user experience by analyzing heatmaps and analyzing how your users interact with your mobile app.
You can generate heatmaps to measure different behaviors on-screen like where users tapped, how far users scroll on your page, etc.
Our tool also tracks more advanced events, such as unresponsive taps, rage gestures, zoom-in, long presses, and more!
UXCam Pricing


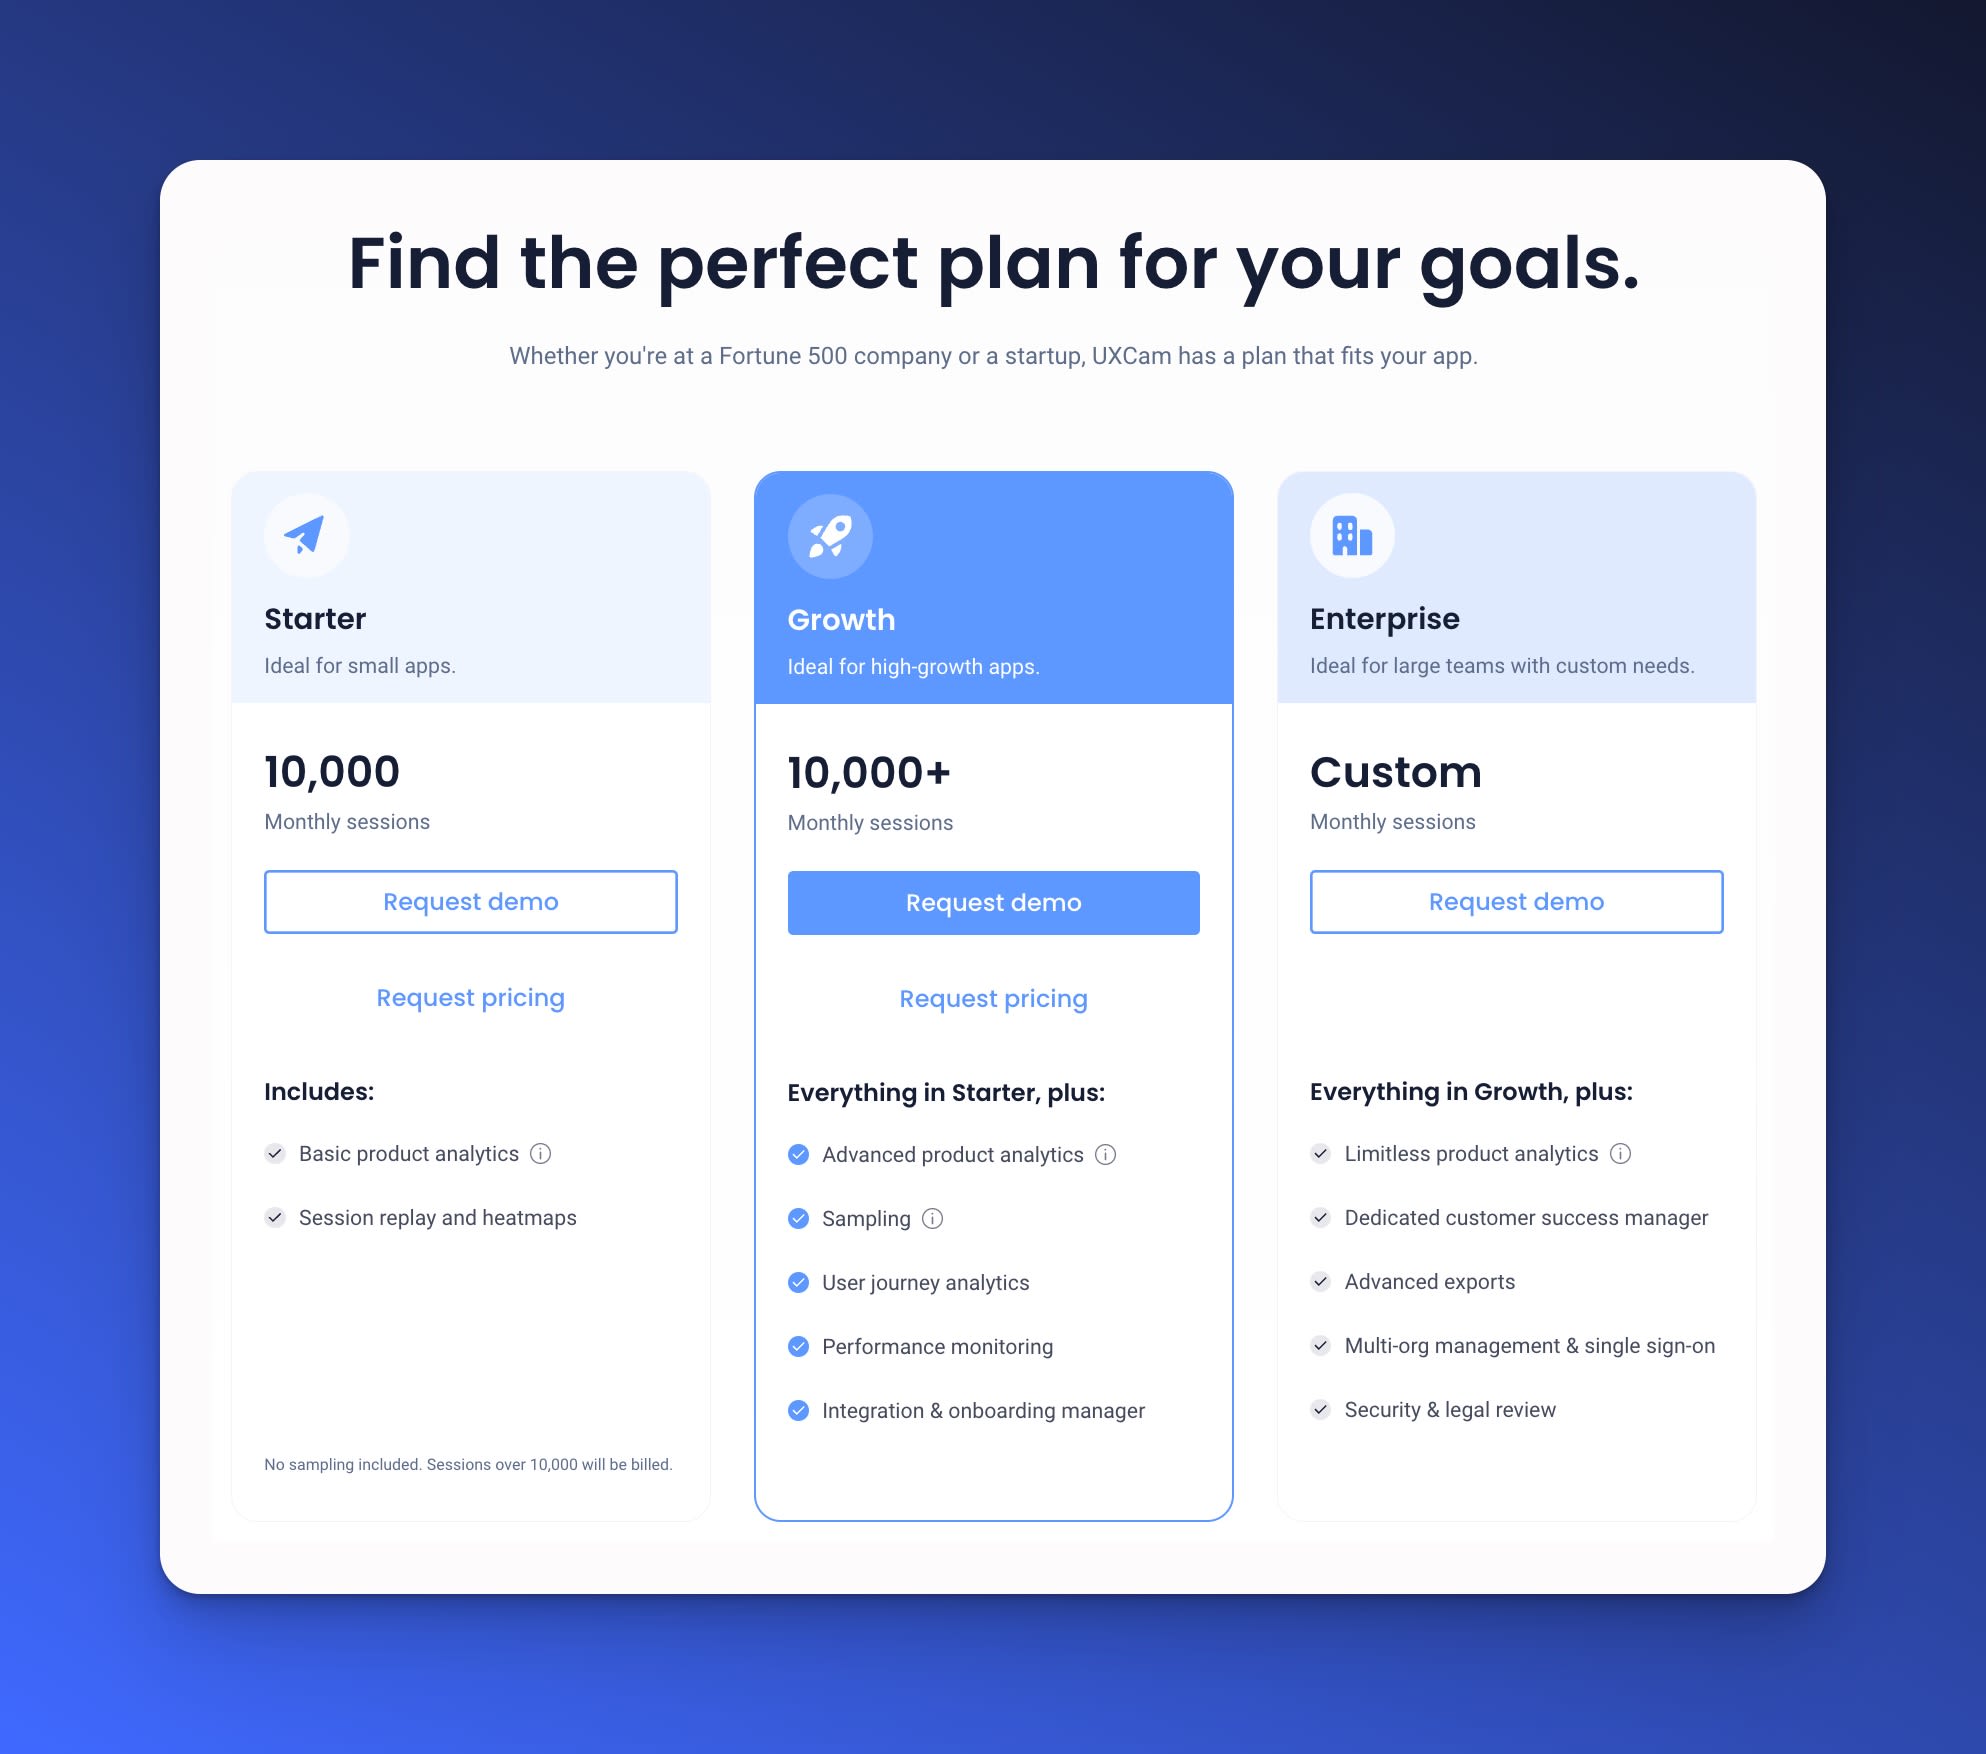
UXCam offers affordable pricing plans for every size business. If you’re starting out with product analytics, consider our free tier. It allows you to track up to 10,000 monthly sessions, track heatmaps, and more.
Need some extra capacity? The Starter plan is our most popular. This unlocks:
5 funnels
5 dashboards
Chat support
Up to 3 months video retention
Up to 24 months session retention
Unlike other product analytics dashboards, we don’t impose annoying limitations, such as limited heatmaps, and your analytics data is retained much longer than our competitors.
We even offer a full 14-day free trial, unlocking all our premium features with no credit card needed.
Pros and Cons
Pros
Brilliant user analytics dashboard
Session replays and heatmaps without unnecessary limitations
Very generous free plan, and affordable paid plans
Cons
Built primarily for mobile apps, website builders may prefer a more web-focused analytics tool
Conclusion
A mobile app analytics platform is the perfect way to collect and analyze key user engagement data. Using the insights and reports afforded by these tools helps ensure you’re building a user-centric mobile app that meets the needs of your customers.
UXCam is the market leader in qualitative user research but also provides some brilliant quantitative tools in its analytics dashboard. It’s the complete package for any mobile app developer to start building more engaging products.
Get started today at UXCam.com and try our 14-day free trial - no strings attached!
Related article
The most important mobile app analytics metrics to track
5 Top UXCam Alternatives and Best Competitors
Best Appsee alternative after the acquisition
Hotjar alternative for mobile apps
Recommended mobile app analytics best practice
Mobile app session recording and replay guide
Amplitude Pricing - Plan Comparison, Pros, Cons & Alternative


TABLE OF CONTENTS


Related articles


Product best practices
12 Apps with Great User Onboarding (2026 Examples)
The 12 mobile app onboarding flows I'd study if I were designing one today, with specific callouts for what each does well, common mistakes, and the...


Silvanus Alt, PhD
Founder & CEO | UXCam


Product best practices
Why creating a data-driven culture has less to do with data than you think
Kishan Gupta, CEO, shares 5 tips and techniques for fostering a data-driven culture based on his own experiences building and leading...


Kishan Gupta
Co-Founder of UXCam


Product best practices
Finance apps have a customer support problem, here's how to fix it
Learn about the customer support problem in finance apps and practical solutions to fix it in our latest blog post, and improve user satisfaction and...


Jane Leung
Product Analytics Expert